Network mapping software
Visualize network performance, topology, and services with OpManager's network mapping features
- Automated network discovery and mapping
- End-to-end network visibility
- Infrastructure monitoring and alerting

What is network mapping?
Network mapping involves drawing the logical connections of an IT network. The layout of the network devices and their connections is known as network topology. Network mapping software uses protocols like SNMP and ICMP to scan network nodes, map the network topology, and show them visually for IT teams to inspect. OpManager is a network monitoring software with powerful network mapping capabilities.
Network maps in OpManager
Gain network observability with organization maps
- Map network, server, and application connections in your organization with a single, sprawling map.
- Correlate network and infrastructure-level issues with app performance and user-experience to speed up root cause analysis.
- Spot faulty apps, nodes, and servers and see how they affect business service delivery at a single glance.

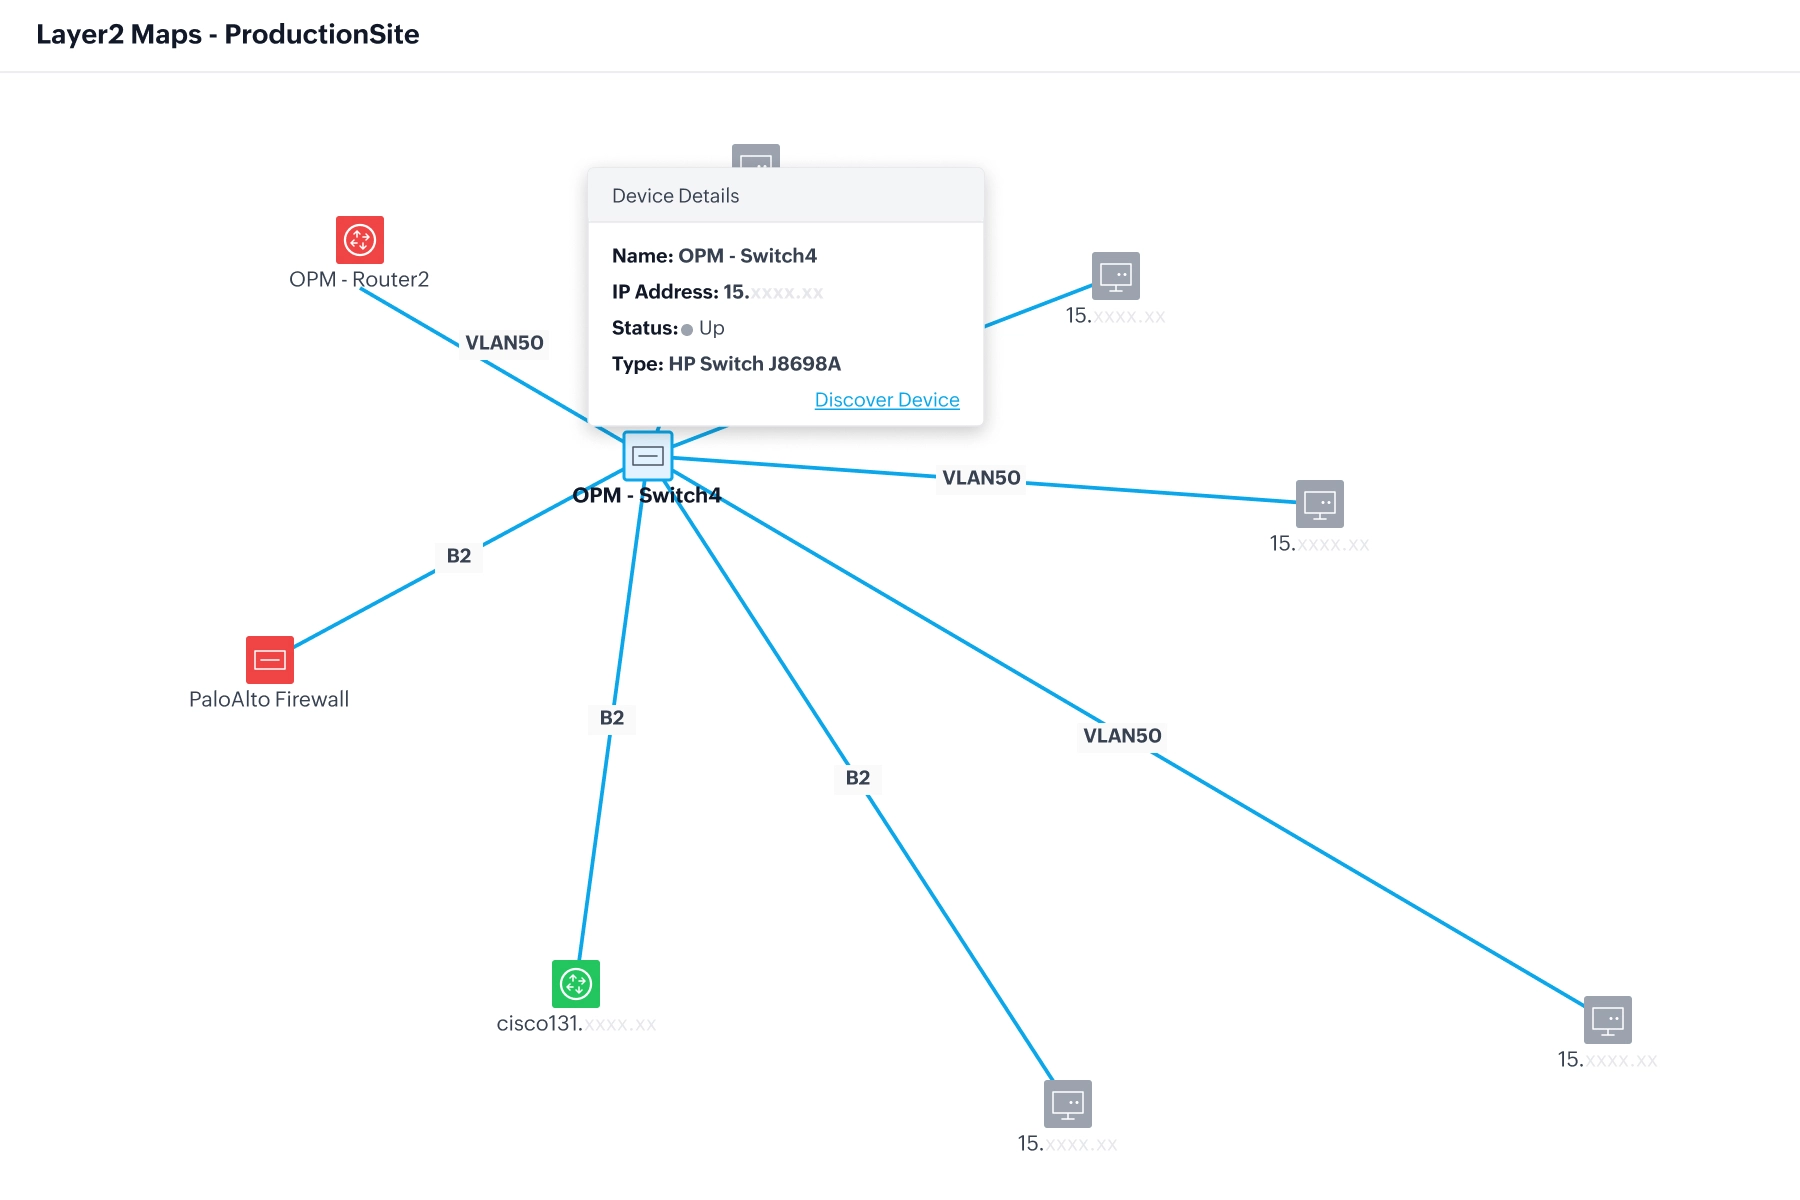
Network topology mapping with layer 2 maps
- Automatically discover and map layer 2 network architecture with network protocols like LLDP, CDP, ARP, FDB, and IPROUTE.
- Schedule regular re-discoveries to update the map for changes in network topology.
- Check the uptime and performance of network nodes with colour-coded mapping elements.
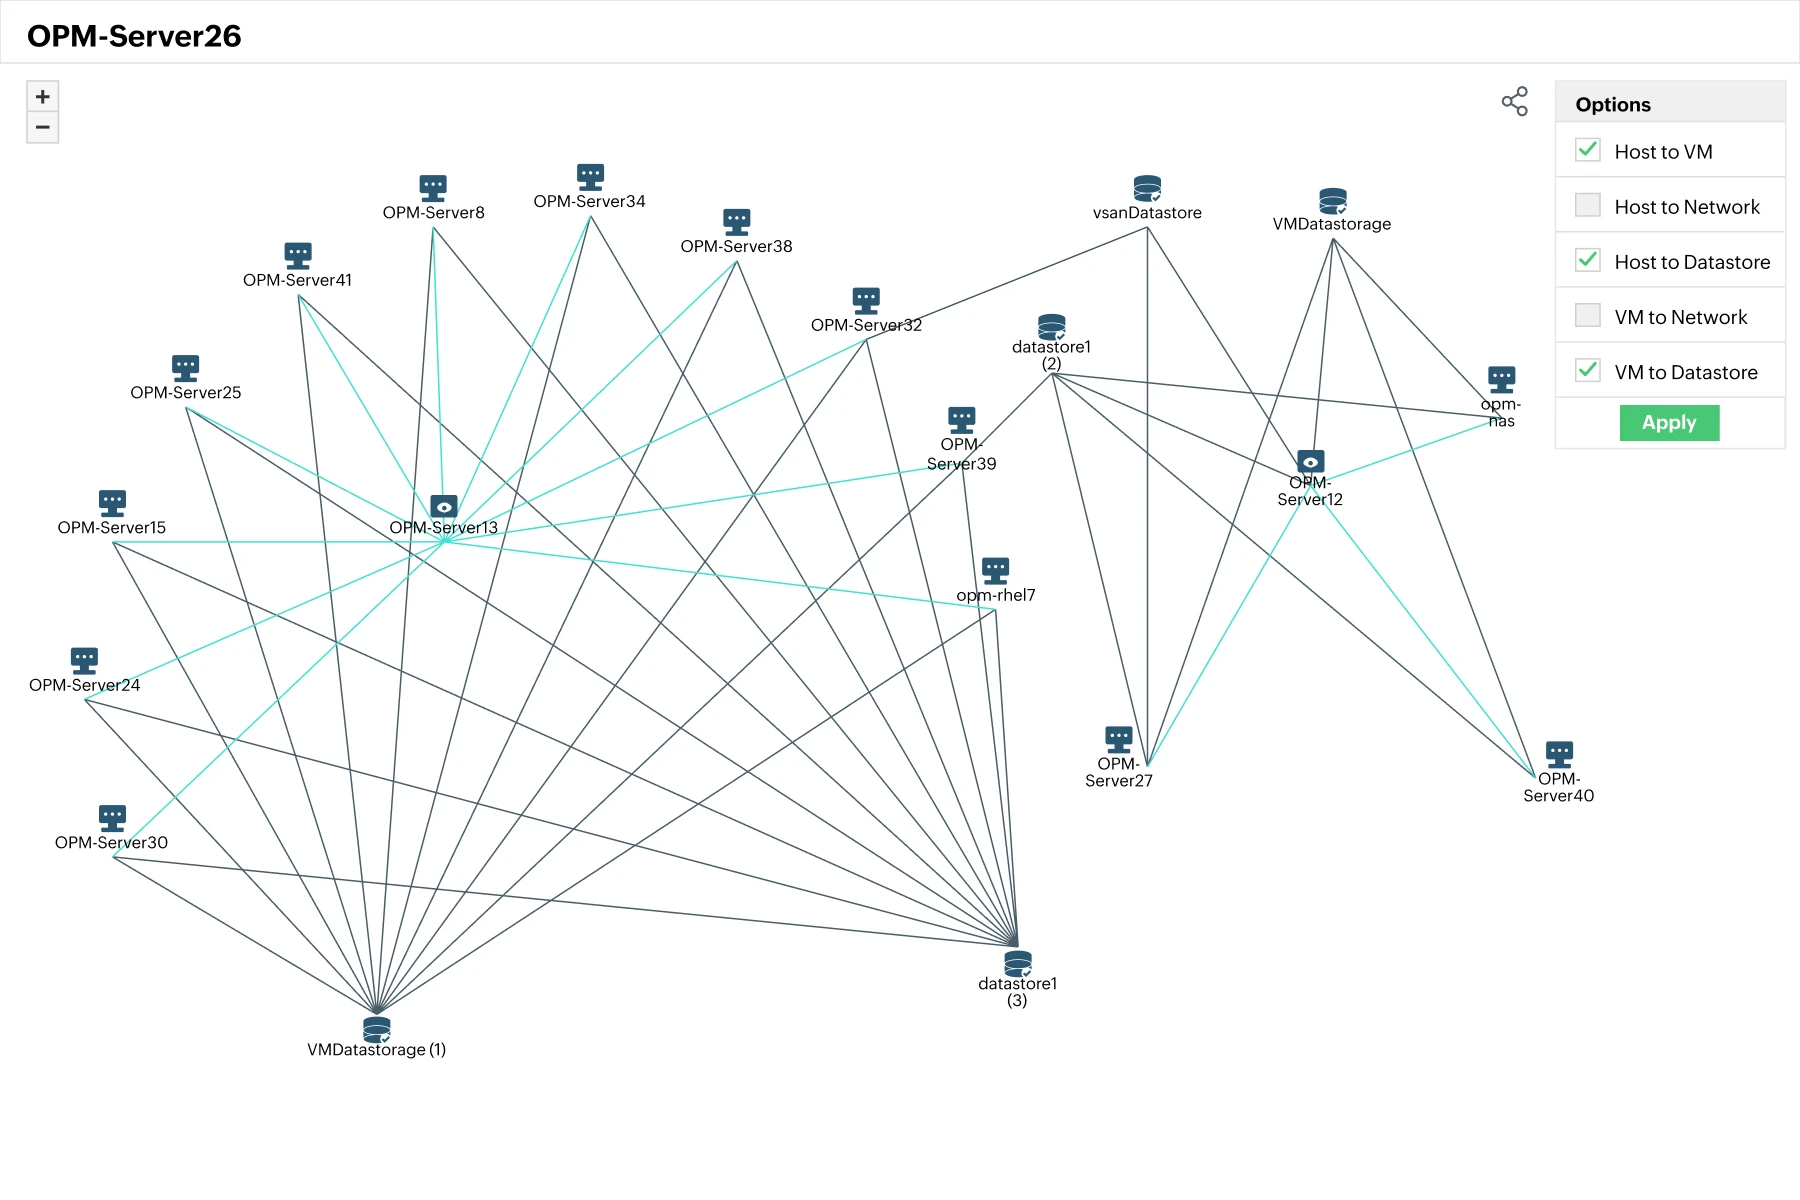
Visualize virtual networks with virtual maps
- Automatically map virtual hosts, virtual machines, and virtual datastores for popular vendors like VMware, Hyper-V, Nutanix, and Xen.
- Automatically classify virtual networks based on vendors and devices types.
- Visualized host to VM, host to host, host to datastore, and virtual network links.
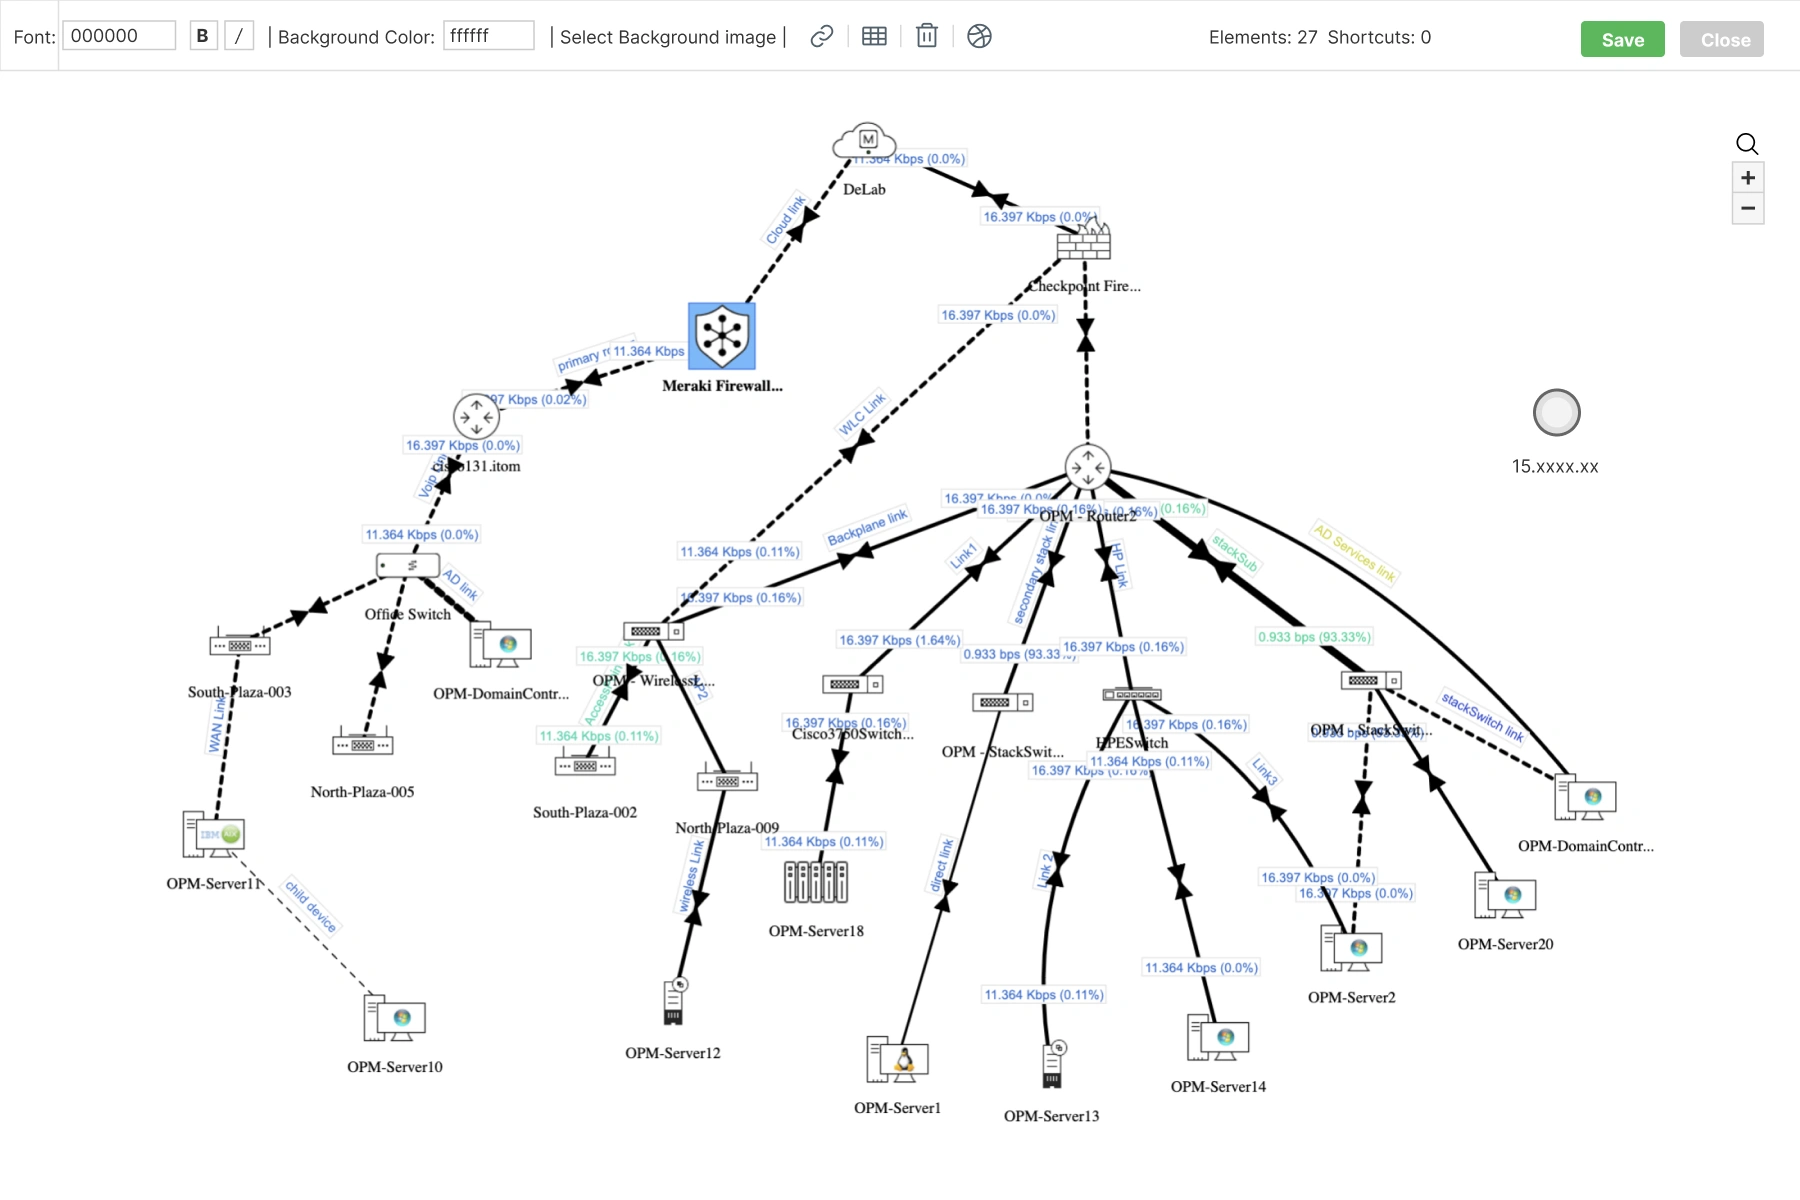
Create custom network maps with business views
- OpManager's business views are a custom mapping feature that allows you to drag and drop network elements into a customizable background image.
- You can add critical network nodes into business view maps to track their status at a glance.
- Add business view maps into OpManager's dashboards to monitor critical business services under a single pane of glass.
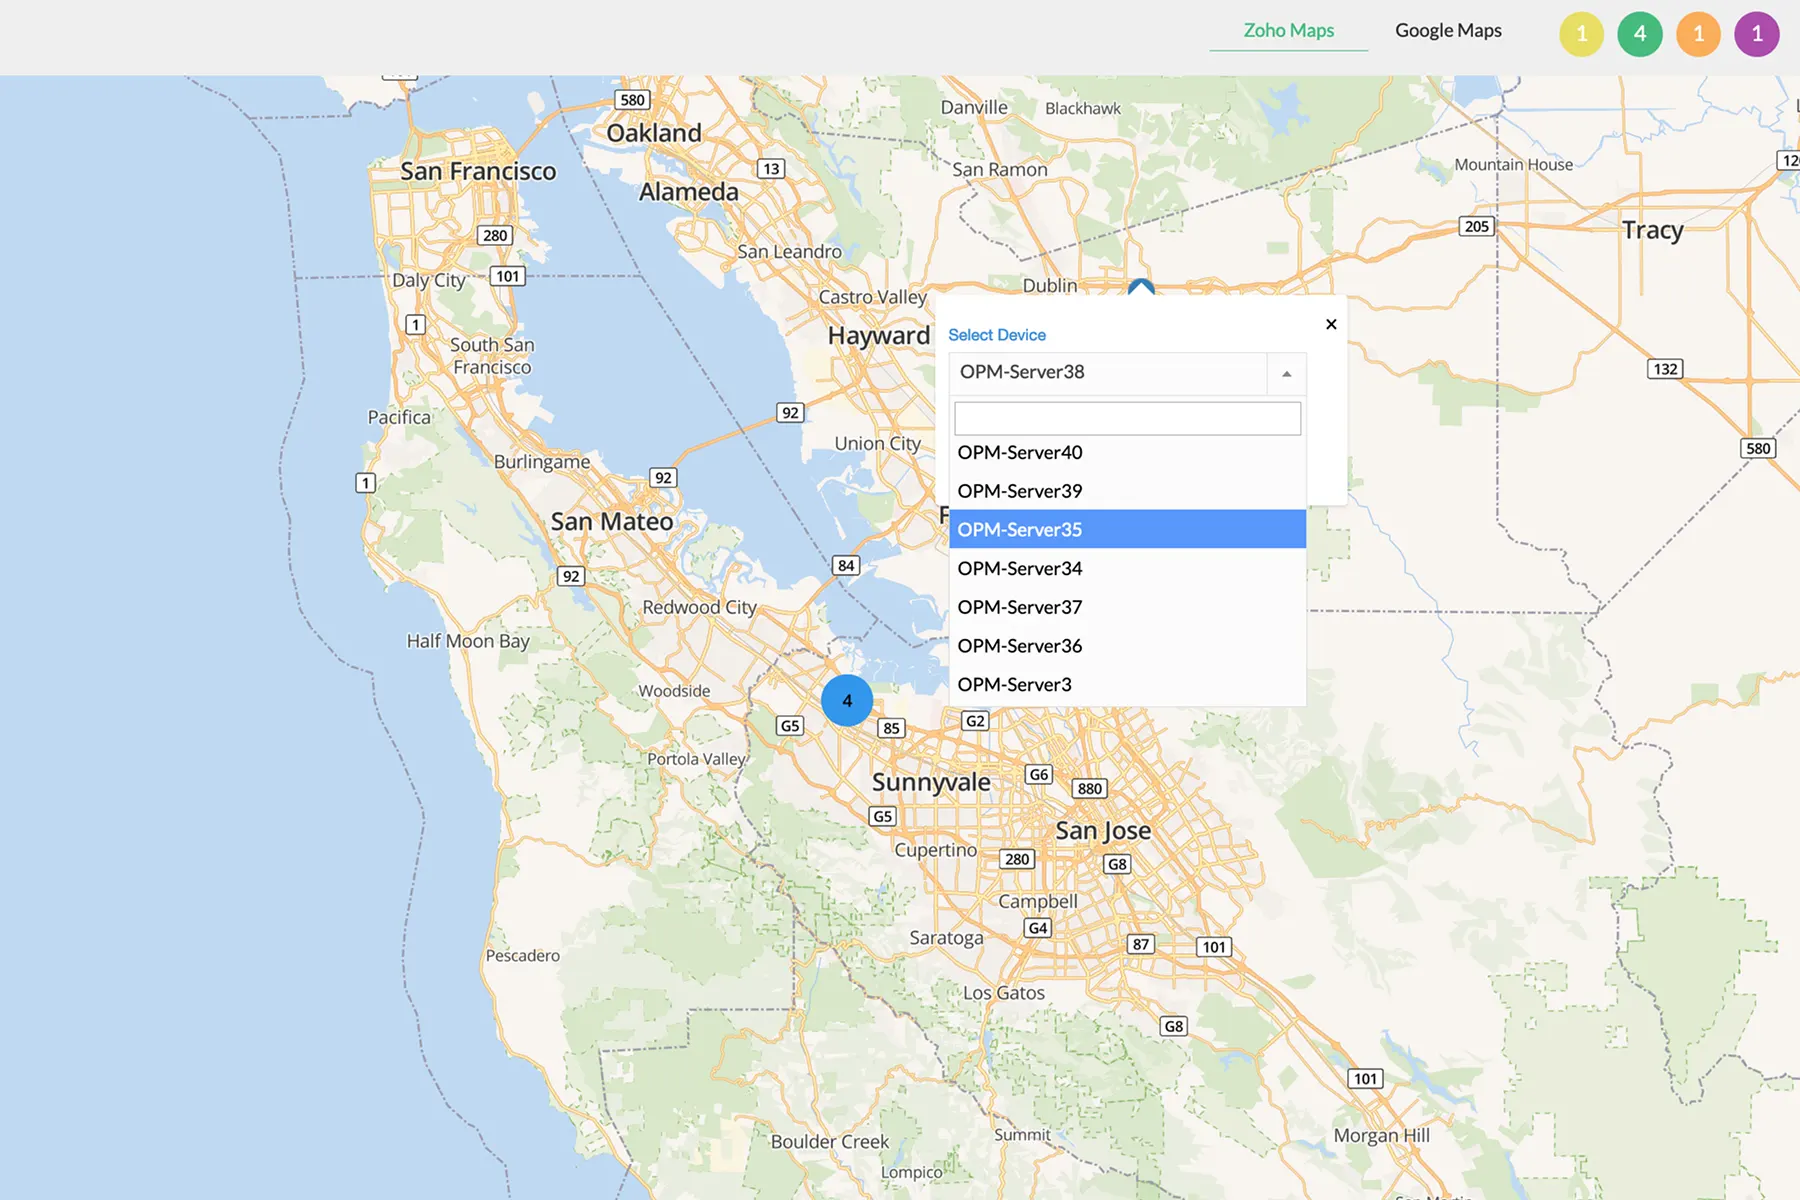
Visualize distributed infrastructure with Google/Zoho maps
- Visualize distributed network infrastructure inside interactive world maps using Google maps or Zoho maps services.
- Add monitored network infrastructure into real-world locations to represent distributed branch offices or datacenters.
- Review device health status at a glance with colour-coded health indicators.
Map datacenters with rack views and floor views
- Create server rack views by dragging and dropping monitored servers into a digital datacenter rack representation.
- Add datacenter racks into a 2D/3D model of a datacenter floor to map out the entire datacenter.
- Review the uptime and performance of datacenter racks and direct remote troubleshooting sessions effortlessly.
Why choose OpManager as your network mapping software?
Scalable network mapping
From small office setups to complex, multi-site enterprise networks, OpManager’s network mapping adapts seamlessly.
Topology-aware fault correlation
OpManager’s network mapping engine correlates alarms with topology data to reduce alarm storms.
Faster incident response
With topology-aware alerting and dependency mapping, OpManager helps admins identify the true root cause of outages in seconds,
Auto-discovery and mapping
OpManager reduces effort with network mapping. IT teams save hours of manual documentation work while ensuring network accuracy.
FAQs on network mapping
Resources to dig deeper
The technical playbook for deploying agentic AI in production ITOps
From alerts to action: How agentic AI will change your ITOps
Download Whitepaper→