


|
The left navigation pane provides quick links to different tasks and reports in Firewall Analyzer Distributed Edition - Admin server. The components present in the left navigation pane depend on the tab that is currently selected.
The following is a list of all components found in the left navigation pane:
| Component | Description |
|---|---|
| Dashboard Views | List all the custom dashboard views created by the user. 'All Devices' view is the default dashboard view. |
| Global Calendar | Allows you to select the time period for all reports from one place. By default, the current day's data from 00:00 Hrs to the current time is shown. |
| Firewalls | Includes links to generate reports for each firewall from which logs have been collected. Click on the Click on the |
| Squid Proxy Reports | Includes links to generate reports for each squid proxy server from which logs have been collected. Click on the |
| My Report Profiles | Includes links to view custom reports created in corresponding Collector server. |
| Bookmarks | Allows you to set a bookmark for the current page, and manage existing bookmarks |
Most of the tasks in the left navigation pane can be done from the main tabs also, by clicking the corresponding links. The left navigation pane provides a quicker way to perform the same tasks.
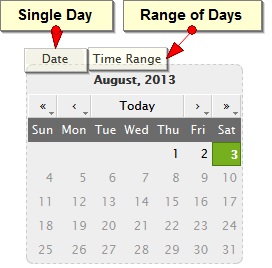
You can use the calendar to select a single date or range of days to view various details of the reports, alerts, and logs of the Firewalls. There are two tabs provided on top left corner of the calendar to select a single day or range of days. Refer the screen shot given below:
|
 icon against each firewall to view reports for that firewall alone in a new window.
 icon against each firewall to obtain