Map layering
Analytics Plus allows you to stack multiple data layers on a single geo map, with each layer representing different KPIs. With this feature, you can easily compare and contrast different data points within the same geographic context in a single report, eliminating the need to toggle between multiple reports.
Advantages of map layering
- Enhanced Visualization: It enables the simultaneous display of multiple data sets, providing a richer and more detailed visual representation.
- Contextual Understanding: It helps in understanding the relationship between different data points, revealing patterns and correlations that might not be evident in isolation.
- Interactive Exploration: It allows you to zoom, pan, and click on layers for detailed information, allowing drill-down analysis.
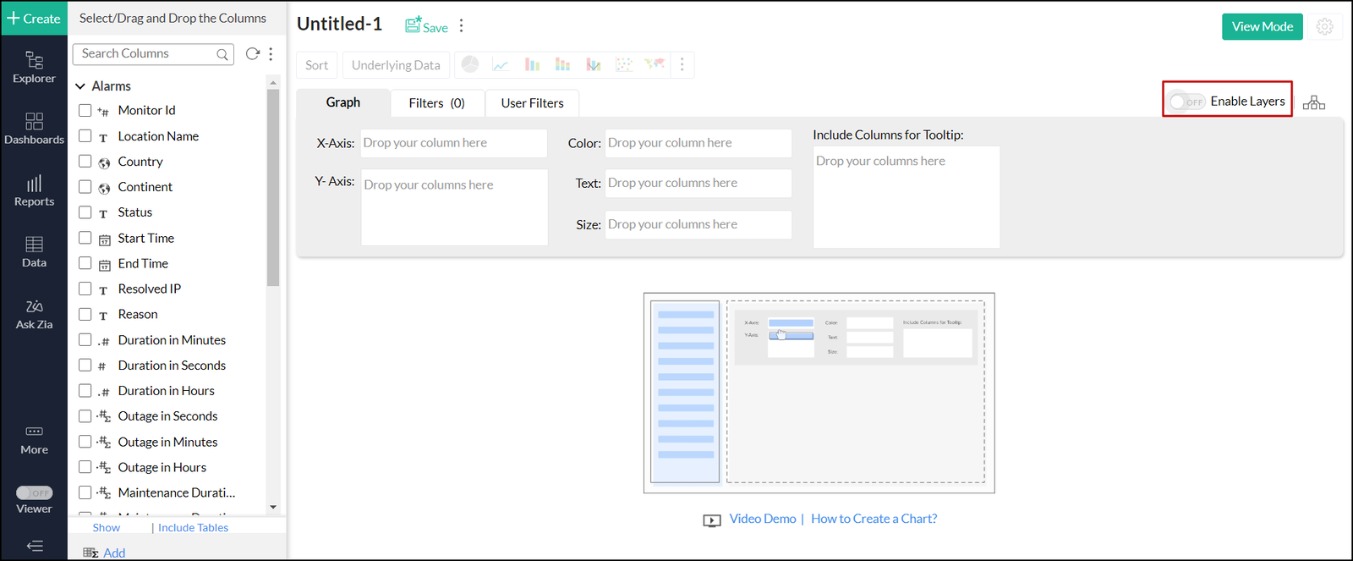
Enable layers
You need to enable the layering feature to visualize multiple layers of data on a single geo map. To enable map layers, follow the steps below:
- Open the required report or create a new report by clicking +Create at the top left corner, then choose Chart View from the drop-down menu.
- In the window that appears, enable the Enable Layers toggle button at the top right corner of the report builder.
Note:
- The layering feature is specifically designed for Geo Map charts.
- Attempting to layer different chart types other than a geo map is not supported.
- You can add up to five layers to the same geo map for comprehensive data visualization.
Creating map layers
Creating map layers is similar to creating a geo map, with the key difference being that creating multiple geo maps as separate layers within the same designer page. For detailed steps, please refer to the presentation below.
Customizing map layers
You can customize the map layers in both the chart's Edit Design and View modes. The following are the available options:
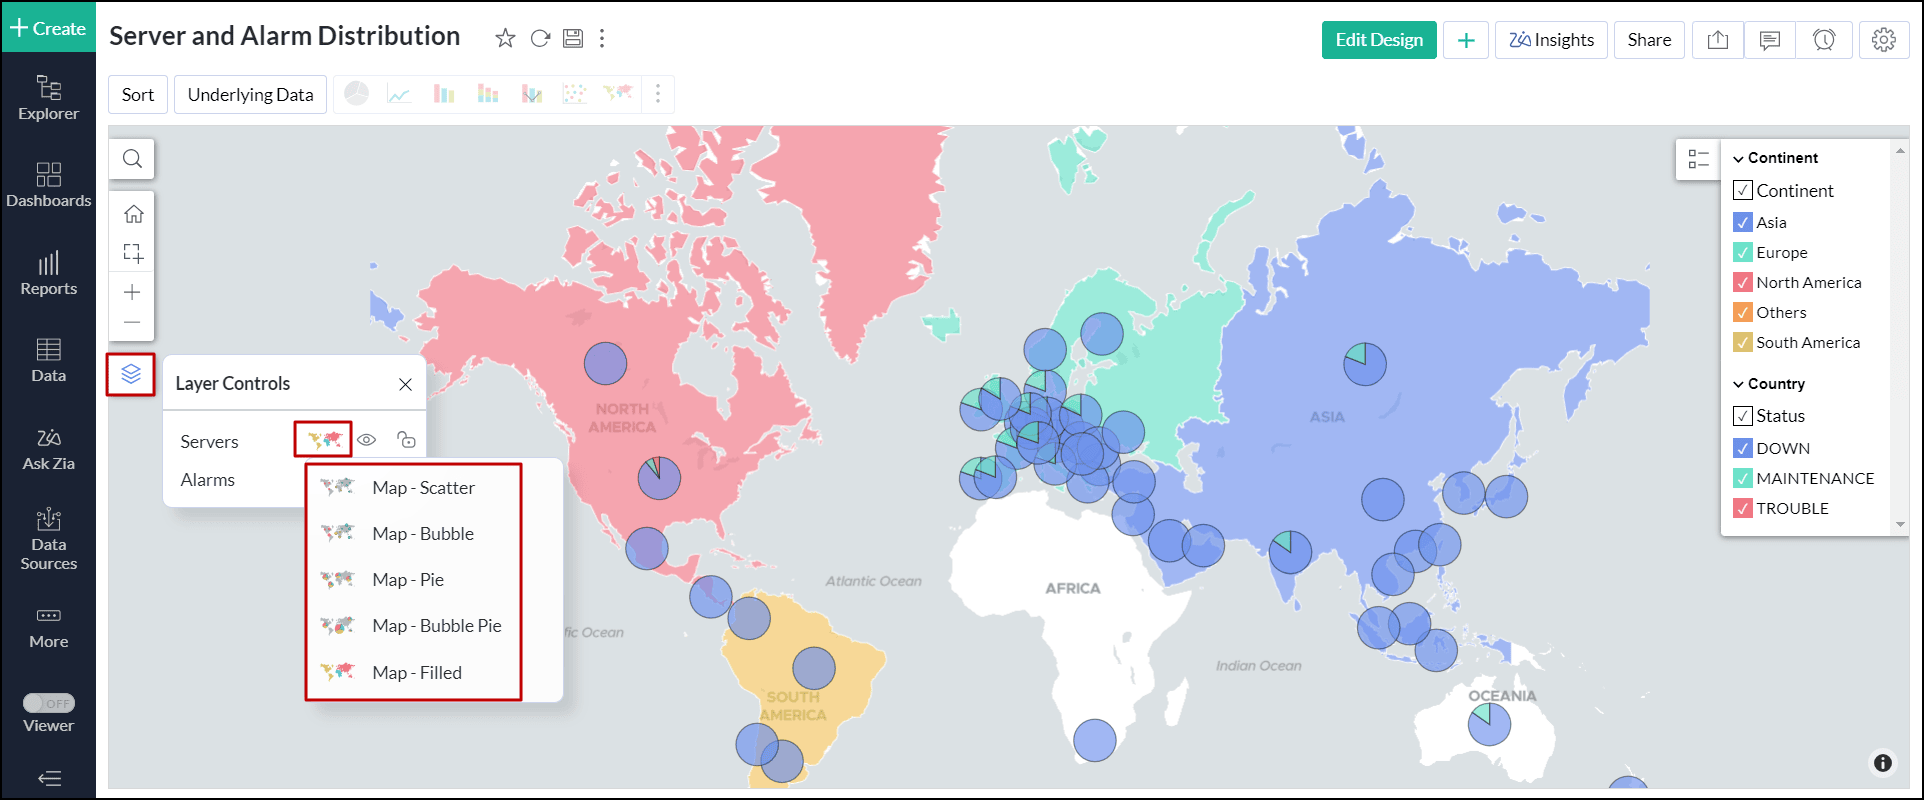
Changing the chart type
Analytics Plus lets you change the chart type of each layer individually, enabling better analysis and deeper insights into each layer. To change the chart type, follow the steps below:
- Click the Layer Controls icon on the left side panel of the map.
- Click the Chart Chooser icon, and select the desired chart type.
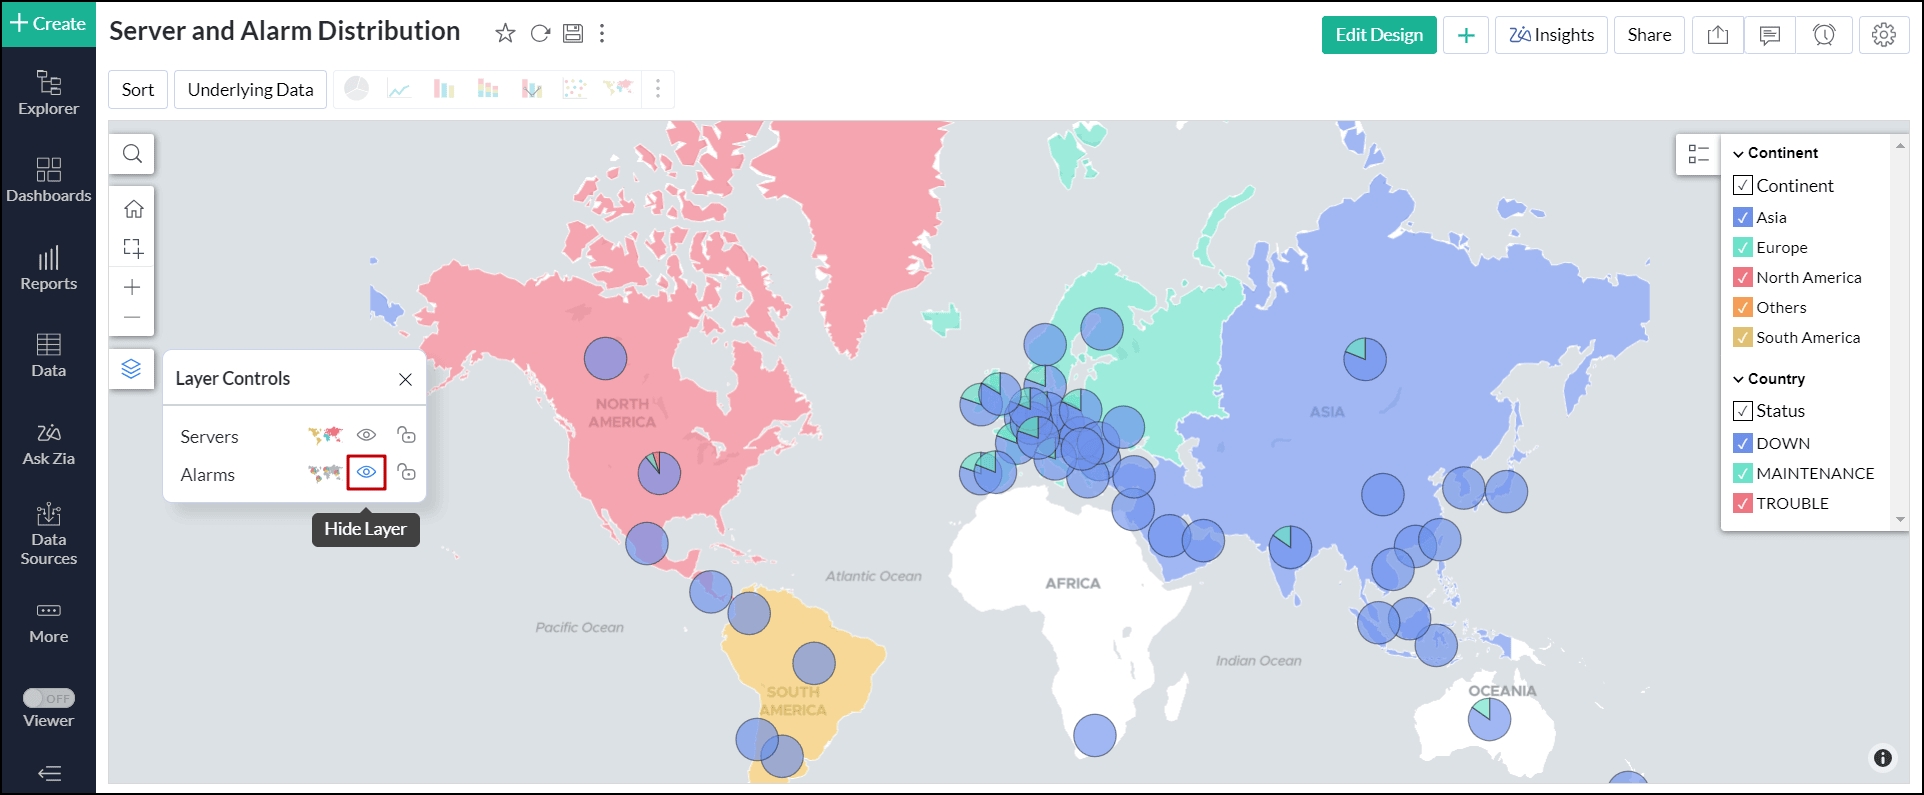
Hide the map layer
To hide a layer in map layering, follow these steps:
- Click the Layer Controls icon on the left side panel of the map.
- Click the Hide Layer icon corresponding to the layer you need to hide. The hidden layer will no longer appear on the geo map.
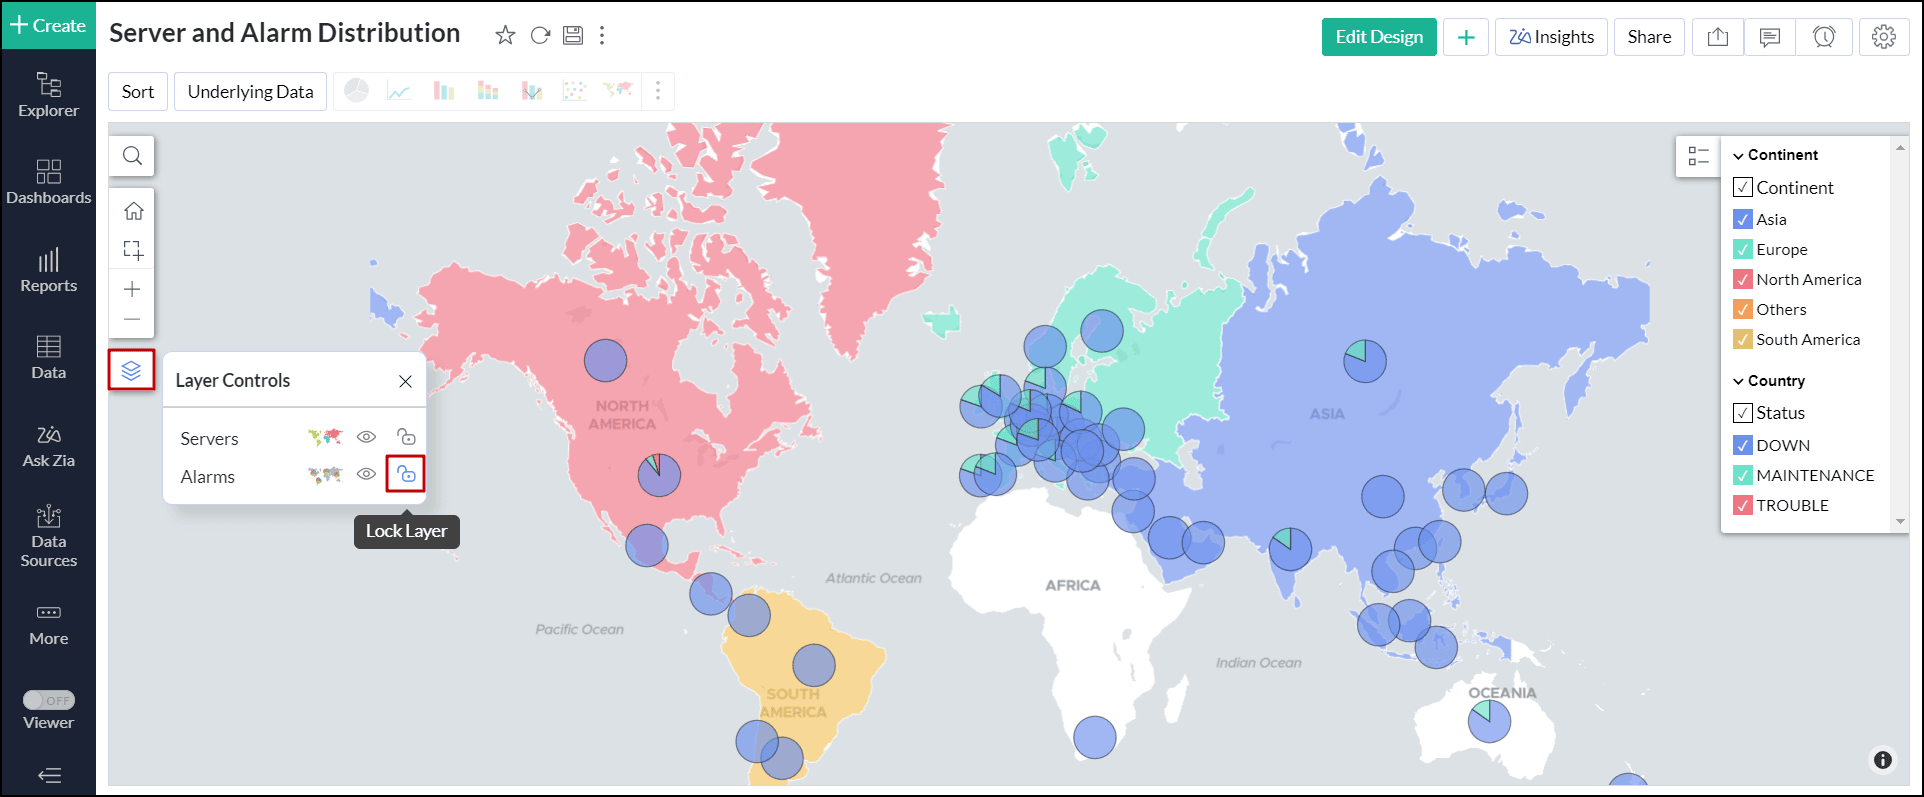
Lock the layer
The lock layer feature enables you to freeze certain layers from further customization when they are viewed by users in the View Mode. To lock a layer, follow the steps below:
- Click the Layer Controls icon on the left side panel of the map.
- Click the Lock Layer icon corresponding to the layer you wish to lock. A locked layer remains visible on the map but prevents interaction with its data values.