- HOME
- ITSM Analytics
- 4 critical help desk metrics and why you need them—Part 1
4 critical help desk metrics and why you need them—Part 1
- Last Updated: July 1, 2024
- 632 Views
- 3 Min Read

In IT, what gets measured gets improved. This statement especially rings true for an IT service desk, which is fueled by a multitude of metrics. However, with so many metrics and KPIs that can be tracked and so little time to meticulously track them all, how do you prioritize the ones that matter?
This blog series will walk you through four critical help desk metrics and establish why they're the need of the hour for any IT help desk.
1. Burn rate
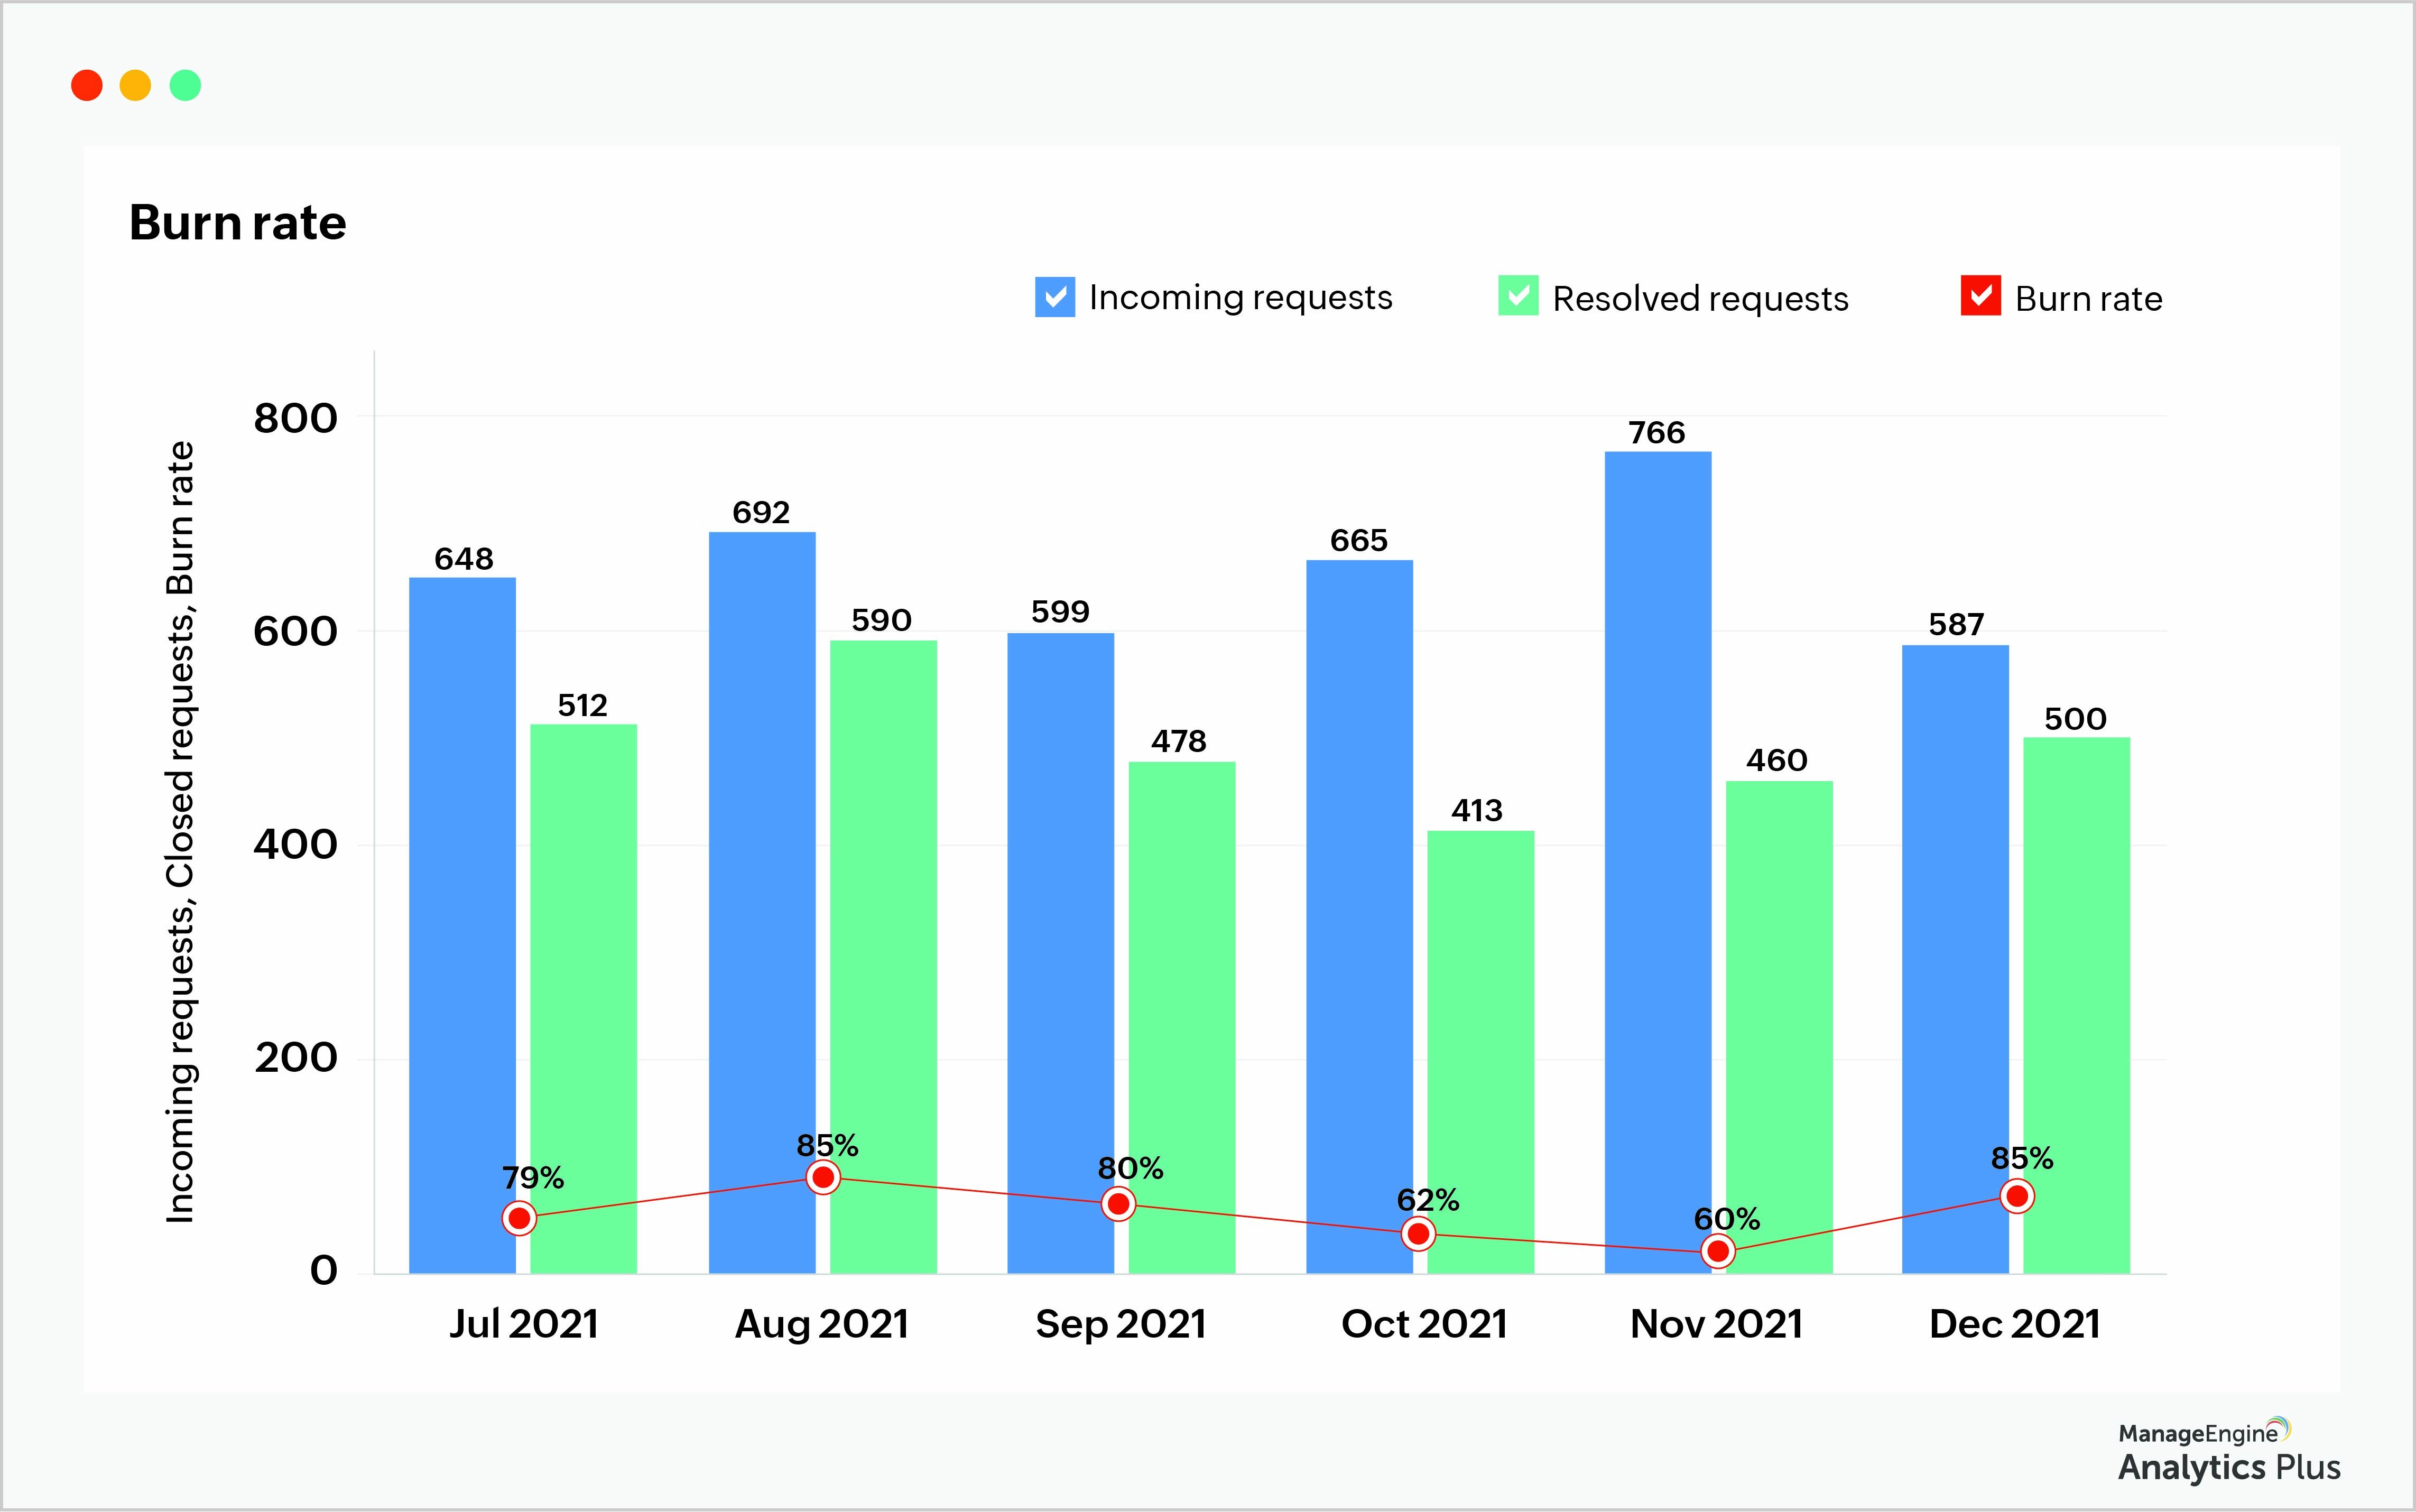
Is incident management truly comprehensive without measuring burn rate? One of the most important metrics in any help desk, burn rate is the percentage of closed incidents compared to the total number of incoming incidents. This metric can be a key performance indicator in your incident management process, and it provides crucial insight into how fast your help desk resolves incoming incidents.
What is an IT help desk's primary goal? Beyond ensuring end-user satisfaction and monitoring SLA breaches, fast incident resolutions are the cornerstone of any help desk. Ensuring incoming requests are tackled quickly and accurately is a surefire sign of a well-oiled service team.

Let's break down the insights you can gain from this metric. A burn rate of around 50% implies that your technicians resolved only half of any created incidents. You can rework existing processes to boost resolutions or hire additional employees to share the load. A healthy burn rate of above 80% shows that your technicians can resolve most requests within the same month, and it's a good indicator of a well-performing IT help desk.
Beyond understanding and tracking the overall performance of your help desk, you can also leverage this metric to decipher your staffing needs. While there are no established standards to identify the precise number of staff needed for a help desk, a consistently low burn rate percentage tells you that you need more hands on deck.
Reducing ticket idle time, configuring proper technician assignment workflows, and ensuring technicians aren't overloaded all go a long way in improving your help desk burn rate.
2. Technician workload
The primary focus of help desks is to resolve all incoming requests accurately, and the key players in request resolutions are help desk technicians. Therefore, technician performance, incident resolution, and, in turn, customer satisfaction all go hand in hand. If technicians are buried under a constant deluge of tasks and requests, their productivity and the overall resolution time will be affected. In such scenarios, help desk managers need to look into the technician workload distribution to reassign requests and, in certain cases, employ more technicians.
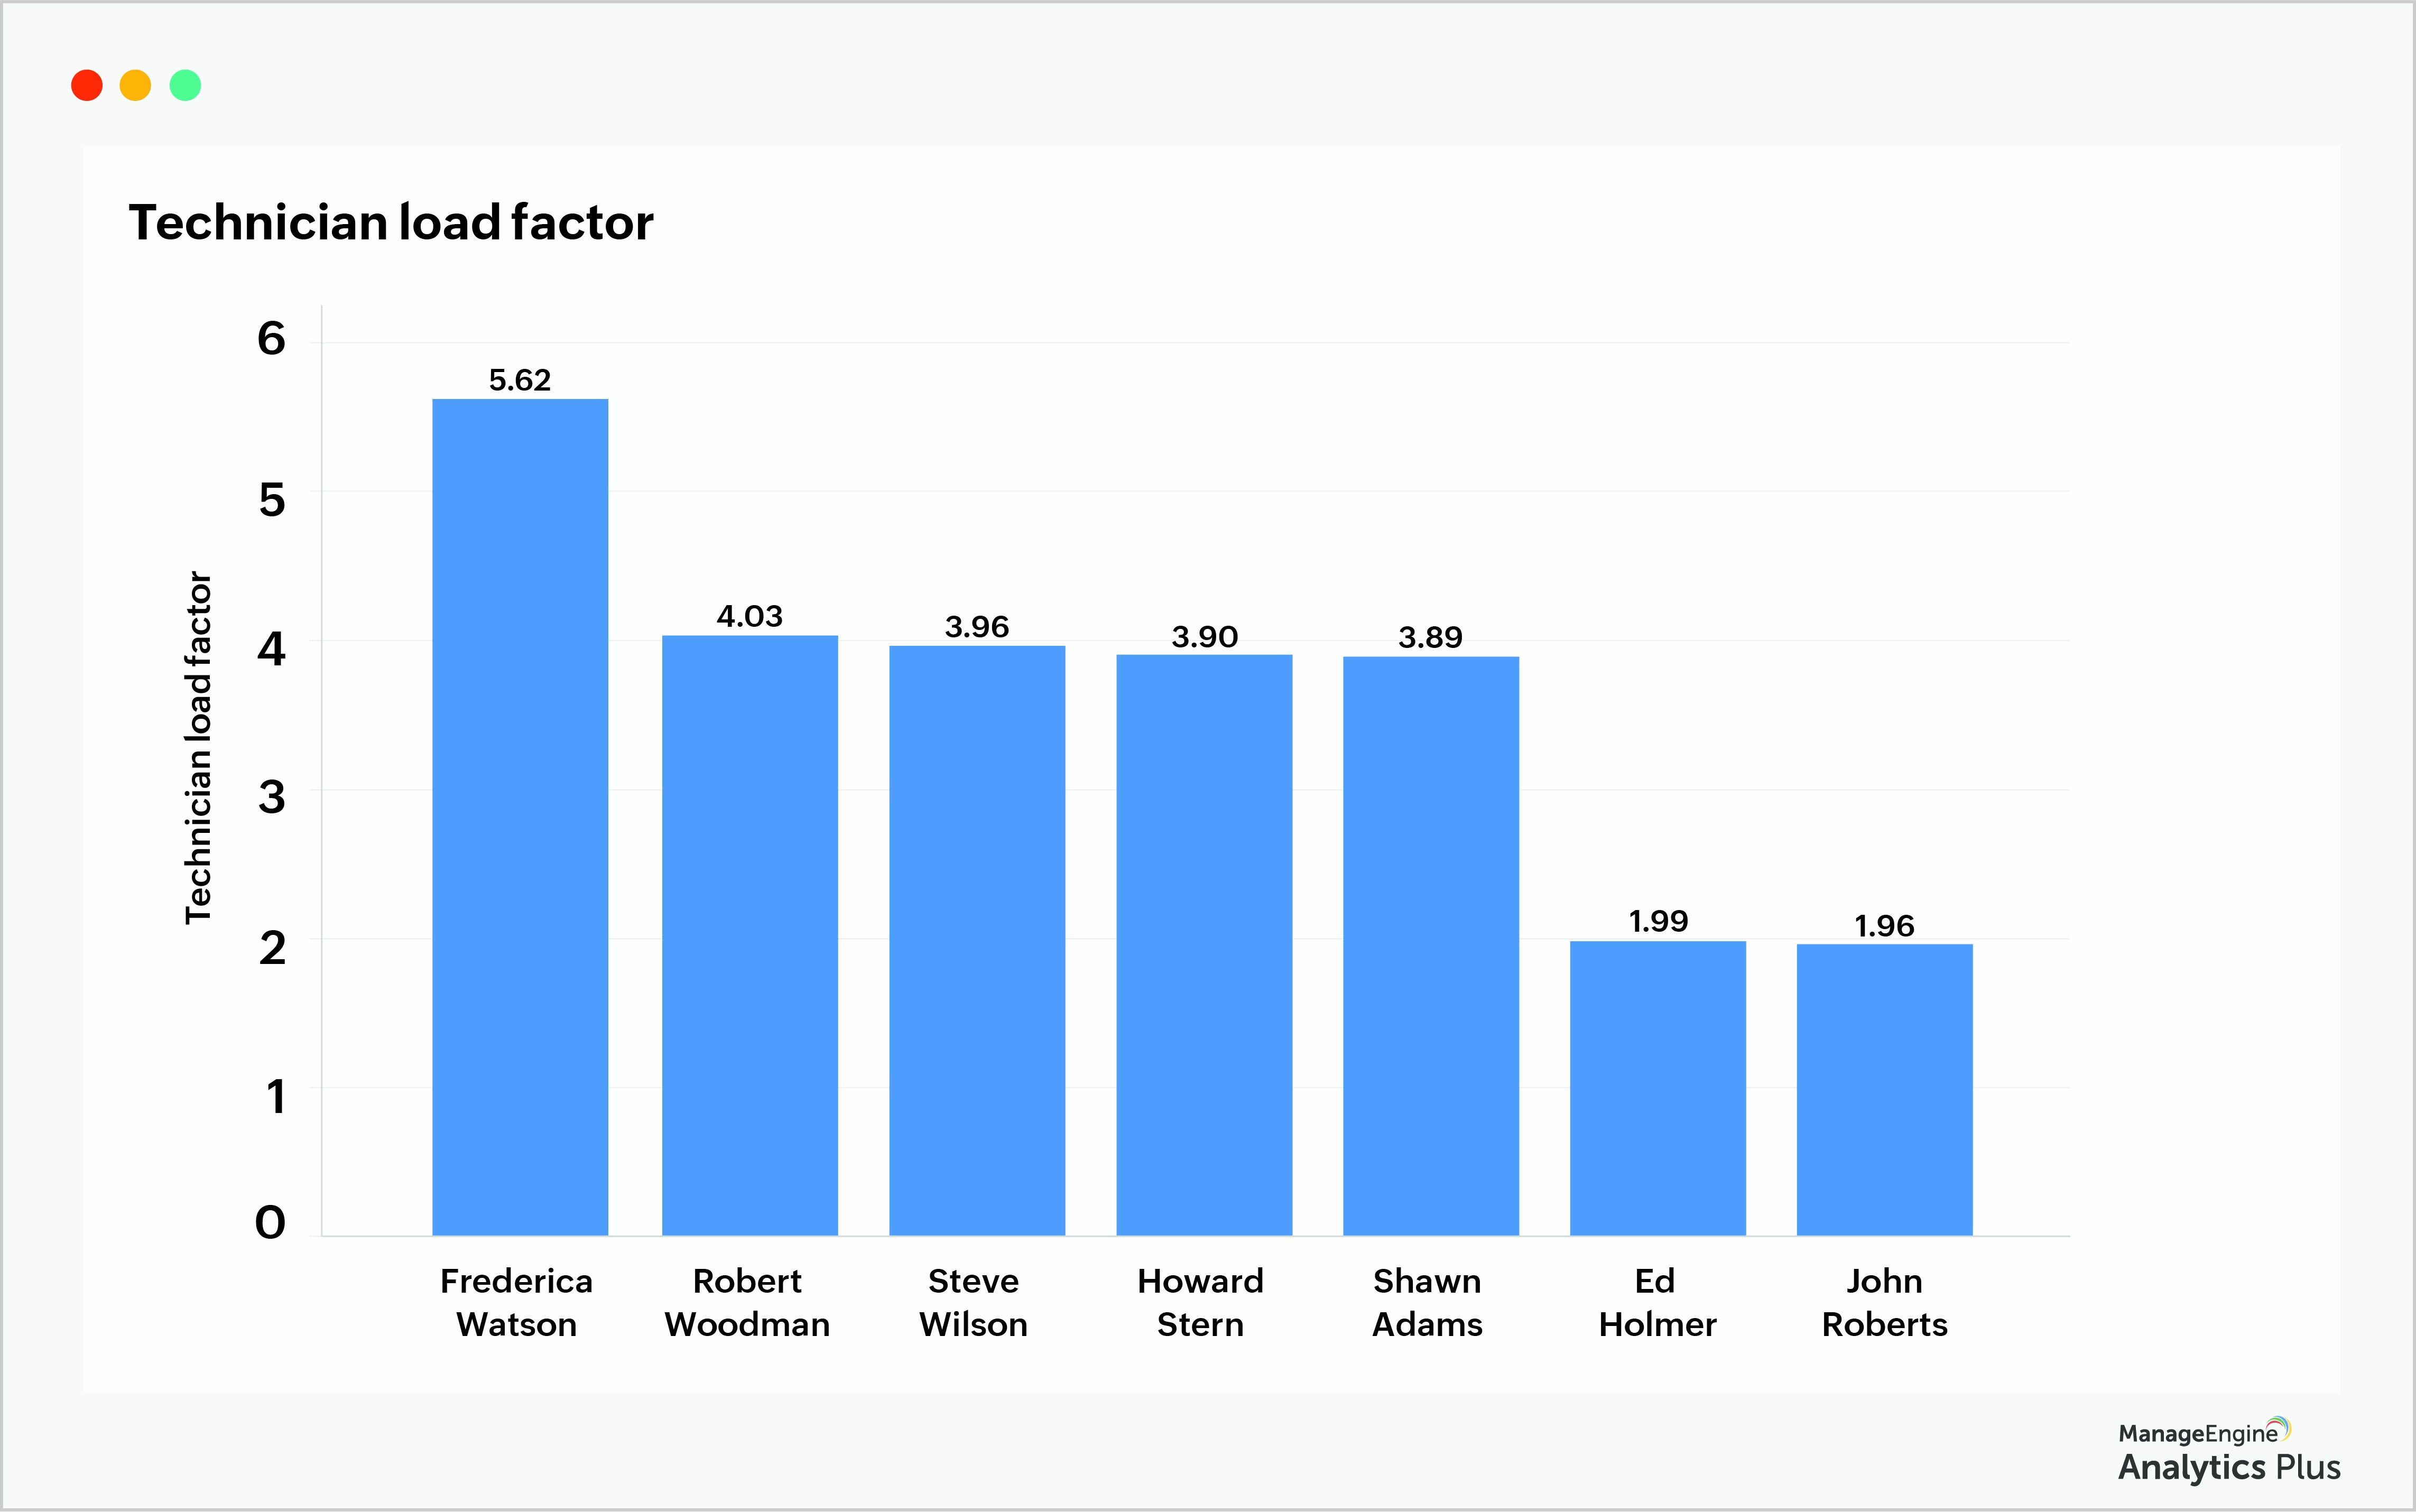
To manage workload distribution effectively, you need a clear picture of each technician's individual workload. This can be accomplished by tracking the technician load factor, which is calculated by dividing the number of requests assigned to a technician by the average amount of time available to resolve those requests.

You can choose to reassign some requests to ensure an evenly balanced workload, which will improve overall performance. You can also provide targeted training and create detailed documentation to help technicians enrich their skill set and tackle incoming requests easily. Despite these efforts, if improvements in overall performance are somewhat insignificant, it's a good indicator that additional technicians need to be hired to help tackle the increasing workload.
Stay tuned for the second part of this blog series, where we'll cover the remaining two help desk metrics and resolve some of your help desk's biggest challenges.
The images used above showcase some of the reports available in Analytics Plus, ManageEngine's IT analytics solution. It offers out-of-the-box integrations with several popular IT applications such as ServiceNow, Jira Software, Zendesk, and ManageEngine's suite of products. If you'd like to create similar reports using your IT data, try Analytics Plus for free.
Ready to learn more about analytics for IT operations? Talk to our experts to discover all the ways you can benefit from deploying analytics in your IT.


