- HOME
- ITSM Analytics
- 3 crucial benefits of user surveys you're missing out on
3 crucial benefits of user surveys you're missing out on
- Last Updated: July 1, 2024
- 410 Views
- 4 Min Read

Everybody wants to hear from their end users, but not many have the time and resources to truly decipher what they're saying.
Though organizations meticulously configure feedback surveys, they tend to drop the ball when it comes to analyzing and addressing their end users' responses. After all, how do you sort through every user's response and draw insights when you have a boatload waiting for you? With a large customer base, tracking and staying on top of user feedback and satisfaction while leveraging insights towards business improvement quickly becomes cumbersome and tiring.
However, there's an easy way out of this predicament. With a smart analytics platform, not only can you draw insights from user feedback but you can also take your analysis a step further by wielding these insights to improve business operations continuously and establish sustained business growth.
Here are three ways advanced analytics act as the driving force in deciphering user surveys and improving overall business processes.
1. Boost user satisfaction
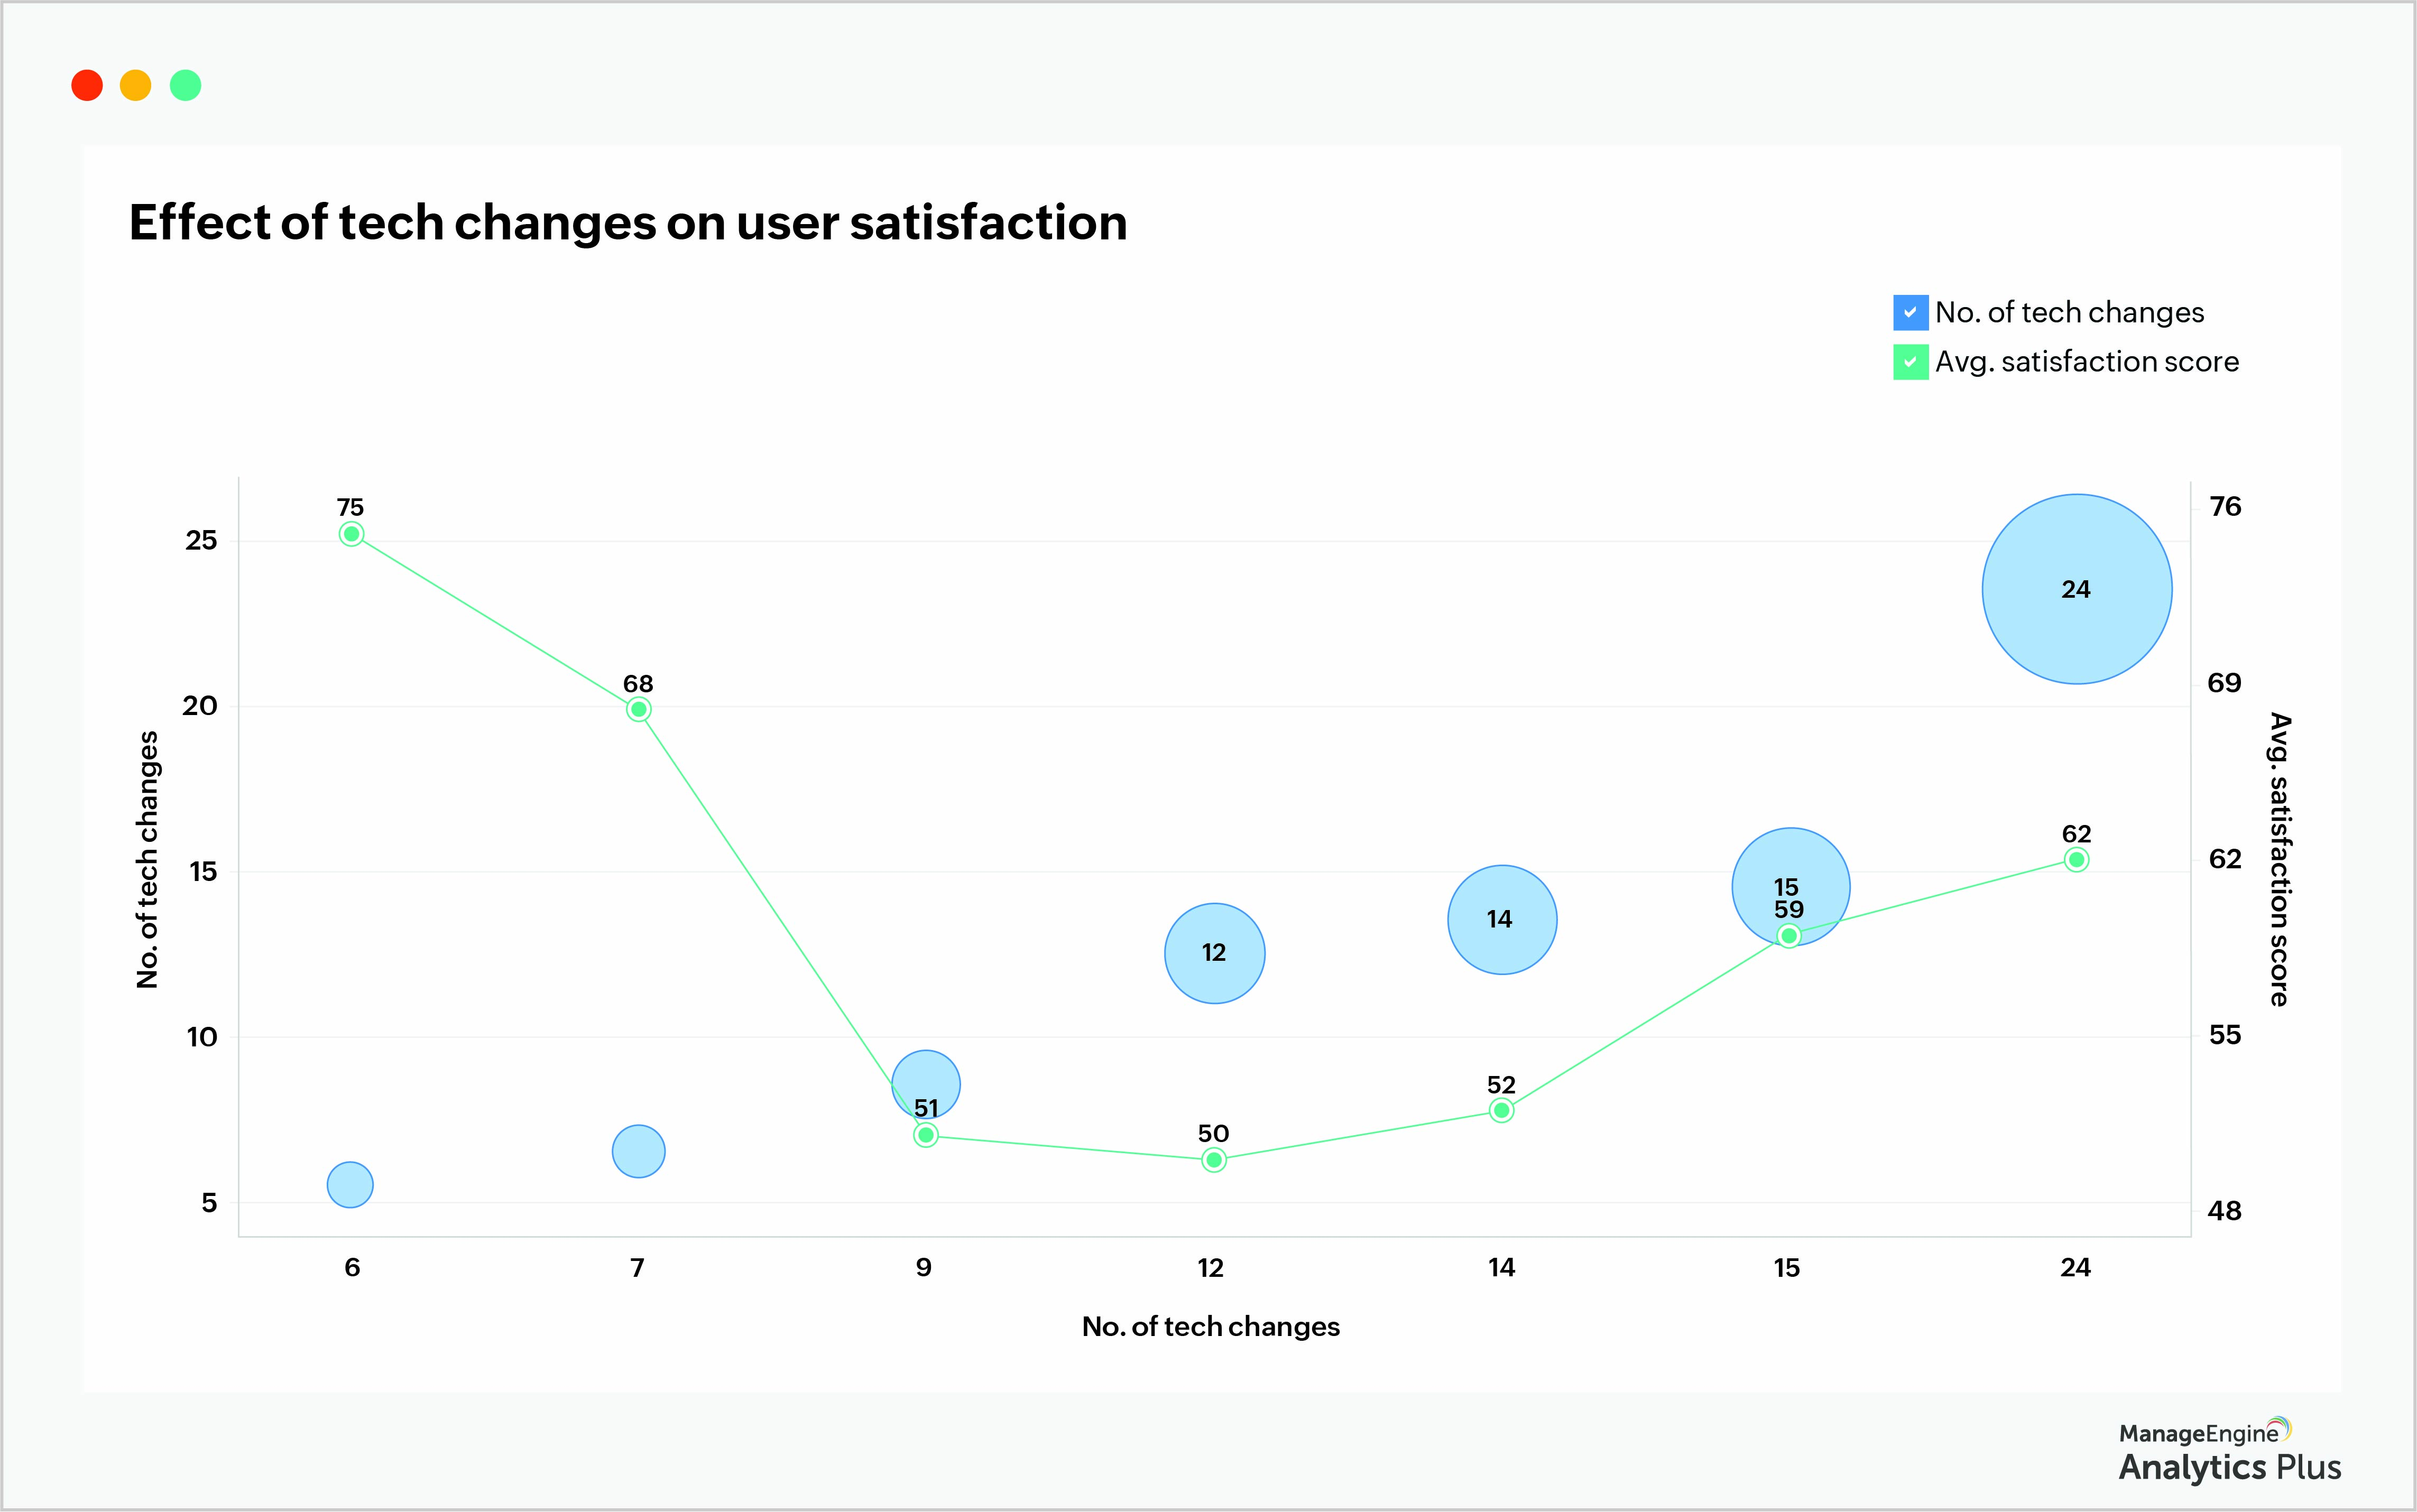
For an end user looking to resolve an issue, nothing can irk them more than spending hours explaining their problem in depth to a technician, only to have their ticket transferred to another technician, forcing them to start from scratch all over again. While some technician escalations and changes are warranted, for a user looking for a speedy resolution, it can prove very tiresome and affect their overall productivity.

The report above helps managers understand the degree to which technician changes impact end-user satisfaction by establishing a visible correlation between the two metrics. More technician transfers equals less satisfied customers. A high number of technician transfers could point to several possible issues, such as incorrect ticket assignment, lack of adequate training, or lack of sufficient resources to resolve the ticket. Reworking your automated ticket assignment system, providing real-time or periodic training to technicians, and ensuring relevant tools and resources are available will allow you to tackle these problems with your help desk.
2. Identify technicians' Achilles' heels
Beyond the tools and processes in place, help desk technicians are the true backbone of a help desk. It therefore goes without saying that by strengthening your technicians' weaker operations, you improve the efficiency of your overall processes.

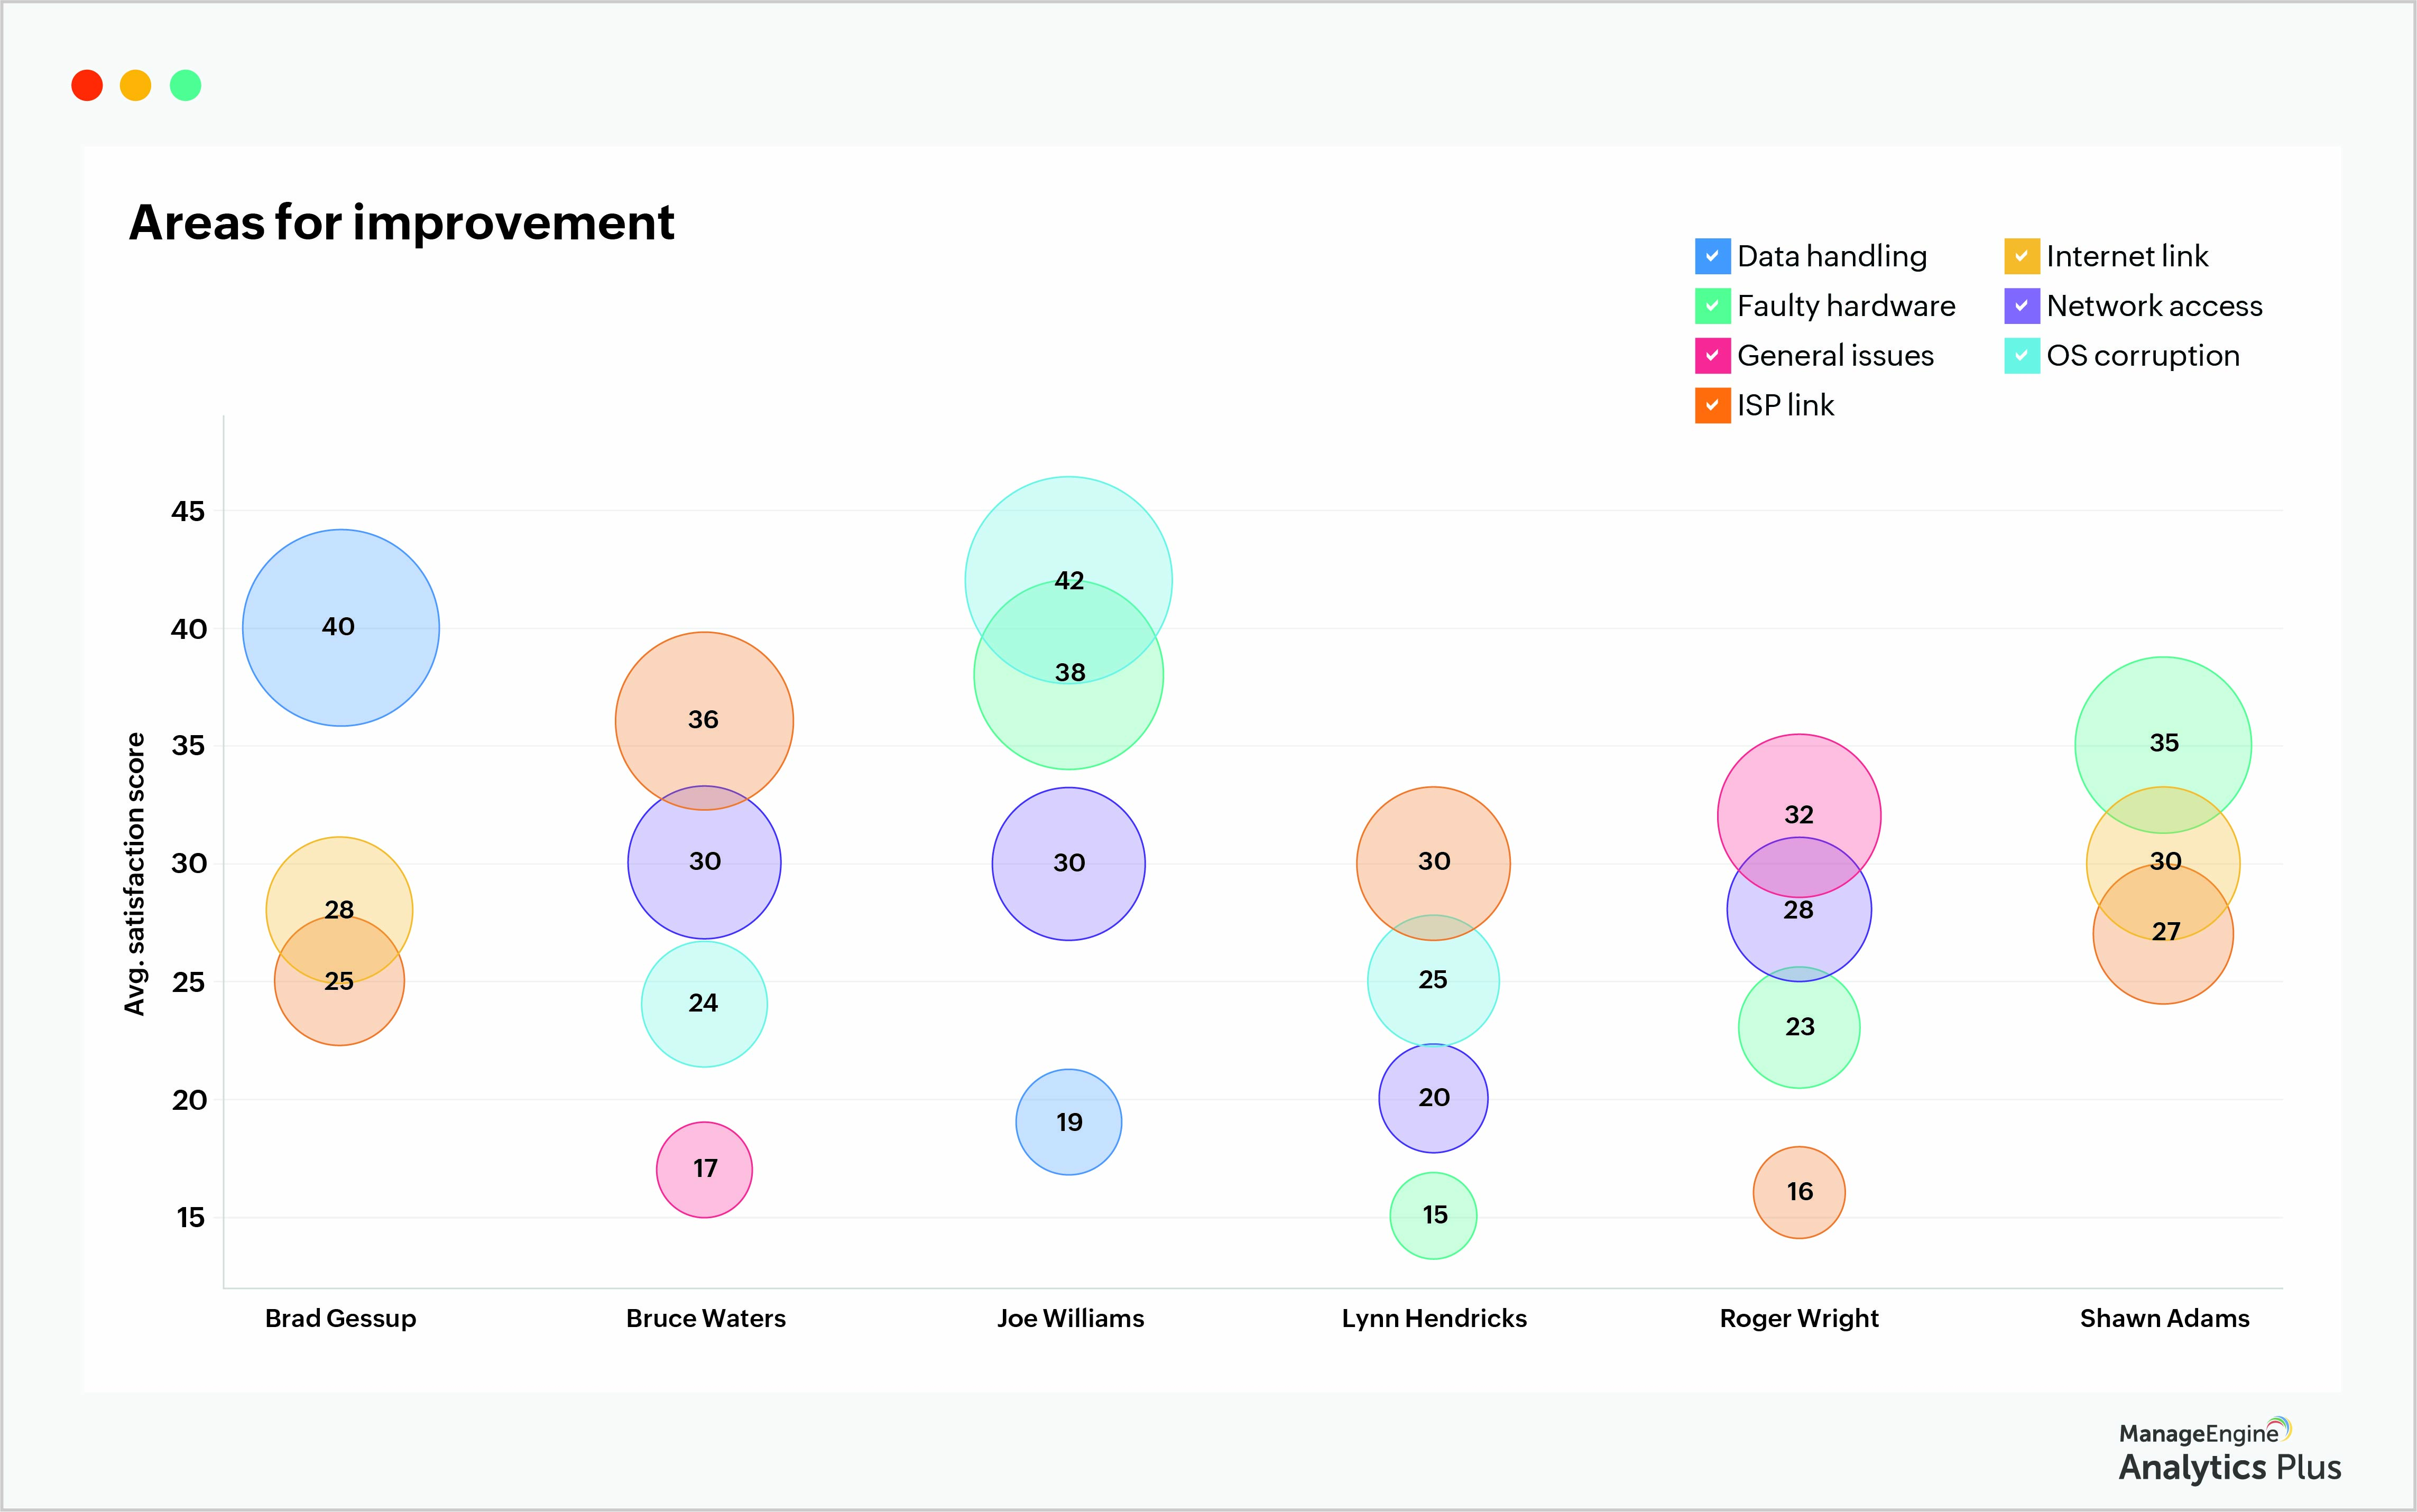
The report above collates user feedback across the help desk to pinpoint the various operations where help desk technicians obtained their lowest 10% of user satisfaction scores. The size of the bubbles signifies the number of requests handled by each technician in each category, and the position of the bubbles represents the average satisfaction score in that respective category. Lower positions signify lower satisfaction scores.
For instance, you can see that while Lynn Hendricks has performed poorly across four areas, he's handled requests regarding ISP links better than those regarding faulty hardware. A good rule of thumb would be to focus on each technician's weakest area, which is represented by their lowest bubble, then work your way up.
Managers can sit down with their technicians to understand the impediments they face with those operations, be it a lack of training or insufficient time and tools. By addressing technicians' concerns over their pain points and providing additional training materials when required, you encourage a culture of self-improvement and, in turn, advance in the march towards sustained business growth.
3. Measure the impact of inefficiencies
We covered the various ways to streamline technician assignments and boost technician proficiency by identifying the operations they struggle with. Now, wouldn't it be wonderful if we could tailor this to the entire help desk and identify the various processes that can be improved?
User satisfaction scores are a key takeaway from your user surveys. By analyzing low satisfaction scores, you can pinpoint where a specific service or process was lackluster and didn't meet end users' needs. These areas act as a great starting point when looking to improve business processes that are performing poorly in an enterprise.

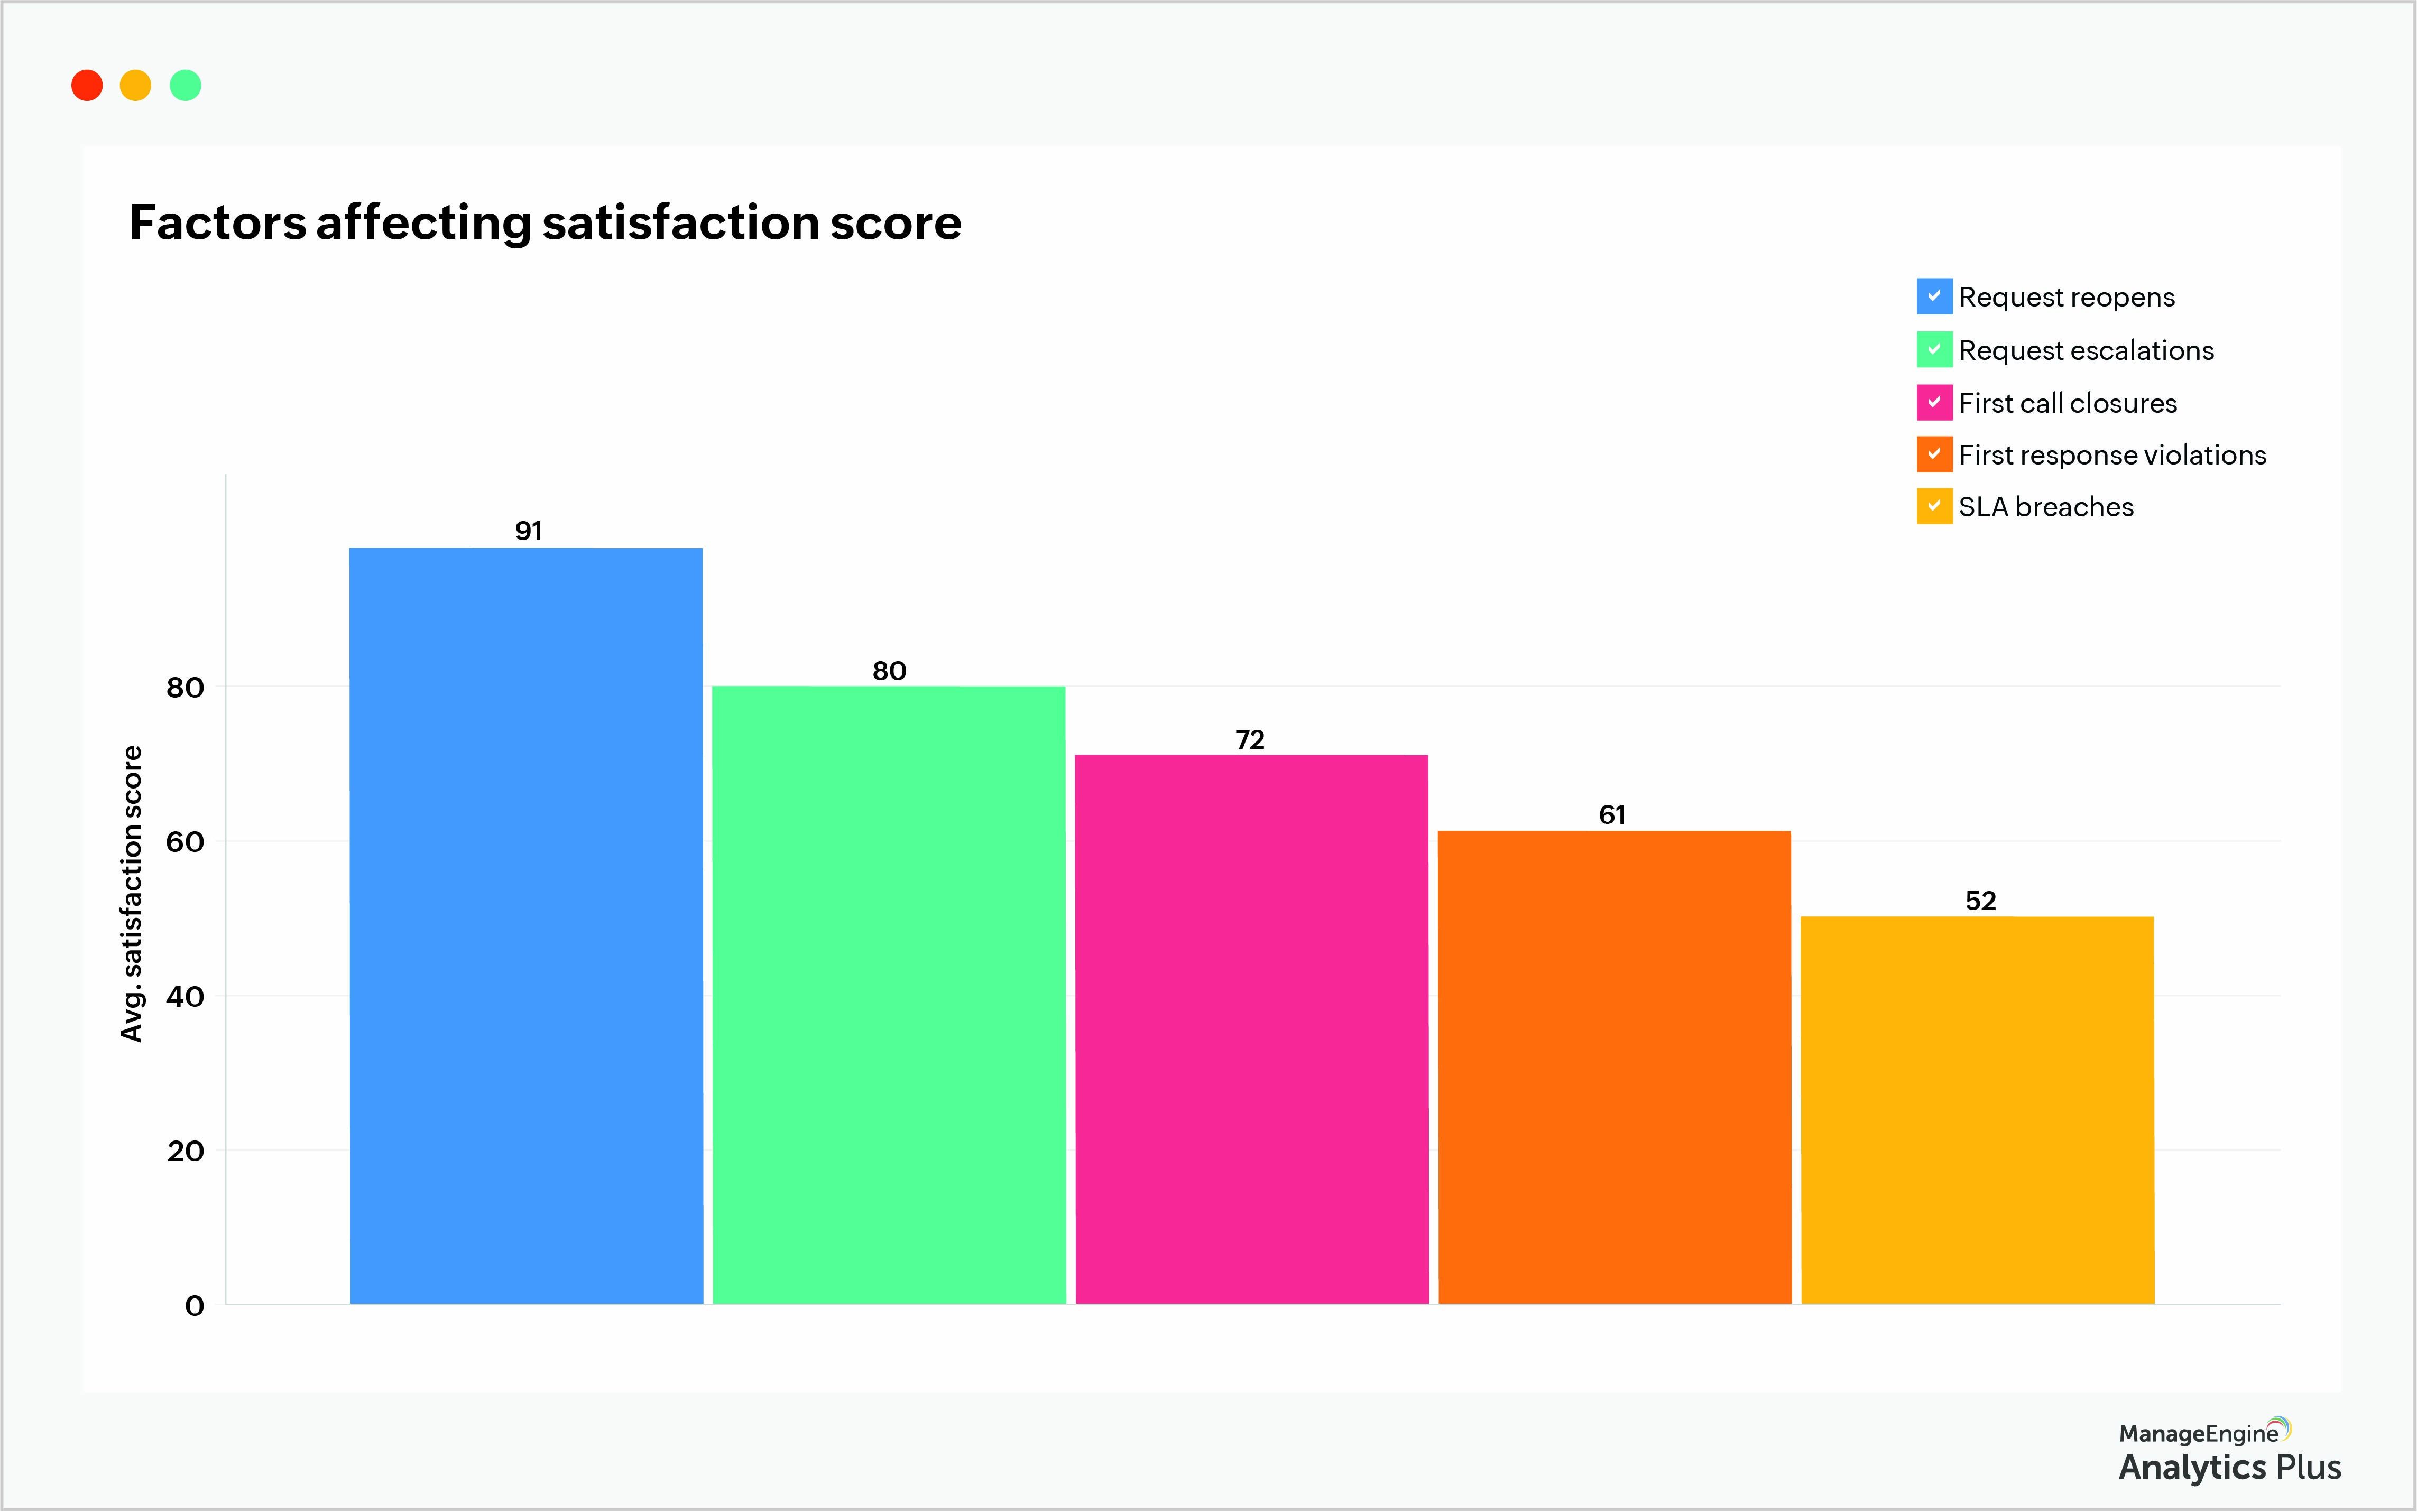
When certain help desk processes receive low satisfaction ratings overall, it implies that several of your end users were unhappy with the support they received in those areas. Looking at the report above, you can infer that SLA breaches have a greater effect on the end-user experience, which is indicated by lower satisfaction scores for requests that violated SLAs.
On the other hand, request reopens have much less of an impact on how end users feel about the way their requests were handled. This tells you that in order to improve the end-user experience, your help desk team should strive for fewer SLA violations before moving on to improving any of the other areas.
Managers can leverage the findings from this report to narrow down the specific elements in the help desk processes that are not well-received, then employ targeted training and tools to ensure end users receive the support they require. A good practice would be to consistently check back on this report to verify if the measures you've taken bore fruit, tweaking your methods as required to refine and upgrade your processes.
These reports were built using Analytics Plus, ManageEngine's IT analytics solution that offers out-of-the-box integrations with several popular IT applications, such as ServiceNow, Jira Software, Zendesk, and ManageEngine's suite of products. If you're looking for an IT analytics solution, try Analytics Plus for free now.
Need to know more about analytics for IT operations? Talk to our experts to discover all the ways you can benefit from deploying analytics in your IT.


