- HOME
- Digital Transformation
- Top field service KPIs & metrics for 2024
Top field service KPIs & metrics for 2024
- Last Updated: August 30, 2024
- 331 Views
- 9 Min Read
Are you running your field service business, but have no idea of your metrics and turnovers? Things might seem fine, but what if there are hidden problems you’re not aware of? What if you’re spending too much on resources or missing chances to improve?
Here’s the twist: Without tracking anything, you’re essentially flying blind. The good news is, there’s a solution to this issue—KPIs and metrics. These tools give you a clear view of what’s going on behind the scenes, helping you spot issues, measure success, and make smarter decisions to keep your business running smoothly.
What are field service key performance indicators?
Key Performance Indicators (KPIs) are like the vital signs of your field service business. They provide clear, measurable insights into how well your operations are performing.
Let’s break down KPIs in the simplest way possible. Just as a doctor uses specific measurements like heart rate or blood pressure to assess your health, KPIs help you gauge the effectiveness of your team's work, the satisfaction of your customers, and the overall efficiency of your business processes.
By regularly checking these indicators, you can identify areas for improvement and ensure your business stays on track.
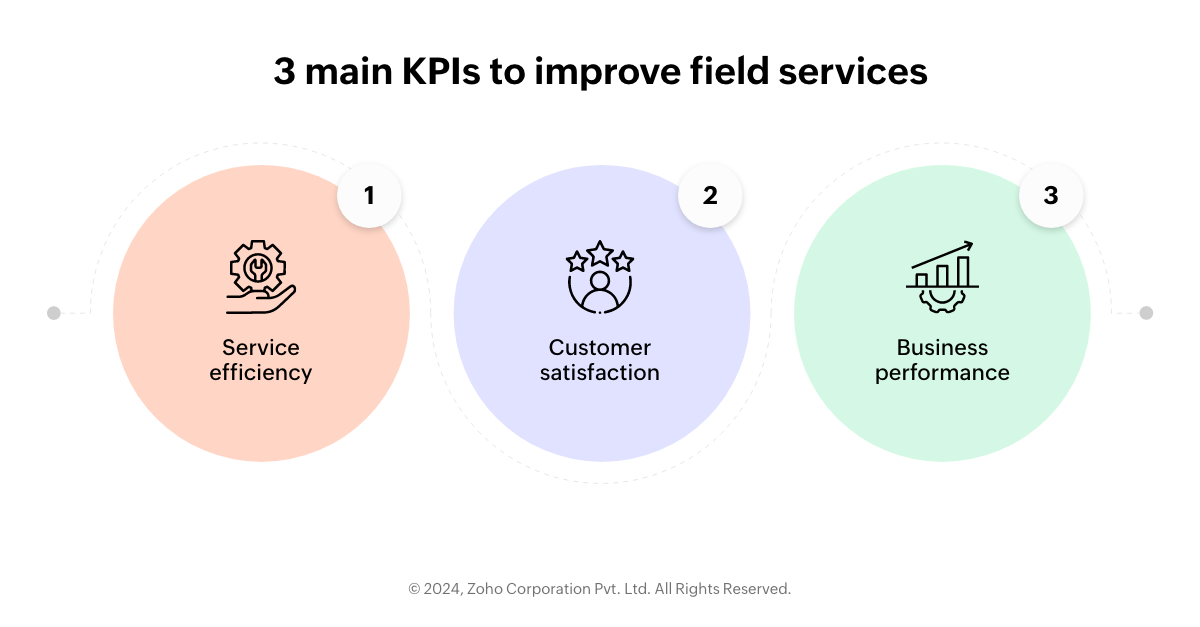
3 main key performance indicators to improve field services
To keep things organized, KPIs are typically grouped into three main categories:
Service efficiency
Customer satisfaction
Business performance
Let’s dig deep into each of these field service management KPIs categories and see how they help in managing your field service operations.
1. Service efficiency
Service efficiency KPIs are all about how smoothly and quickly your team gets their work done. The aim is to reduce the time and resources needed to complete tasks without sacrificing quality. Let’s discuss what that looks like:
a. Average job completion time
Imagine you run a heating and cooling service company. One of your technicians goes out to fix a customer’s air conditioner. The Average job completion time measures how long it takes from the moment the technician arrives to when the job is fully done.
If it usually takes about two hours, but one technician regularly finishes in just one hour without any complaints, that’s a sign of high efficiency. However, if they’re rushing and making mistakes, that’s a problem. So, it’s finding the right balance between speed and quality.
b. Average response time
Now, let’s say a customer’s heater breaks down in the middle of winter. They call your company for help. Average response time is how long it takes for your team to respond to that service call.
If your team gets there within an hour, your customer will likely be relieved and satisfied. But if it takes several hours, that customer might be frustrated. Faster response times generally lead to happier customers, but again, it’s also essential to maintain quality service when you get there.
c. Mean time to repair (MTTR)
Once your technician starts repairing on that heater, the mean time to repair measures how long it takes to get it up and running again.
Let's say it usually takes about three hours to fix a failed heater. If your team can consistently do it in two hours, that's great—but only if the heater doesn't break down again soon after. A lower MTTR means your team is good at solving problems efficiently.
d. Number of repeat visits
Ideally, your technician would fix that heater on the first visit. Number of repeat visits tracks how often your team needs to go back to the same job to fix something they should have handled the first time.
If you find that repeat visits are common, it might be a sign that your team needs more training or better tools. Reducing repeat visits not only saves time and money but also keeps customers happier since they prefer problems solved quickly.
e. Average travel time and distance
If your business covers a large area, average travel time and distance become important.
For example, let's say your technician spends an hour driving to each job. If you can optimize their routes so that they're spending only 30 minutes on the road, they can fit in more jobs each day. This KPI helps you understand where you can cut down on travel time to boost efficiency and reduce fuel costs.
f. Field technician utilization
This metric looks at how much of your technician's time is spent actually working on jobs versus downtime (like waiting for the next job or traveling).
For example, if a technician is on the clock for 8 hours but only spends 4 hours on the actual tasks, that's 50% utilization. Ideally, you want this number to be as high as possible because more time spent working means more jobs completed and more revenue for your business.
2. Customer satisfaction
Customer satisfaction KPIs give you insight into how your customers feel about the service they’re receiving. Keeping customers happy is predominant because satisfied customers are more likely to stay loyal and recommend your business to others.
a. Customer satisfaction score (CSAT)
After your technician finishes fixing that heater, you might send the customer a short survey asking them to rate their experience on a scale from 1 to 10. This is your customer satisfaction score (CSAT).
If most customers are giving you 9s and 10s, that's a good sign that your service is meeting or exceeding expectations. Lower scores, on the other hand, could indicate that there's room for improvement in how your team interacts with customers or handles their issues.
b. Customer retention rate
Let's say you run a subscription-based maintenance service for the heating and cooling systems. Customer retention rate usually measures how many of your customers renew their subscription year after year.
If 90 out of 100 customers renew, you've got a 90% retention rate, which is pretty solid. If this rate starts to drop, it's a signal that something might be off—maybe your service quality has slipped, or perhaps competitors are offering better deals.
c. Customer acquisition cost
This KPI looks at how much it costs you to bring in new customers.
For example, if you spend $1000 on marketing and gain 10 new customers, your customer acquisition cost is $100 per customer. Lowering this cost while maintaining or improving service quality is a key to boosting your profitability. If you can attract more customers for less money, your business is in a good position to grow.
3. Business performance
Business performance KPIs help you understand the overall health of your business, especially from a financial perspective. These metrics often focus on how well your business is growing, how profitable it is, and how sustainable it is in the long run.
a. SLA compliance rate
If you have service level agreements (SLA) with your customers—contracts that specify things like response times and uptime guarantees—this KPI measures how well you're meeting those promises.
For instance, if your SLA states that your technician will be on-site within 2 hours of the service call and you're hitting 95% of the time, that's a good compliance rate. High compliance rate builds trust with your customers and can lead to long-term relationships.
b. First-time fix rate
First-time fix rate KPI looks at how often your technicians resolves issues on the first visit without needing to return for additional repairs.
If your FTFR is high, it means your team is well-prepared and skilled, which leads to happier customers and lower costs. For example, if 80 out of 100 service calls are fixed on the first visit, you have 80% FTFR. Improving this rate can reduce repeat visits and improve overall efficiency.
c. Contract uptime
Let’s say you provide ongoing maintenance services for a business’s critical systems. Contract Uptime measures the percentage of time those systems are operational as promised in the contract.
If you guarantee 99% uptime and you’re consistently hitting that target, it shows that you’re delivering reliable service, which is essential for customer satisfaction and retention.
d. Contract & revenue leakage
This KPI tracks the revenue you’re losing due to inefficiencies, missed opportunities, or unbilled services.
For example, if you’re supposed to bill a customer for 10 hours of work but only bill for 8 due to a clerical error, that’s Revenue Leakage. Minimizing leakage is important for maintaining profitability. By tightening up your billing processes and ensuring all services are accounted for, you can secure the money your business earns.
e. Job/service profitability
Every job or service your team completes contributes to your bottom line. Job/Service Profitability measures how much profit each job generates.
For instance, if a job costs you $200 in labor and materials and you charge the customer $500, your profit is $300. By tracking this KPI, you can identify which services are most profitable and consider phasing out or improving less profitable ones.
f. Business growth
Finally, Business Growth looks at how your field service operations are expanding. This could be through increased sales, adding new services, or growing your customer base.
For instance, if your revenue has increased by 20% year over year, that’s a strong indicator of growth. Keeping an eye on this KPI helps ensure your business is moving in the right direction, even as the market and technology evolve.
What are field service metrics?
Field service metrics are the stats that give you a clear picture of how your business is doing. They track things like how fast your team gets jobs done, how often things are done right the first time, and how happy your customers are with your service.
Top 8 field service management metrics
Here are the top 8 field service performance metrics you should definitely keep an eye on:
1. Call volume
Too many calls?
Cut it down by letting customers book and manage appointments via an app.
Get automatic updates.
Track service in real-time without having a call.
2. Time to site
Late arrivals always annoy customers.
Use route planning and GPS to get technicians to job sites on time.
Keep everyone updated on where they are and when they'll arrive.
3. Jobs per day
Want to fit in more jobs?
Use smart scheduling and AI to assign tasks based on locations, skills, and availability, helping your team stay organized and efficient.
4. First time fix rate
As discussed before, fixing issues on the first try keeps customers happy.
Give your team the right tools and info, even offline, so they can tackle problems quickly and correctly.
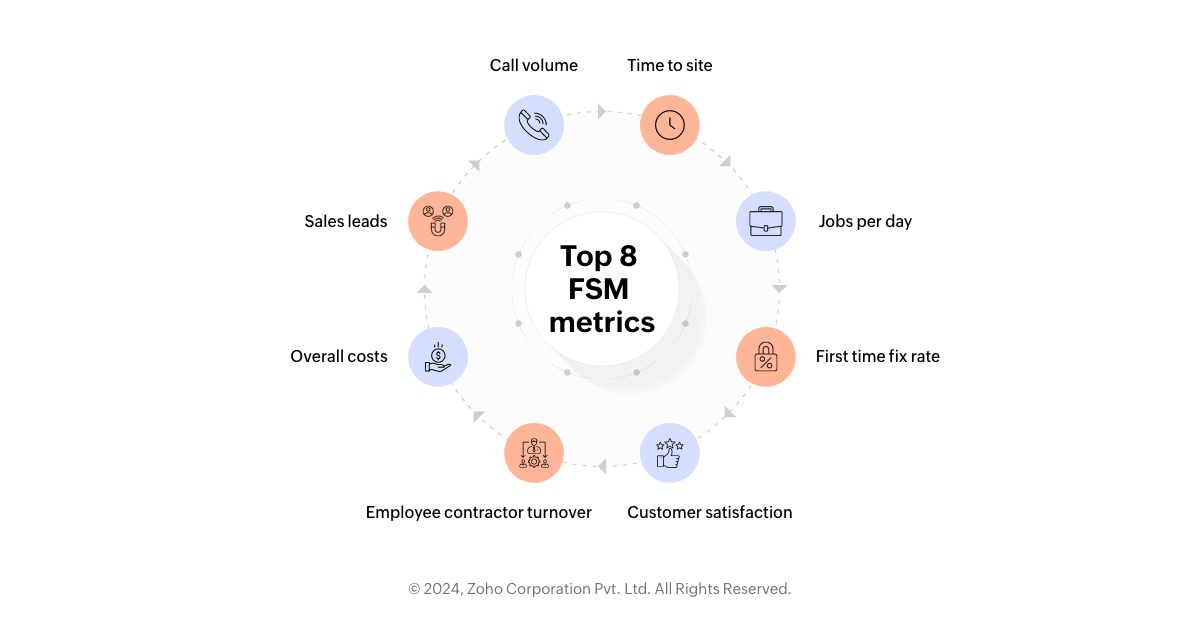
5. Customer satisfaction
Keep customers smiling by making it easy for them to give feedback. Use quick surveys and updates on service status to show you care about their experience.
6. Employee and contractor turnover
High turnover?
Use AI to simplify time-tracking and job info so workers can focus on their tasks and feel satisfied with their job. This act reduces the chance they’ll leave.
7. Overall costs
Save money by automating and streamlining processes. Switch to digital job tracking and automate scheduling. It speeds up invoicing by cutting down on errors and saves cash.
8. Sales leads
Turn field visits into sales opportunities. Let workers log potential sales—cross selling additional products—during jobs, so your sales team can follow up and boost your revenue with new offers.
How to monitor KPIs with AppCreator
Looking for a solution to track your KPIs with ease? ManageEngine AppCreator makes tracking metrics a breeze.
You can create dashboards from scratch and customize them on AppCreator, which gives you a clear view of key metrics like call volume and job completion rates all in one place. Elements like panels, charts, gauges, search options, forms, reports, and buttons can be embedded by dragging and dropping them into the dashboard to track KPIs.
With real-time updates, you’ll always have the latest data, helping you act quickly if issues arise. You can set up automated alerts to be notified when KPIs hit critical levels, and use custom reports to dig deeper into your data. Plus, the platform integrates smoothly with your other tools, giving you a complete overview of business metrics.
By using AppCreator, you’ll have all the tools you need to monitor your field service KPIs efficiently and effectively. Give it a try and see how it can streamline your operations and boost your business performance!