Configure area chart
Area charts are similar to line charts, the difference being that the area between the x-axis and line is filled with color or pattern. Using area charts, users can analyze individual as well as an overall change in your data and are ideal for displaying trends over a period for single or multiple field values. These charts offer a simple presentation that is easy to interpret at a glance. A stacked area chart shows data series plotted with filled areas that are stacked, one on top of the other. Area chart configuration includes setting values for the x and y axes.
To configure a area chart
- Edit your application.
- Select the required page, then open the page builder.
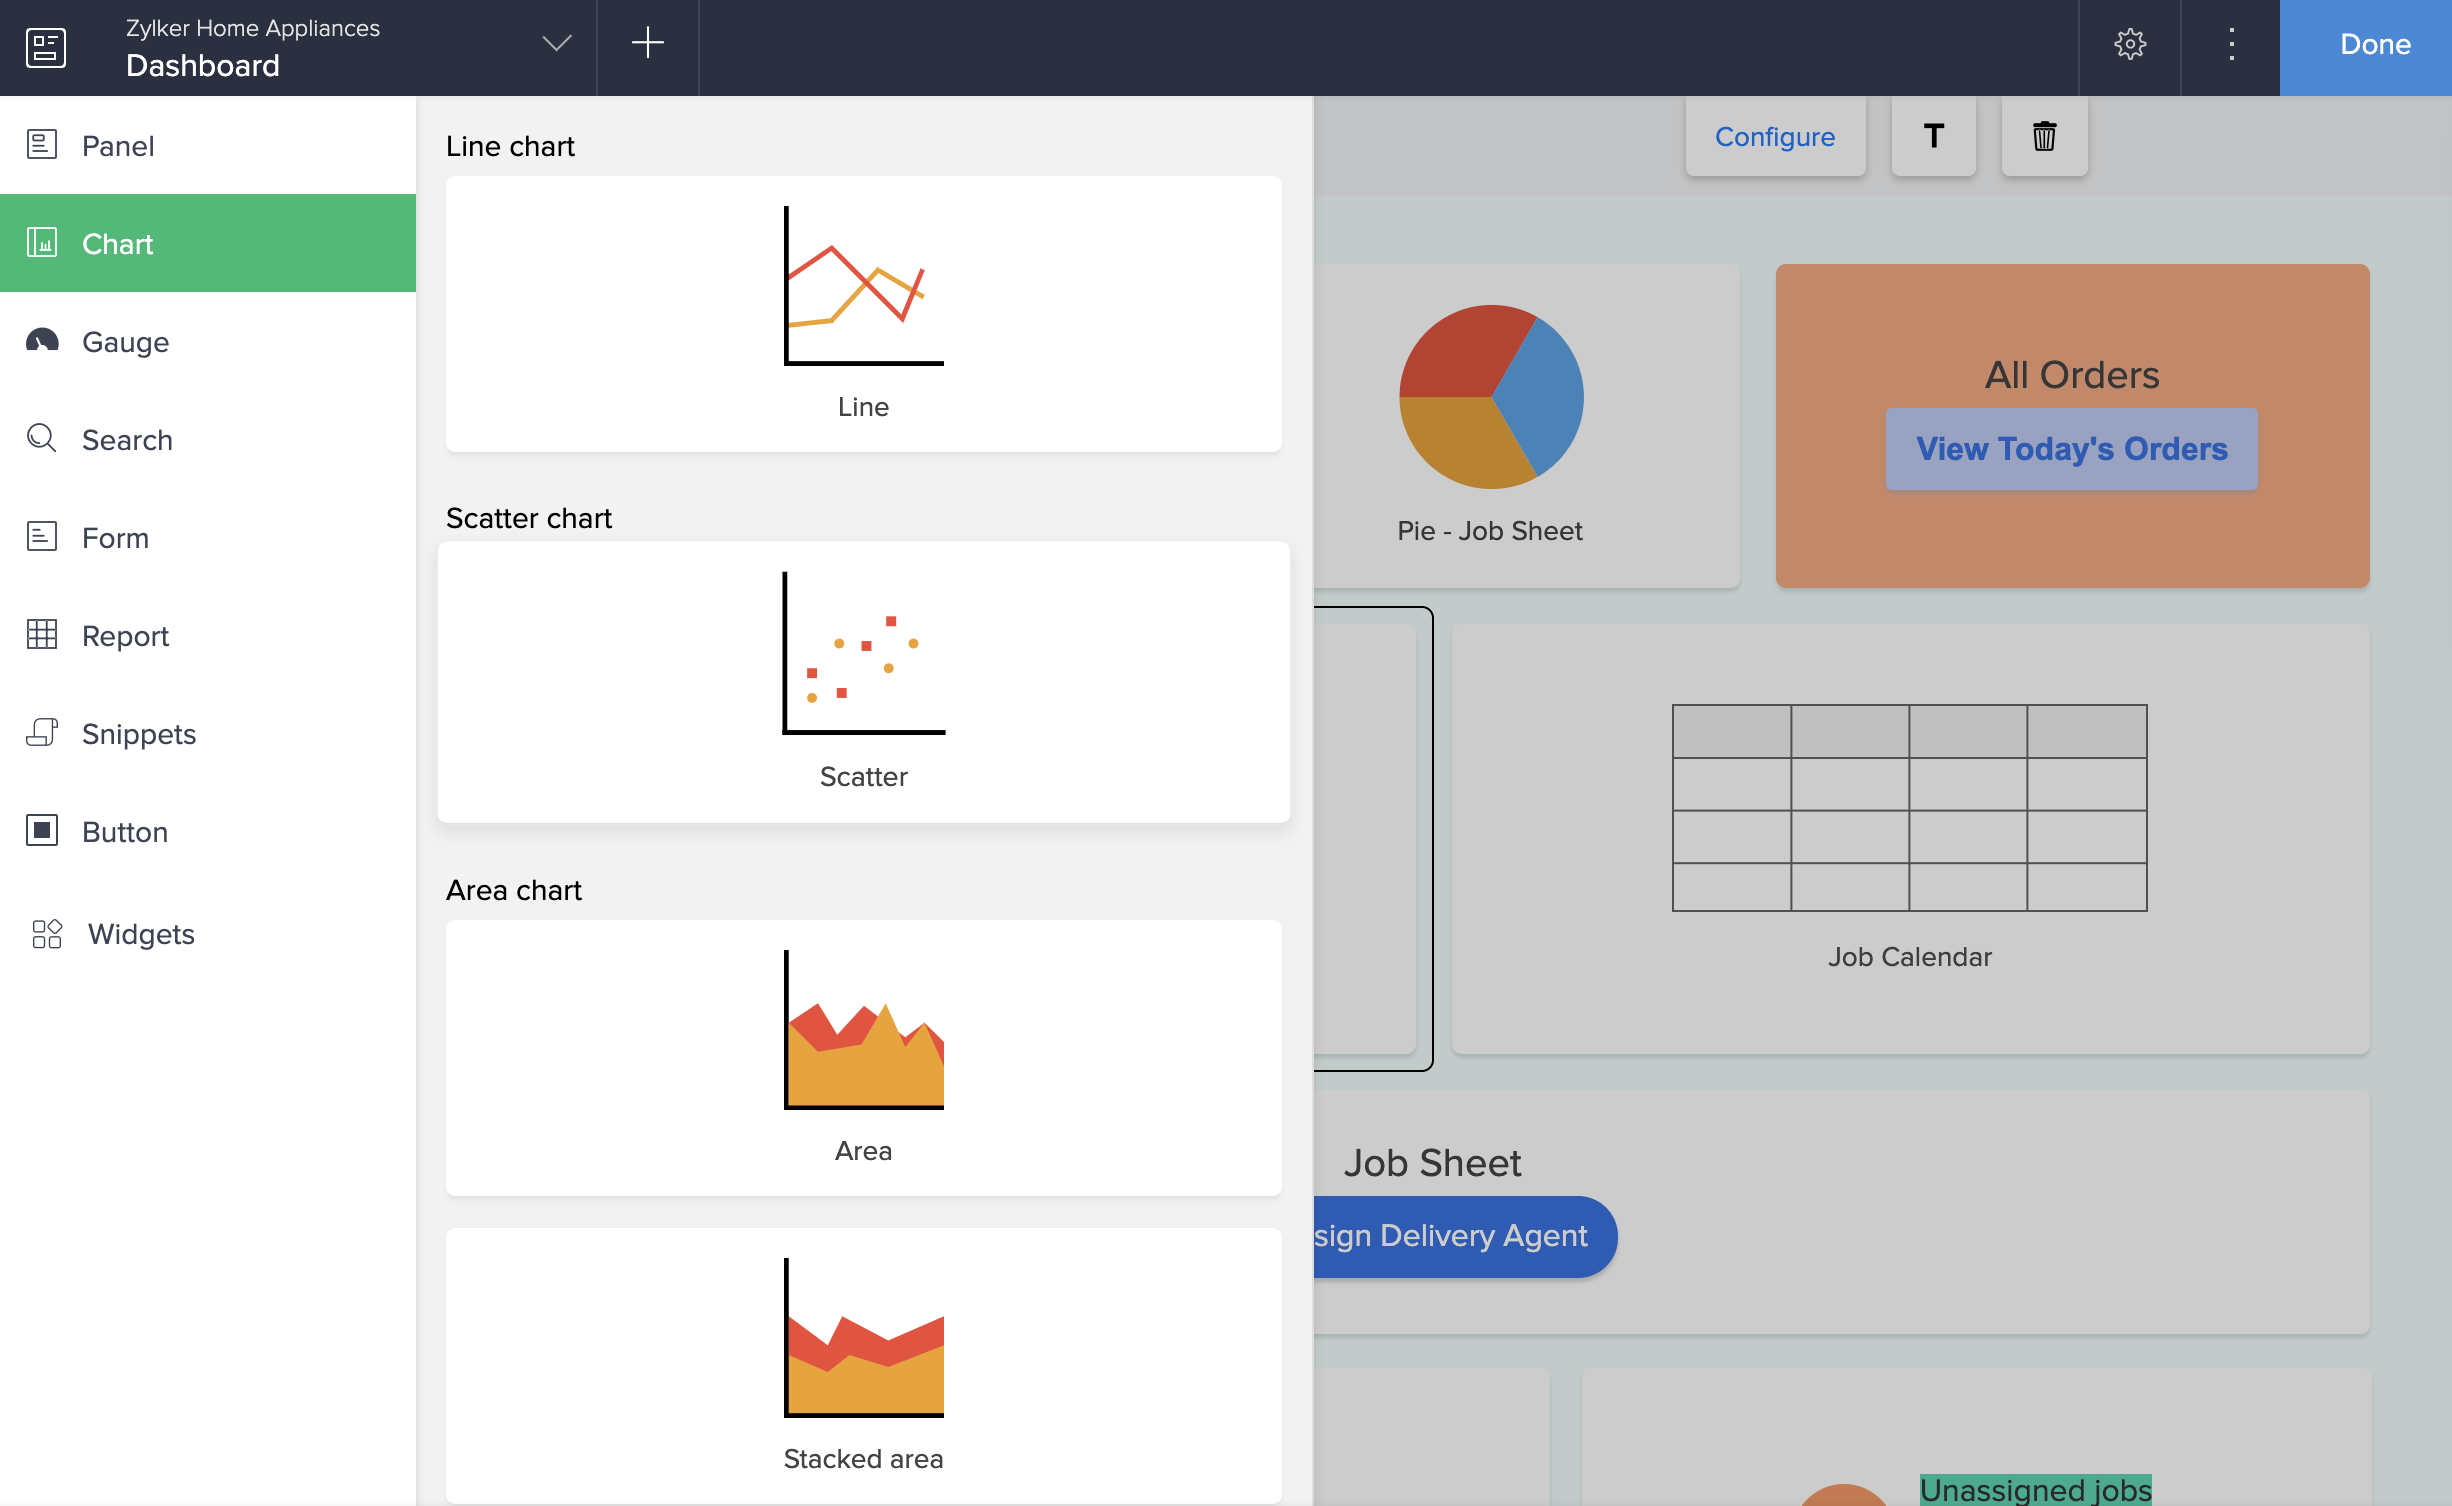
- Click the Chart option from the page elements menu on the left. A menu will slide in.
- Drag and drop an area chart from the area chart types available in the gallery. The Chart Configuration pane slides in from the right.
- Select a form to represent its data on the chart.
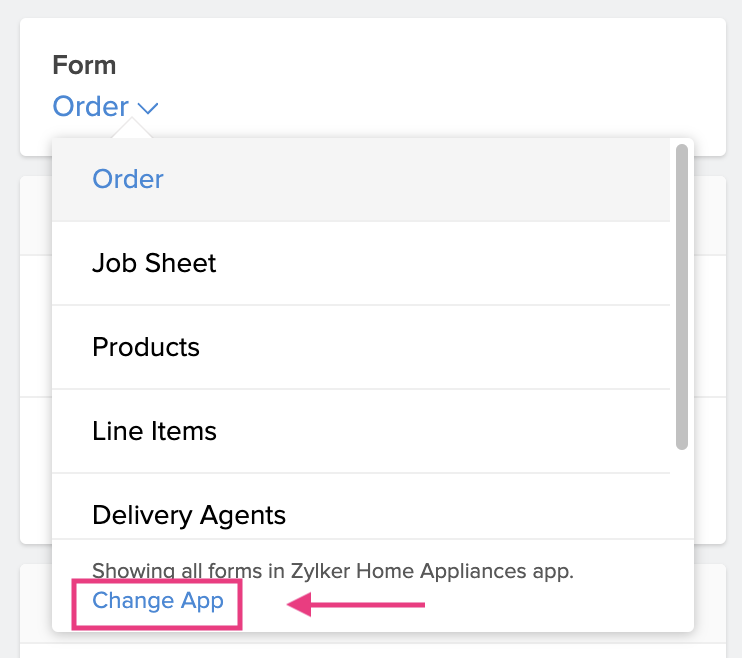 Note: The Form dropdown lists all the forms in the application you are currently working on. To select a form from another application, click the Change App in blue in the footer of the form dropdown. Select another application and click Done to view all the forms in it.
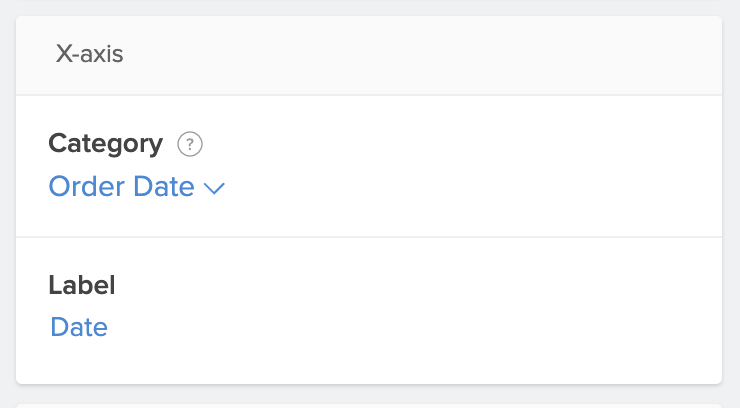
 - Select a field to map the category axis (x-axis).
- Enter a label for the x-axis.
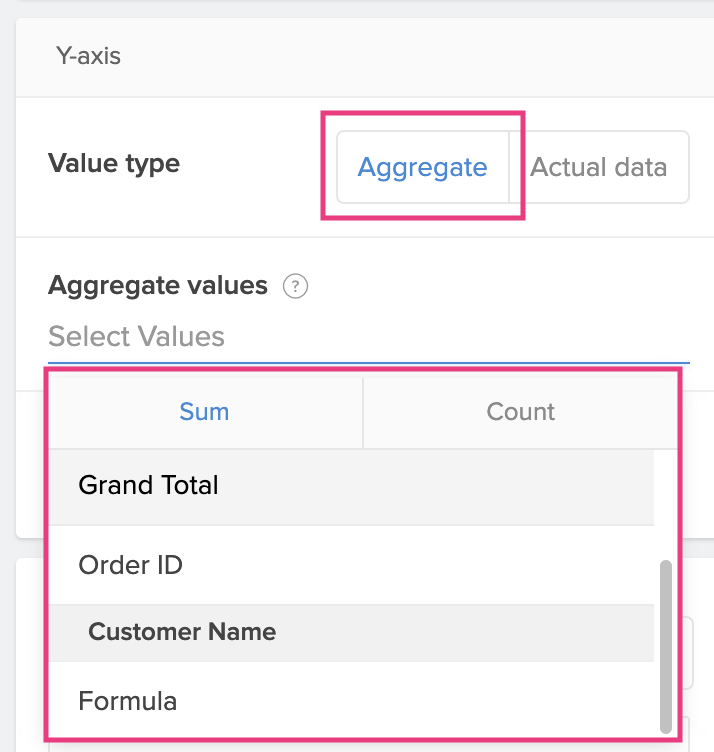
- Choose a value type to be displayed on the y-axis.
- Aggregate: Display the aggregate such as Sum or Count of the field.
- Actual: Display the actual value of the field.
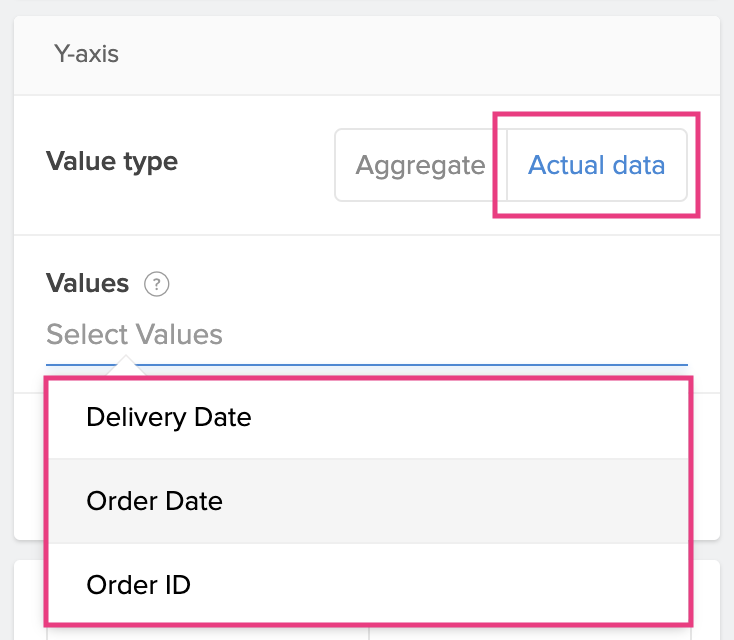
- Aggregate: Display the aggregate such as Sum or Count of the field.
- Enter a label for the y-axis.
- Evaluate for:
- All Records: Evaluates for all the records in the form.

- Selected Records: Evaluates for records based on the set criteria.
- To set criteria: Click Selected Records > Select Field > Select Operator > Enter a value . Choose AND or OR to add criteria.
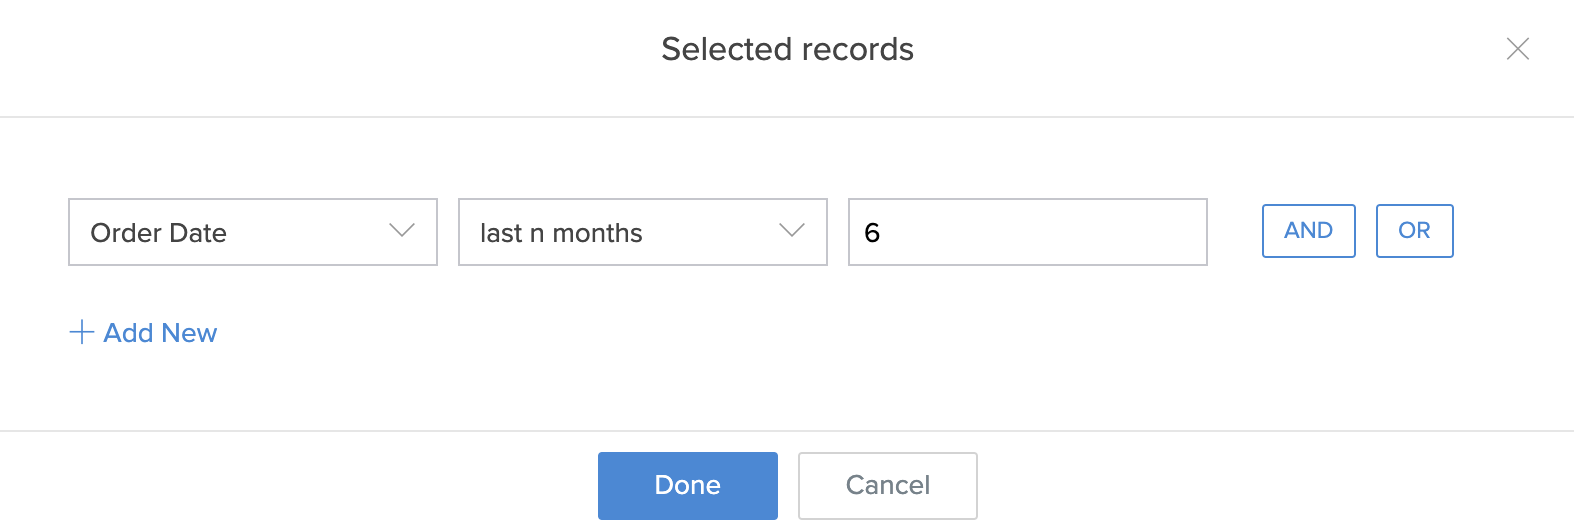
- To set criteria: Click Selected Records > Select Field > Select Operator > Enter a value . Choose AND or OR to add criteria.
- All Records: Evaluates for all the records in the form.
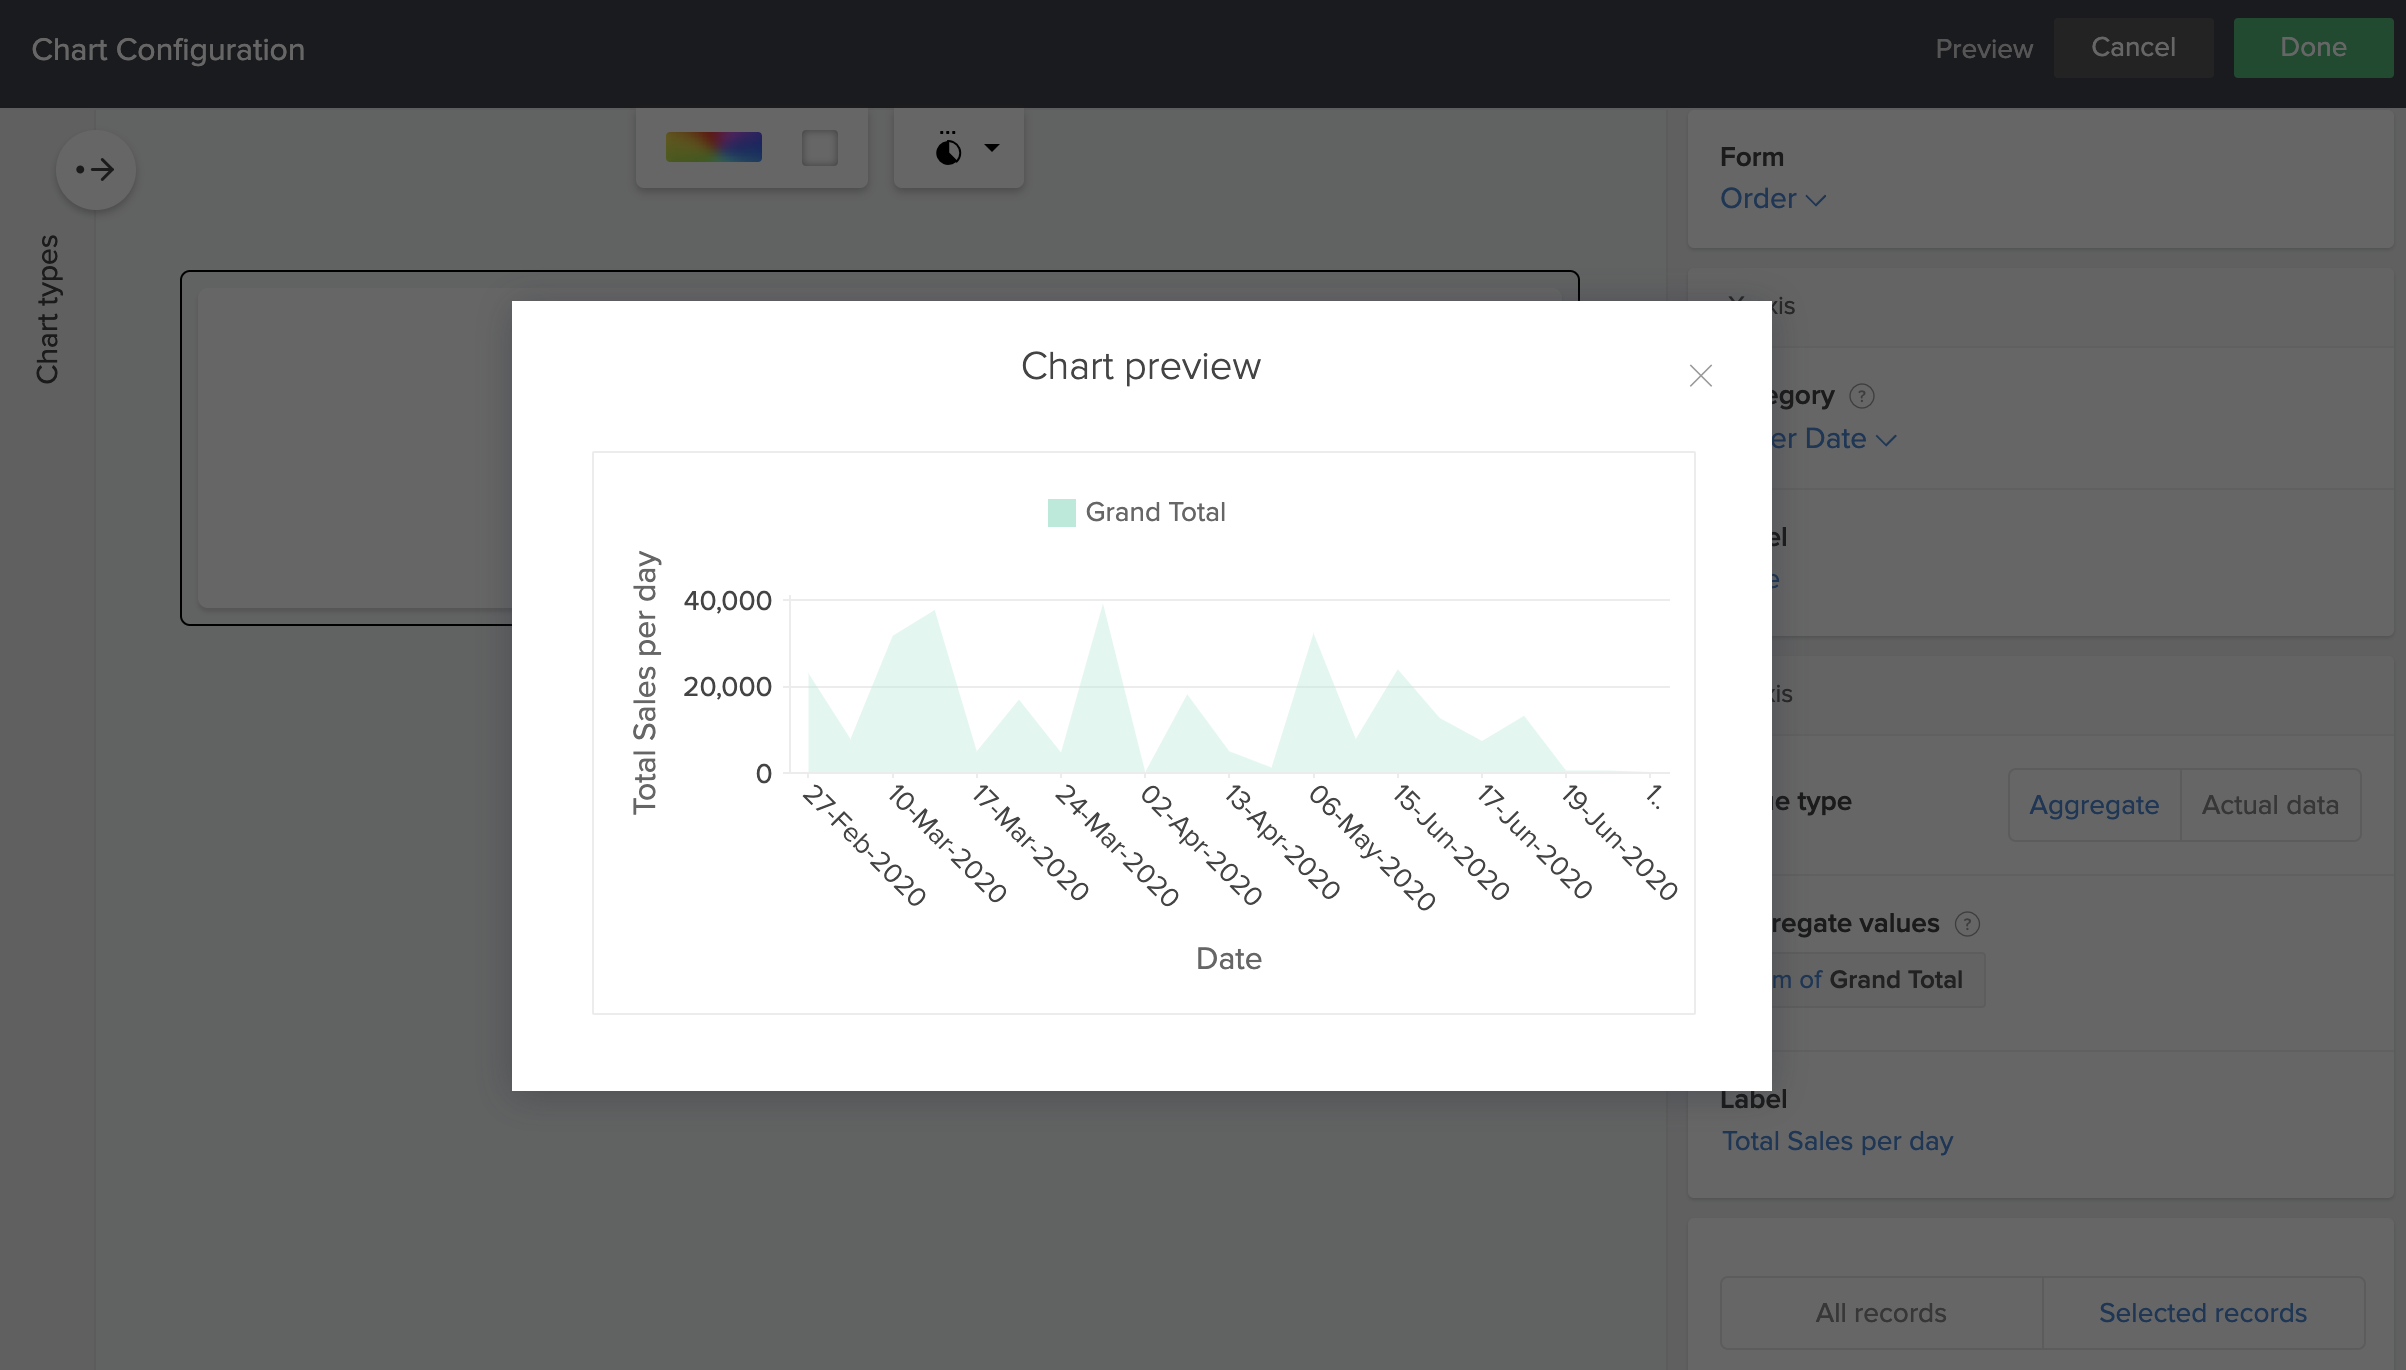
- Click the Preview option at the top right of the Chart Configuration pane to view a preview of the configured chart.
- Close the preview window and make further edits to the chart or click Done to confirm submission.
To configure a stacked area chart
- Repeat steps 1-7 as above.
- After Step 7 in the area chart configuration, choose a Stack by field from the drop down. This field defines the values based on which each area of the area chart will be broken into.
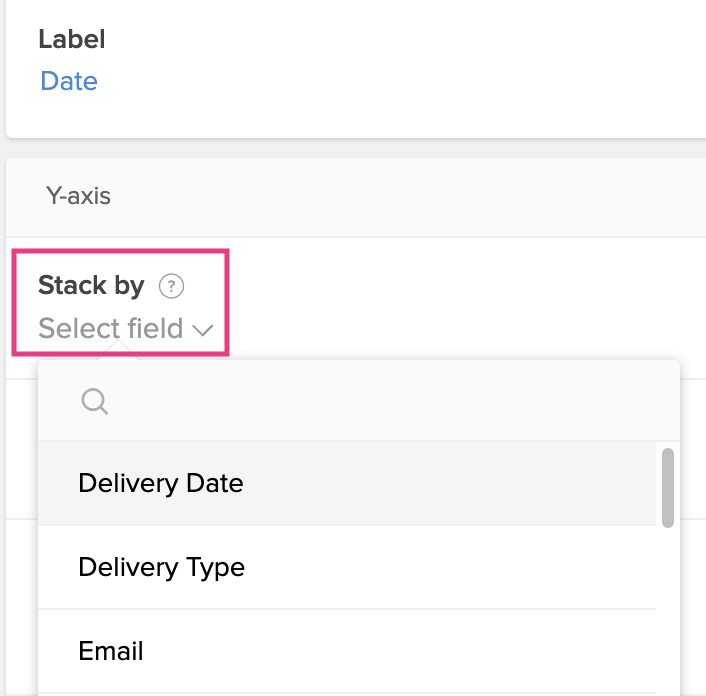
- Continue configuring from Step 8.