Embedding Views in Web Pages, Web Applications and Blogs
Analytics Plus allows you to embed any view (tables, reports, or dashboards) into a website, web application, blog, or intranet page. These embedded views can be made accessible with both private and public access.
Users visiting the webpage can see the latest live version of the view, and any changes made to the view will automatically be reflected in the embedded version.
- What are the views that can be embedded in web pages?
- What are the access permissions available when embedding a report/dashboard?
- How to embed a report/dashboard with secured login access?
- How to embed a report/dashboard without login access?
- How do I embed a report/dashboard with public access?
- Is it possible to set a password for views that are embedded without login access?
- What are the interaction options available while embedding a report or dashboard?
- What happens when I regenerate an embedded view's random key?
- How do I edit the permissions of embedded views?
- How do I remove the access of the embed view?
- Can I pass a dynamic filter while embedding the view?
1. What are the views that can be embedded in web pages?
You can embed every view you create using Analytics Plus, such as tables, charts, pivot views, tabular views, summary views, query tables and dashboards. To embed a view created in Analytics Plus, you need to get the corresponding HTML code snippet generated for the view by Analytics Plus, and paste it within the <body>...</body> HTML tags of the destination page.
2. What are the access permissions available when embedding a report/dashboard?
The following are the access permissions available when embedding a report or a dashboard./p>
- Private Access: This option enables you to embed the views with secured access permissions.
- Access with Login: This option offers the highest level of security to embed a view. Only the users with whom you have shared the report will be able to view it after logging into Analytics Plus. Click here to embed a view with login access.
- Access without Login: This option allows users to access the embedded views without logging into Analytics Plus. However, you can set a password or expiry date for the views to ensure secured access. Click here to know how to embed a view without login access.
- Public Access: This option allows you to make your reports or dashboards accessible to users within your organization or to any external users who visit your webpage. Click here to know how to embed a view with public access.
3. How to embed a report/dashboard with secured login access?
To learn about editing the permissions for the embedded report or dashboard, click here.
4. How to embed a report/dashboard without login access?
To learn about editing the permissions for the embedded report or dashboard, click here.
5. How do I embed a report/dashboard with public access?
Click here to know more about public views.
6. Is it possible to set a password for views that are embedded without login access?
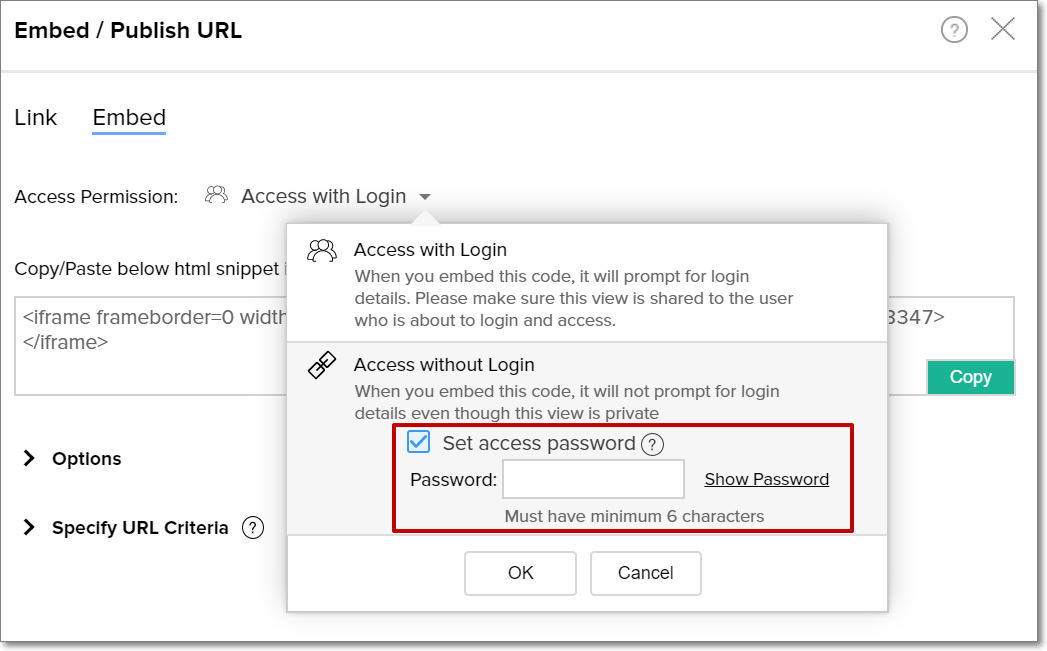
Yes. The Access without Login option generates a private permalink that can also be encrypted with a password. To do this, select the Set access password option and enter the desired password.
7. What are the interaction options available while embedding a report or dashboard?
Analytics Plus allows you to embed interactive reports and dashboards. When you embed a report in interactive mode, users visiting the web page can view and interact with the chart easily. The following are the available interactions when a chart is embedded in interactive mode:
- Tooltips and highlights
- View underlying data
- Drill down
- Change chart type
- Apply user filters, if any.
- Interact with legends
You can also embed reports as static images, which will load faster. This feature is applicable only to charts.
8. What happens when I regenerate an embedded view's random key?
You can regenerate the private key for the views that are embedded without login access. This will render the previously embedded view invalid. To access the view again, the newly generated embed code has to be updated in the web page.
9. How do I edit the permissions of embedded views?
Follow the steps below to do this:
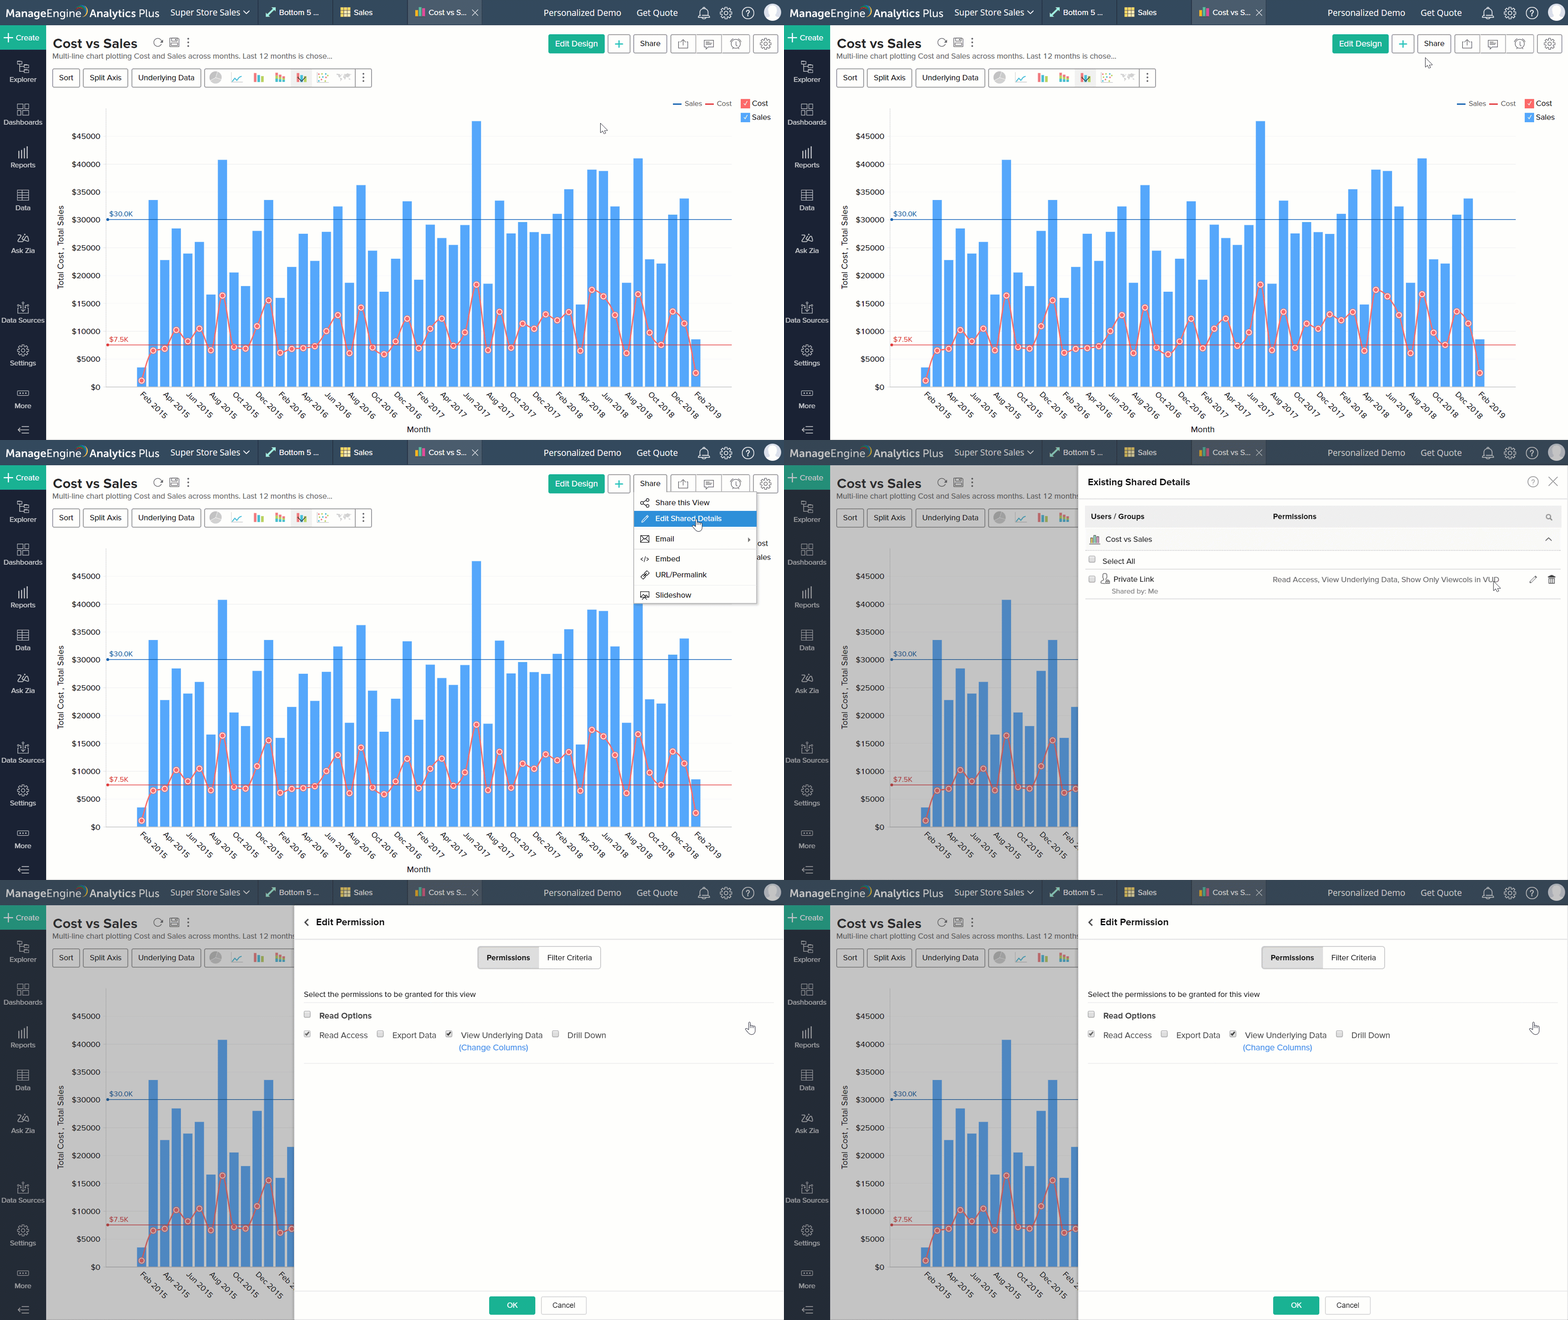
Open the required view in Analytics Plus, click the Share icon, and select the Edit Shared Details option.
Click the Edit icon that appears on mouse over the listed details. In the page that appears, modify the permissions as needed, and click OK.
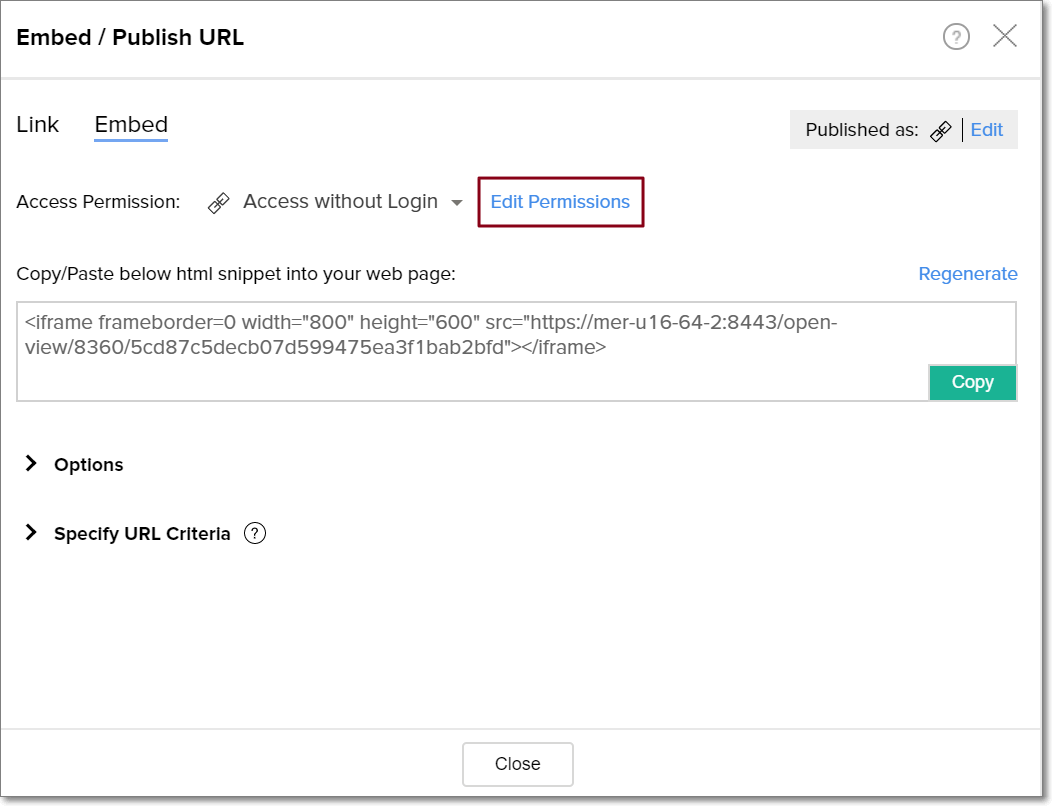
You can also edit your embedded view's permission by clicking Share > Embed. Click the Edit Permissions link. In the page that appears, edit the permissions as needed, and click Update.
10. How do I remove the access of an embedded view?
Follow the steps below to do this:
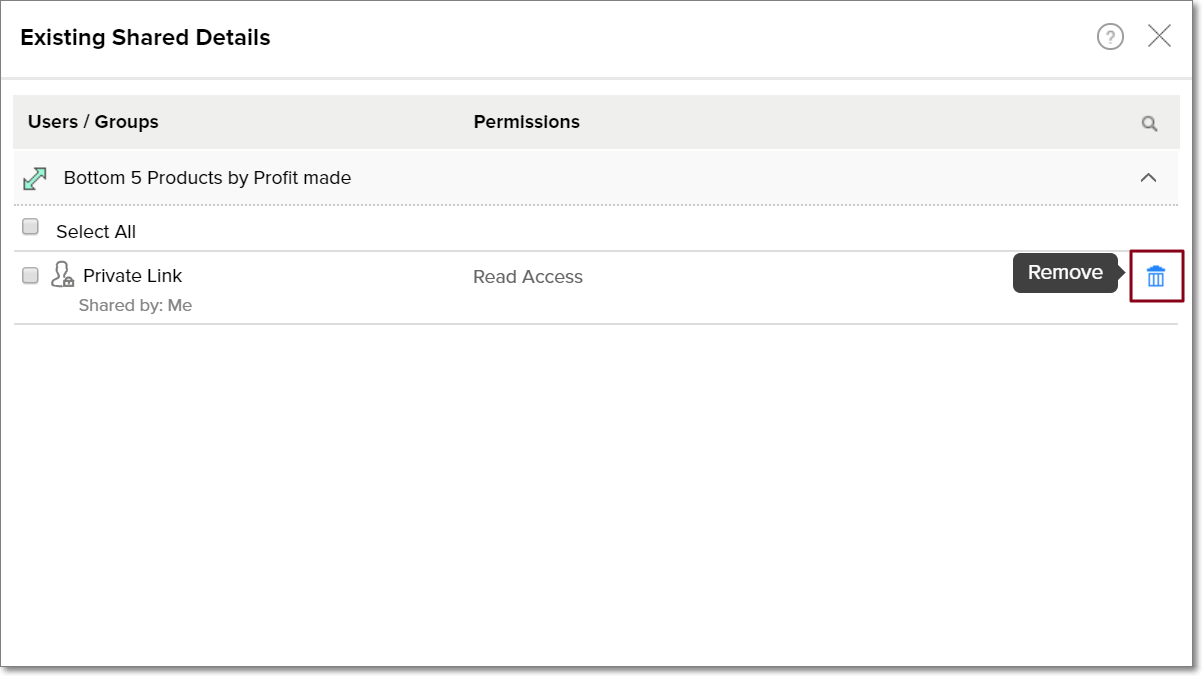
Open the required view in Analytics Plus, click the Share icon, and select the Edit Shared Details option.
Click the Remove icon that appears on mouse over the listed details.
11. Can I apply dynamic filters while embedding a view?
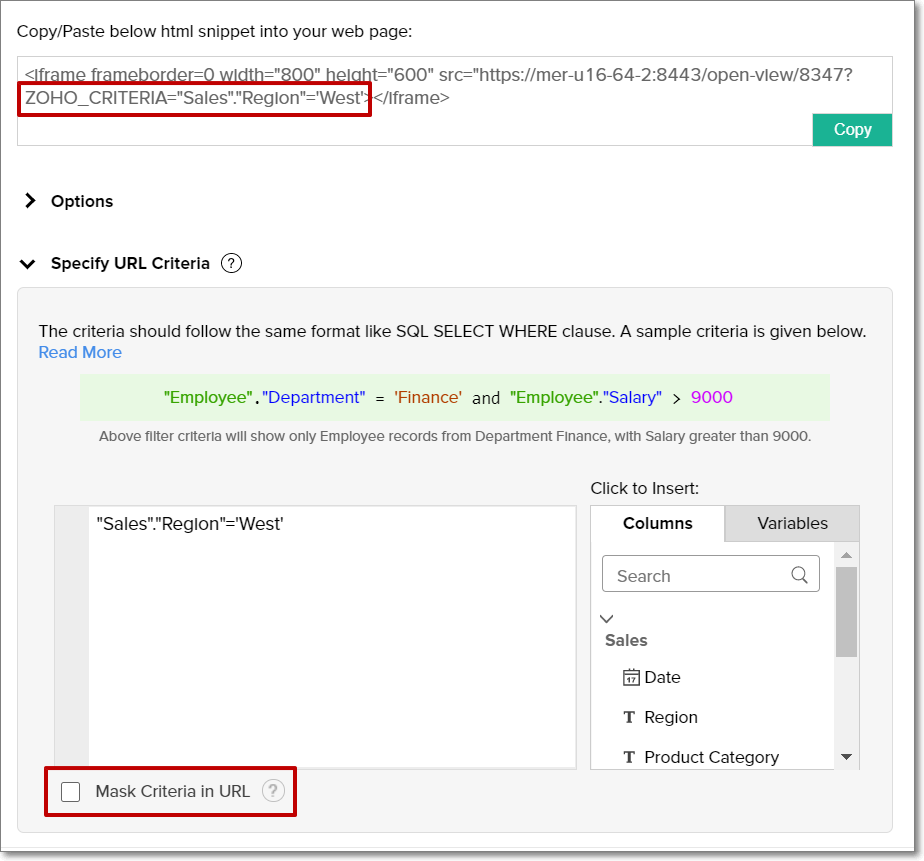
Yes. By applying dynamic filters over embedded views, you can embed the same view across several web pages by applying different filter criteria each time, to suit the allowed permissions and profile of the user accessing the page. For example, when you use the criteria "Stores"."Region"='West', the person accessing the chart will see only data for the sales in the western region.
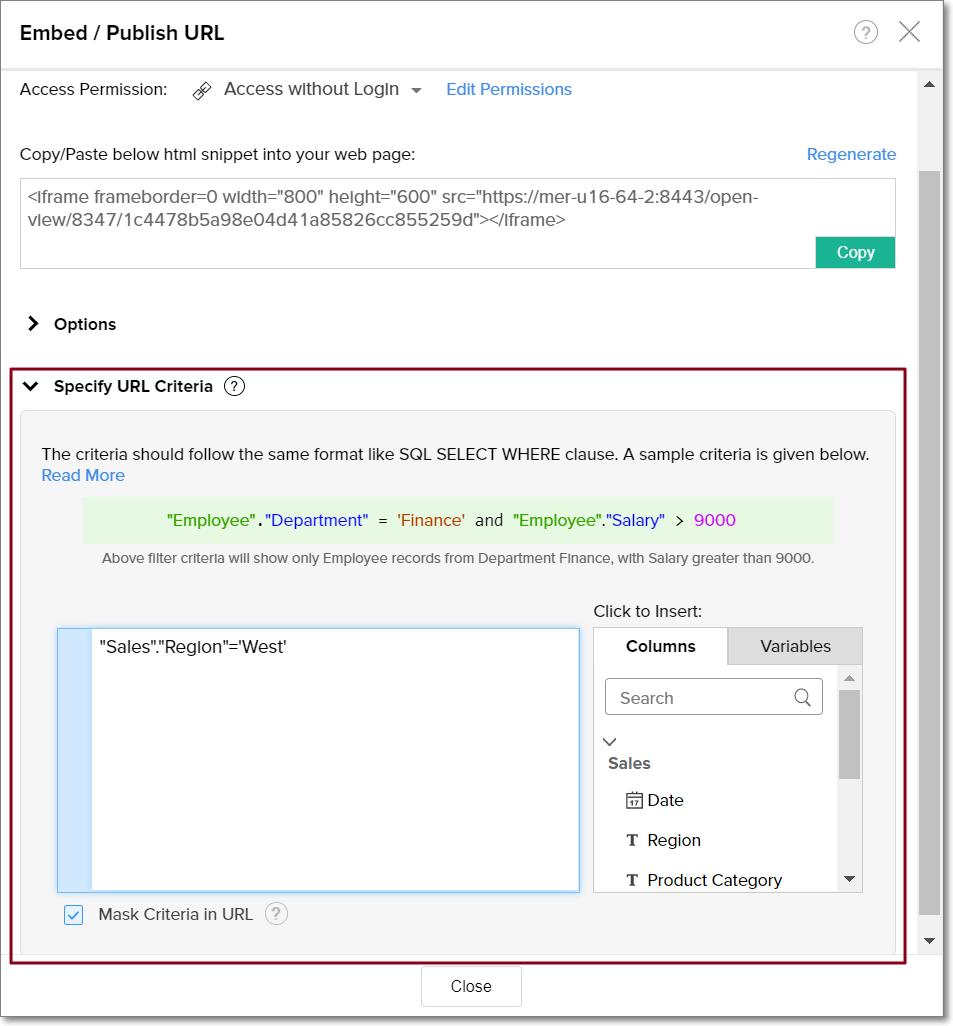
Selecting the Mask Criteria in URL checkbox hides the ZOHO_CRITERIA parameter from the embed URL. This ensures the specified filter criteria is appended to the URL, but not displayed.
