Tabular View
Analytics Plus offers a simple and efficient way to summarize, structure, and group large volumes of data in the form of Tabular views. These views are similar to a report or a spreadsheet and allow users to easily sort, filter, and customize the appearance of the data in the tabular view.
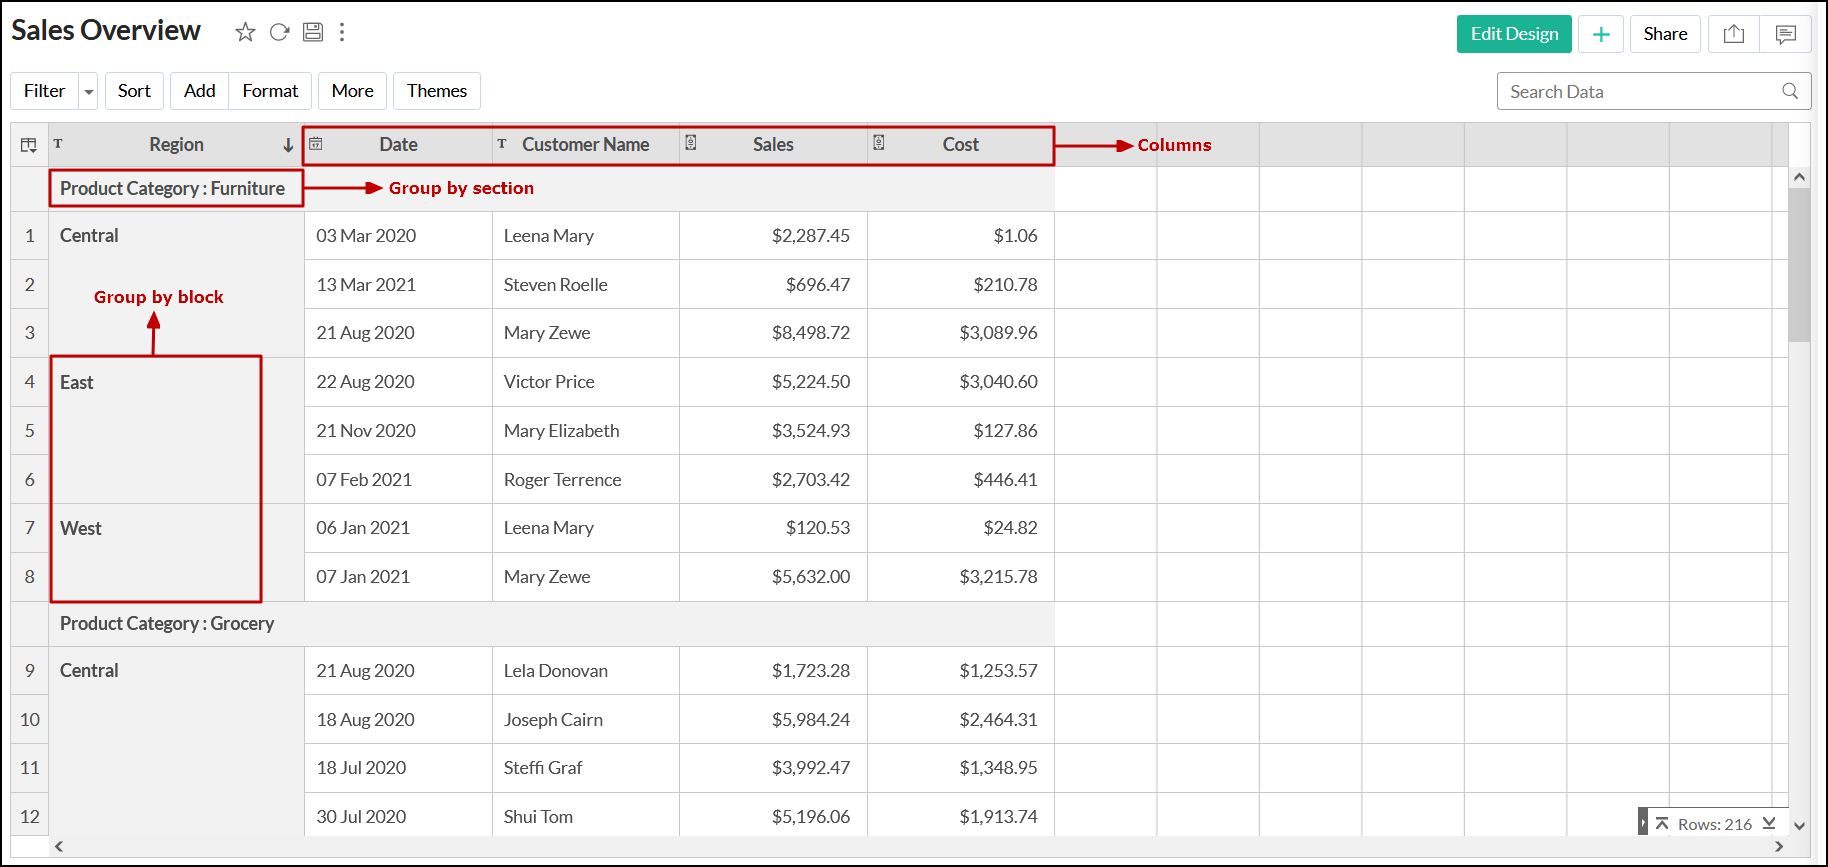
The following image depicts the basic layout of a tabular view.

In this chapter, we will discuss the following sections: