Security analysts monitor all network activities, typically relying on SIEM solutions. However, not all SIEMs are equal; their capabilities and configurations determine the volume of alerts analysts face. A SIEM solution with UEBA capabilities can help in maximizing genuine alerts and reducing false positives, especially if it comes with the peer group analysis functionality. Let's quickly review what peer grouping is before we delve deeper into how peer group analysis works.
Peer group analysis: Definition and types
Peer group analysis is a technique powered by machine learning algorithms, where users and hosts that share similar characteristics are categorized as one group. This helps us understand the context behind a user's behavior, and the degree of risk posed by them. By comparing a user's behavior with their peers and understanding the context, you gain better insights than when looking at it as an isolated event. So, essentially, you're able to increase the users' risk scoring accuracy because of the holistic view provided by peer grouping.
There can be two types of peer grouping: static and dynamic. While static peer grouping works on the basis of common attributes (such as location, designation, and reporting manager) shared by users, dynamic peer grouping works based on the behavioral similarity between users. Machine learning algorithms are employed for dynamic peer grouping as the behavioral pattern of users are studied over time to determine which peer group a user should be a part of. This raises several questions: How exactly is peer grouping performed? How does the algorithm determine which group a user should be part of? How does this impact risk scoring?
How is peer grouping performed?
Peer group analysis can be performed by SIEM solutions in different ways, depending upon the algorithm it uses. Different SIEM vendors have different algorithms, but an effective way of grouping users into peer groups is by using a clustering algorithm such as ConStream. Cluster algorithms work on the principle of clustering users into groups based on a similarity index. The machine learning algorithm learns the behavioral pattern of users over time and identifies which users have a similar pattern of behavior so it can assign them a similarity score (SS). Whether a user belongs to a cluster or not will be decided based on whether their SS is greater or lesser than the predefined threshold value. To understand this better, let's start from the ground up.
For performing peer group analysis, your anomaly detection engine will first look at the security analytics generated from ingesting the logs of your network devices. Each set of analytics generated by your SIEM solution is unique and will be associated with a different model. For example, analytics based on user logon times will constitute one model, and analytics based on SQL queries will constitute another model. A model is like a warehouse that stores the clusters associated with a particular type of activity. The number of clusters in a model will differ depending on the algorithm used.
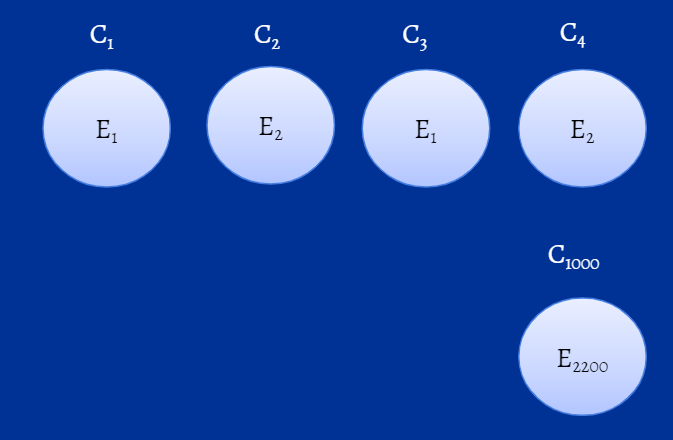
Consider a model, M1, that's associated with the logon activities of users. Assume that M1 can host 1000 clusters, named C1, C2,..., C1000. Even though the clusters such as C1 and C2 fall under the broad category of "user logons," they are still different in terms of the events they consider for analysis. For example, C1 will group events of users who exhibit certain types of logon behavior and C2 will group events of users who exhibit another set of logon behavior, that is markedly different from the overall behavior of users in C1. You can further classify user events into clusters based on other logon behaviors (C3, C4 and so on). Essentially, M1 could have a maximum of 1000 clusters and every cluster can have an "n" number of events added to it.
How does the algorithm determine which group a user should be a part of?
With so many clusters available, determining which cluster an event should be a part of depends on the similarity score. Whenever a logon event is recorded, the SS will be calculated between the event and the already available clusters, and this SS will then be compared to the threshold value. The threshold value is the definitive value for determining which cluster a user event should be a part of. For instance, let's say that for an event, E1, to be added to cluster C1, its SS should be greater than or equal to the threshold value, say 0.6. If it's not, then E1 will become part of a new cluster called C2 instead. The figure below gives you an idea of how ML algorithms calculate SS and add events to clusters.

Figure 1: Machine learning algorithm calculating SS in the background to identify which cluster an event should be a part of.
How does peer grouping impact risk scoring?
Once a user becomes a part of a group or cluster, their behavior will be compared with that of their peers, to identify if their activity was actually anomalous, or if it is the norm for peers in that group. Consider an organization called Anthem, where they have on-premises biometric-based attendance for its employees. You have to scan your fingerprint every time you enter or exit the organization, and that's how your working hours are recorded. However, to accommodate the remote users, they have a separate portal where you can use your credentials to mark your attendance. A marketing associate, Mark, who usually works from the office everyday has started to logon remotely every other day, and access the marketing database. In the general course of events, his action would be considered risky and his risk score will increase. However, if this action is compared with that of his peers, who have also been following the hybrid work model, the calculated confidence level will be readjusted and his risk score will immediately decrease, and normalize over time. The confidence level is a value calculated by your machine learning algorithm to give you an idea of how risky an event is.
With peer grouping, your risk assessment and risk scoring accuracy increase, and a great deal of false alerts can be reduced. However, it should be noted that while peer grouping has a positive impact on your risk scoring accuracy, it is not the sole deciding factor when it comes to a user's overall risk score. That will depend on various factors such as the weight assigned to the threat type, time decay factor, and seasonality. To learn more, read: How does risk scoring in anomaly detection work?
Delving further
By now, you would have a fair understanding of how peer grouping works. But, you probably still have some questions lingering in your mind, such as:
- Can a user be in more than one group?
- What happens when there's an event which cannot be categorized into any of the existing clusters, and the model is already hosting 1000 clusters?
To address the first question, let's consider two users, Mike and Harvey. Mike logs on remotely at 8am (E1) whereas Harvey logs in from the office at 11am (E2). Now, if you consider these events, you'll notice that both Mike and Harvey fall into two clusters each, one based on their mode of logon (Mike under C1 and Harvey under C2), and the other based on the time of their logon (Mike will be a part of C3 and Harvey, C4) as shown in the figure below. So, yes, a user can belong to more than one cluster.

Figure 2: Representation of clusters of model, M1.
Now, coming to the second question, if such a situation were to arise, cluster death occur. Cluster death refers to the removal of an outdated cluster from the model to accommodate the addition of a new cluster. An outdated cluster is a cluster in which no new event has been added to in a very long time. Since there's no point in having outdated events, cluster death will occur. A new cluster is born, in which the new event will be added, and this cycle continues.
ManageEngine Log360 is a unified SIEM solution with integrated UEBA capabilities. Log360 allows you to configure both static and dynamic peer grouping functionalities. It also provides contextual risk scoring, custom risk scoring, and factors in seasonality and user identity mapping to improve risk scoring accuracy. To learn how to improve risk scoring and threat detection with UEBA, read this e-book. To understand how peer grouping works in Log360, sign up for a personalized demo.


