Network diagrams are important for any organization because they outline the interconnections and relationships between each network component, giving an overall visualization of the network architecture. The interconnection between network components is shown through nodes, vertices and links, exhibiting how the whole network works together.
The fundamental step in network planning is creating a network diagram and later, these diagrams are useful for pinpointing issues in the network.
Below, we have broken it down for you to take a holistic approach towards drawing network diagrams.
Before reading each of them in detail, here is a comprehensive guide to getting started with network diagrams.
The first step before creating a network diagram is to clearly identify what needs to be mapped. This varies according to the size and scale of the network. For a large network, the network mapping will have to be segmented to show the different hierarchies. You might also want to map only one part of the network, an IP range, or a subnet. The diagram will need to include the devices that comprise the network like servers, routers, switches, clients, printers, and so on. These factors should be considered before you start creating a network diagram.
Deploying a network mapping software that discovers devices within an IP range creates maps that deliver live performance data to help proactively resolve network issues. Also vital is evaluating the required capabilities and choosing technologies that fulfill network demands while fitting into the budget.
When you're creating a network map for your organization, it is important to know every component within the network, so that they can be added to the network map. If the network map is created manually, different teams in the organization need to be contacted individually to discover all the devices. However, a network mapping tool automatically discovers all the devices and adds them to your network map. Automatic discovery also makes sure new devices are added as the network expands.
Once the outline of the network map is ready, it is time to personalize the layout. Connections should be drawn from every component, with each device denoted by name. Customizing layouts, and adding icons and images ensures the map is informative. A network map can be made intuitive for both technical and non-technical stakeholders that use the map.
When the network map is complete, having a variety of team members and users within the organization evaluate it provides the feedback needed to fine-tune the network maps to maximize its effectiveness.
All the above mentioned steps are key to creating a network map and representing your business network graphically. Here is how you can use OpManager to create powerful network diagrams.
ManageEngine OpManager is a complete network monitoring tool that enables seamless network visualization. OpManager's automatic network diagram feature lets you represent your network in different types of visualization, like Layer 2 maps, business views, maps, virtual device topography diagrams, 3-D floor views, and 3-D rack views.
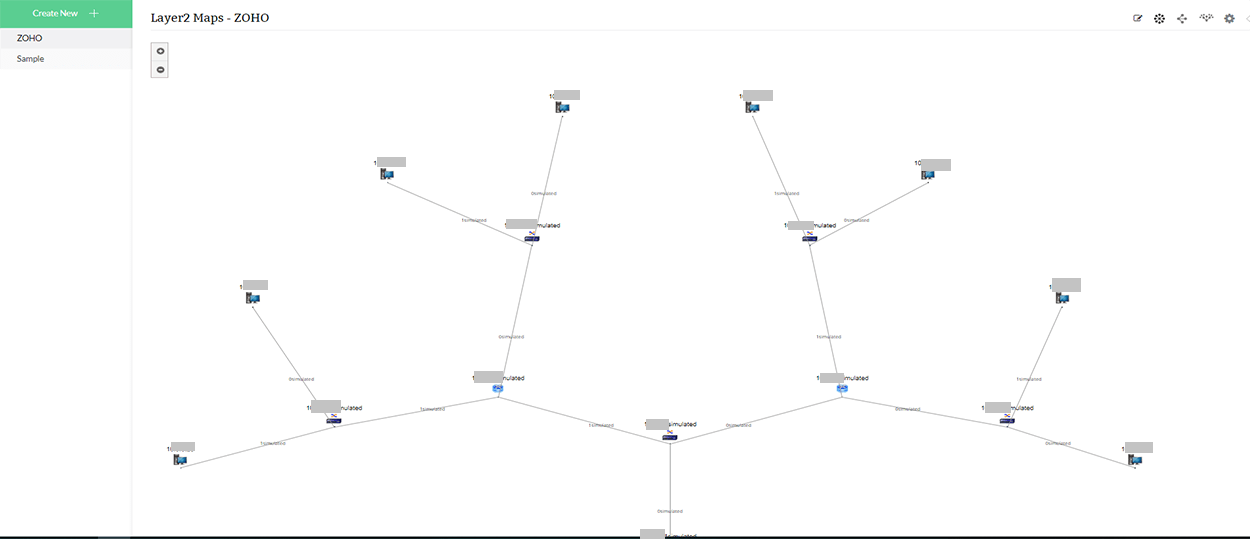
Understand the logical topology of your network using a diagrammatic representation. Layer 2 maps provide a better visualization of the physical topology of your network, and Layer 2 devices are automatically mapped when layer 2 discovery is performed.
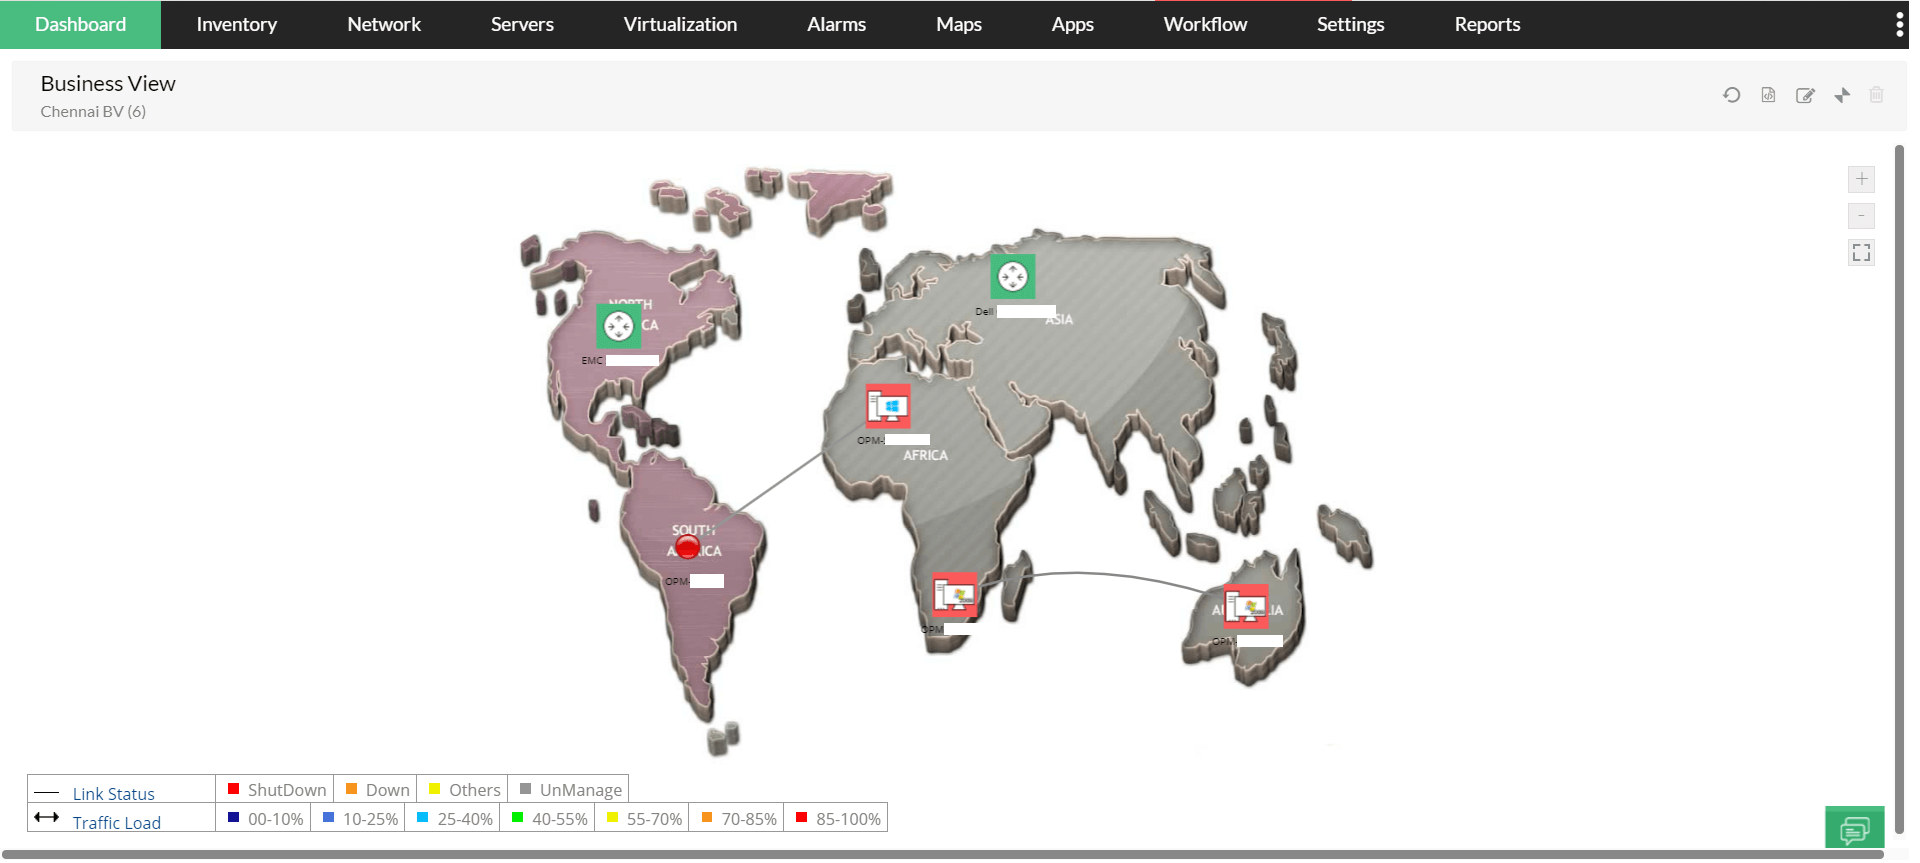
OpManager's network diagram software lets you create network topography diagram for your infrastructure using a business view format that provides you with a bird's-eye view and maps devices according to their associated business services. You can visually group devices according to the business they belong to, view link status between two devices, and view all device details from a single console.
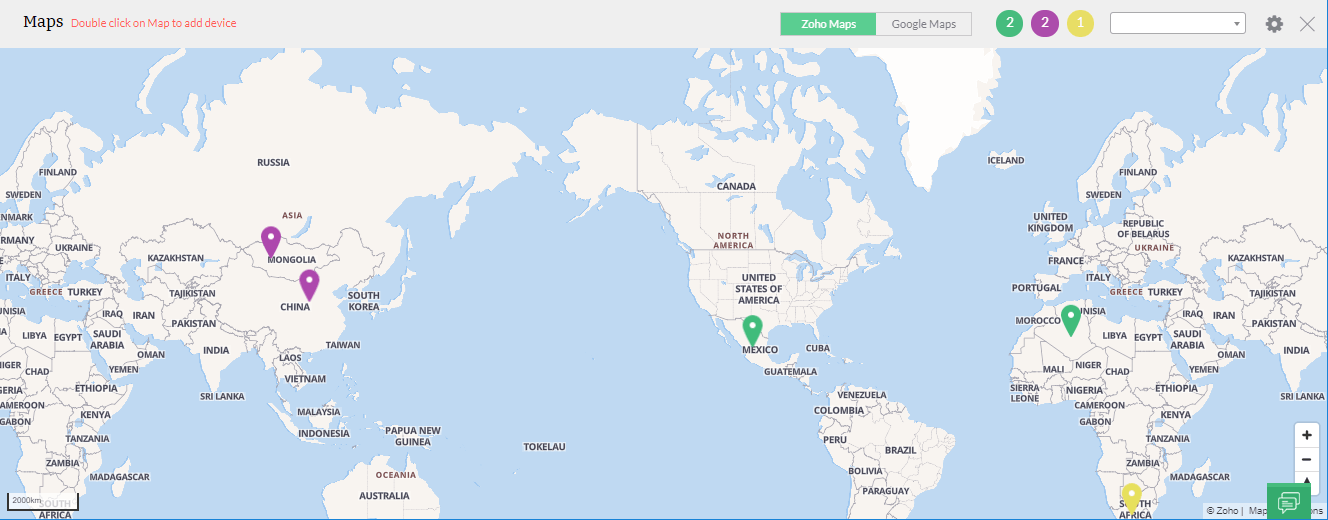
Using the maps feature in OpManager, you can represent the location of your servers and other network components geographically. These maps give you a clear view of the geographic distribution of the network and embed critical network devices to their real-world locations using Google Maps or Zoho Maps.
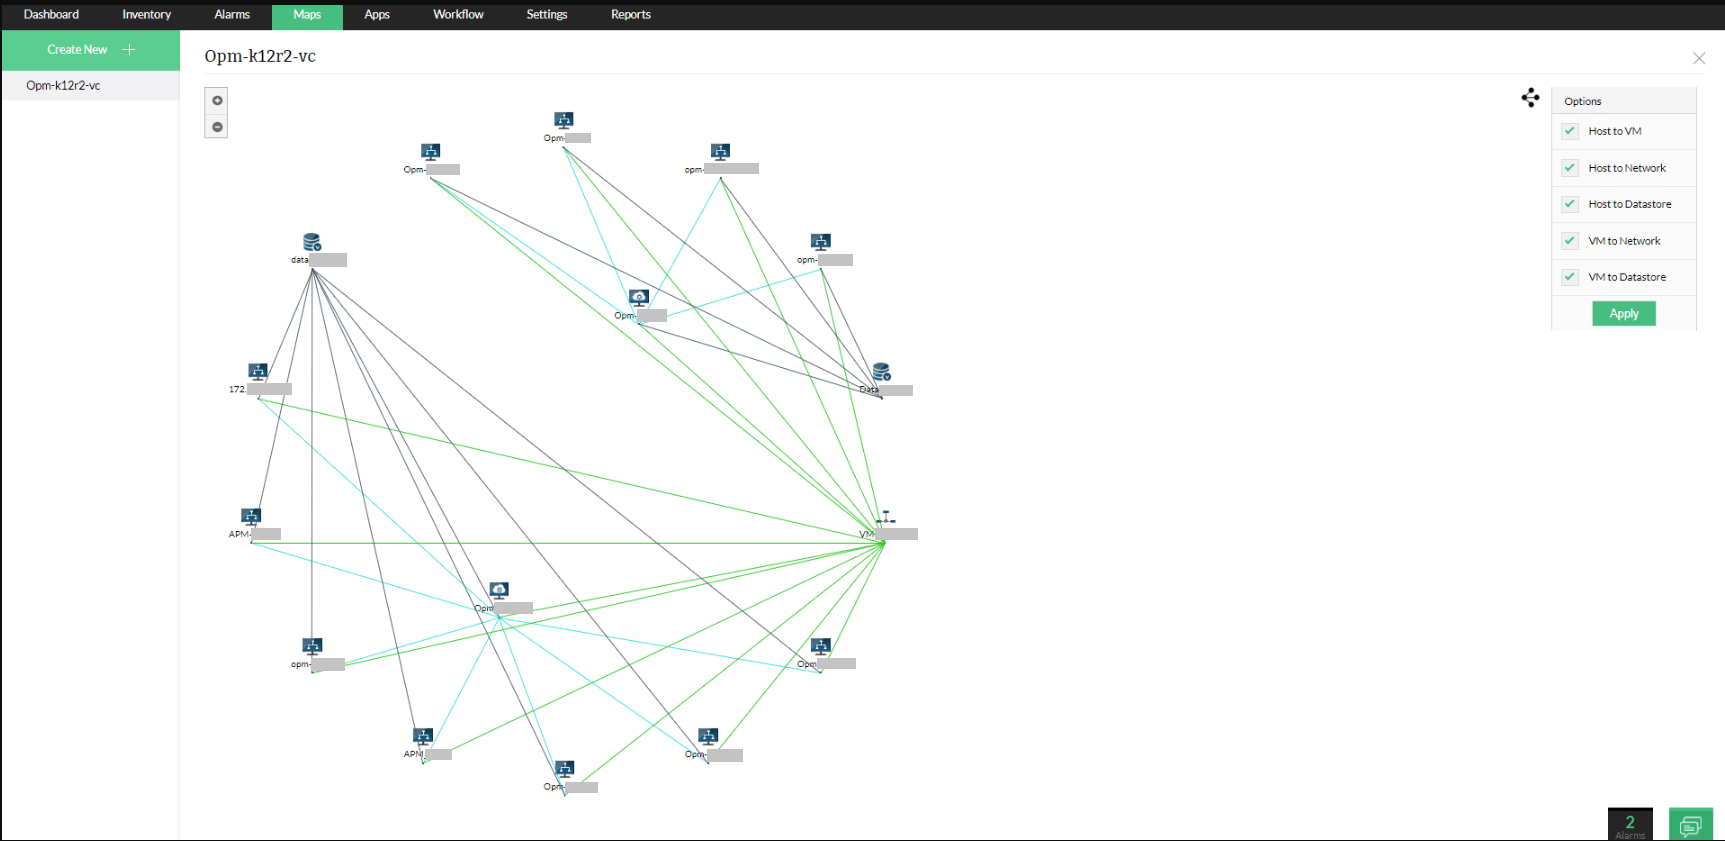
OpManager automatically creates network topology diagrams for VMware VCenter, VM's, HyperV and Xen hypervisors, and their guest and host machines.
3D floor views mapping in OpManager enables you to diagrammatically represent the servers and switches in your network. Server management is easier because the status of the devices can be easily determined from a glance. Green represents an active status, and red represents a faulty status.
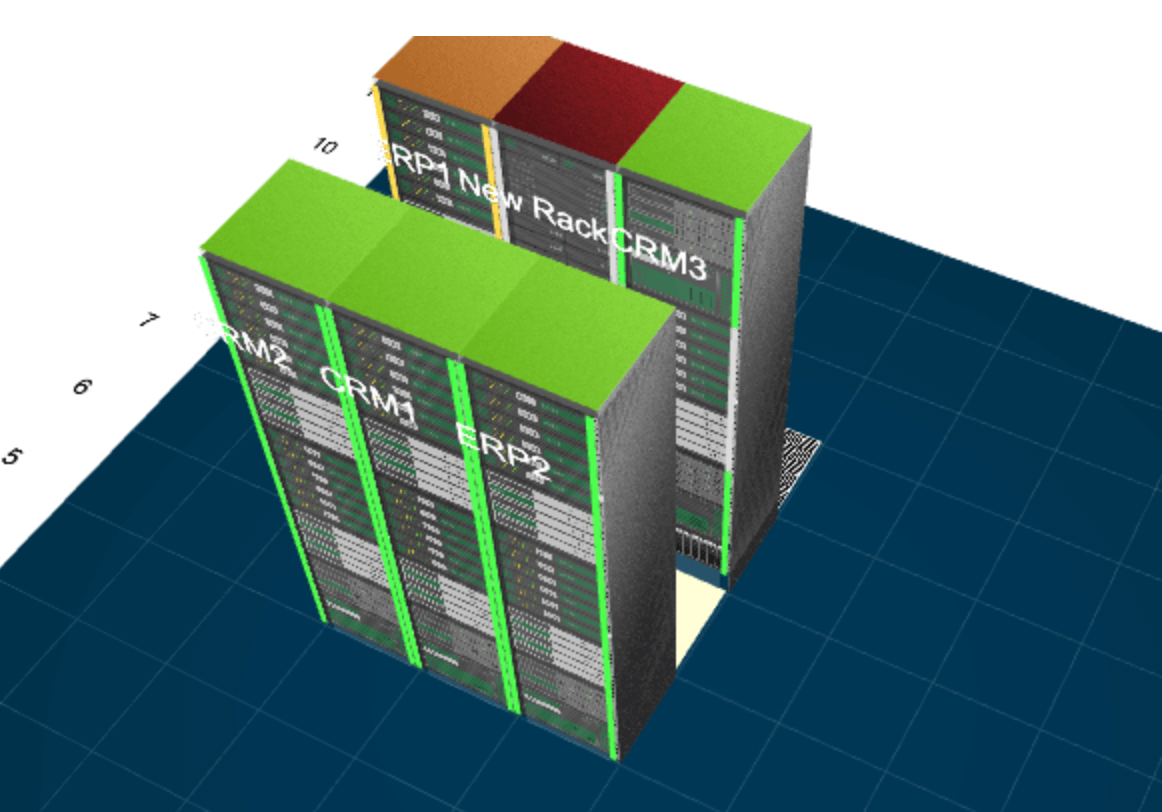
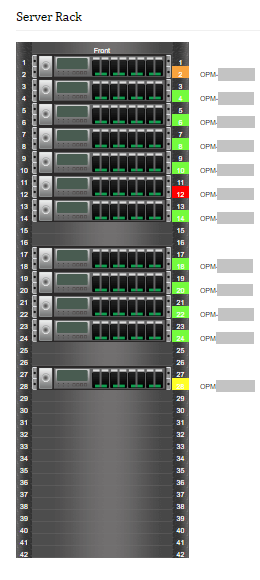
OpManager also provides a 3D rack view feature that enables you to create virtual racks replicating your actual server room. By doing so, you can visualize the racks in your data center in the exact physical arrangement. This makes life easier for network administrators to identify faulty devices and other issues.
Download our free, fully functional, 30-day trial today and learn everything about network diagram software by yourself or sign up for a personalized demo and talk with one of our product experts.
More than 1,000,000 IT admins trust ManageEngine ITOM solutions to monitor their IT infrastructure securely