ManageEngine recognized in the 2024 Gartner® Magic Quadrant™ for Digital Experience Monitoring. Get the full report

VPN monitoring tool

A virtual private network (VPN) helps establish a connection between remote users and private networks. These connections are secured by data encryption, where data flows between the device and the network via a shielded path called a VPN tunnel. VPNs significantly boost your device's privacy and provide global accessibility of resources.

VPN monitoring is the process of keeping an eye on critical metrics to maintain the integrity of the VPN connection and ensure it's robust. In addition, VPN monitoring ensures sensitive data gets transmitted across VPN tunnels without being exploited by intruders.

OpManager's VPN monitoring feature

OpManager's built-in VPN monitoring feature helps monitor VPN connections, track the health and performance of all VPN links, and monitor data transmission across VPN tunnels to proactively handle any impending roadblocks. OpManager supports site-to-site VPN monitoring, enabling you to monitor the private traffic across the branches of your organization. It also supports prominent leaders in the VPN infrastructure market such as Cisco, Fortinet, and Watchguard right out of the box.

Compromising on VPN monitoring can have many repercussions for a company, ranging from productivity loss and an adverse impact on revenue to jeopardizing confidential data or even the loss of loyal customers due to safety breaches.

  • Security breach and appropriation of vital information: Ineffective or no VPN monitoring can leave private networks vulnerable to unauthorized access, paving the way for data theft.
  • Overlooking traffic overloads and blocks in data traffic: Failure to address impending irregularities in VPN tunnels can lead to suspended connections, in turn effecting how the business functions.

In-depth analysis of VPN tunnels and related entities

OpManager is capable of monitoring up to 100 VPN tunnels from single firewall device. During a firewall device's discovery process, OpManager identifies its VPN tunnels and begins monitoring their availability and bandwidth. When the firewall discovery is complete, a dedicated tab with real-time monitoring stats will also be available in the device's snapshot page:

  • Host Name: The device hostname or IP address of the end device to which this firewall device has an established tunnel.
  • Status: The current availability status of the host. This is updated by polling the device at regular intervals.
  • Rx/Tx Traffic: Traffic transmitted and received through the VPN tunnel.
  • Encryption and Hashing: The encryption and hashing algorithms for secure communication.
  • Action: Option to either Enable/Disable the Tunnel monitoring.

VPN Monitoring Tool - ManageEngine <span class=

The snapshot page also shows a dedicated VPN Details widget displaying the number of currently active Hosts, the number of Tunnels Up or Down, and Bandwidth for Rx and Tx traffic between the end pair. These metrics are updated based on the monitoring interval configured, keeping you updated on the recent health of tunnels.

VPN Monitoring Tool - ManageEngine <span class=

Real-time performance monitoring and troubleshooting alerts

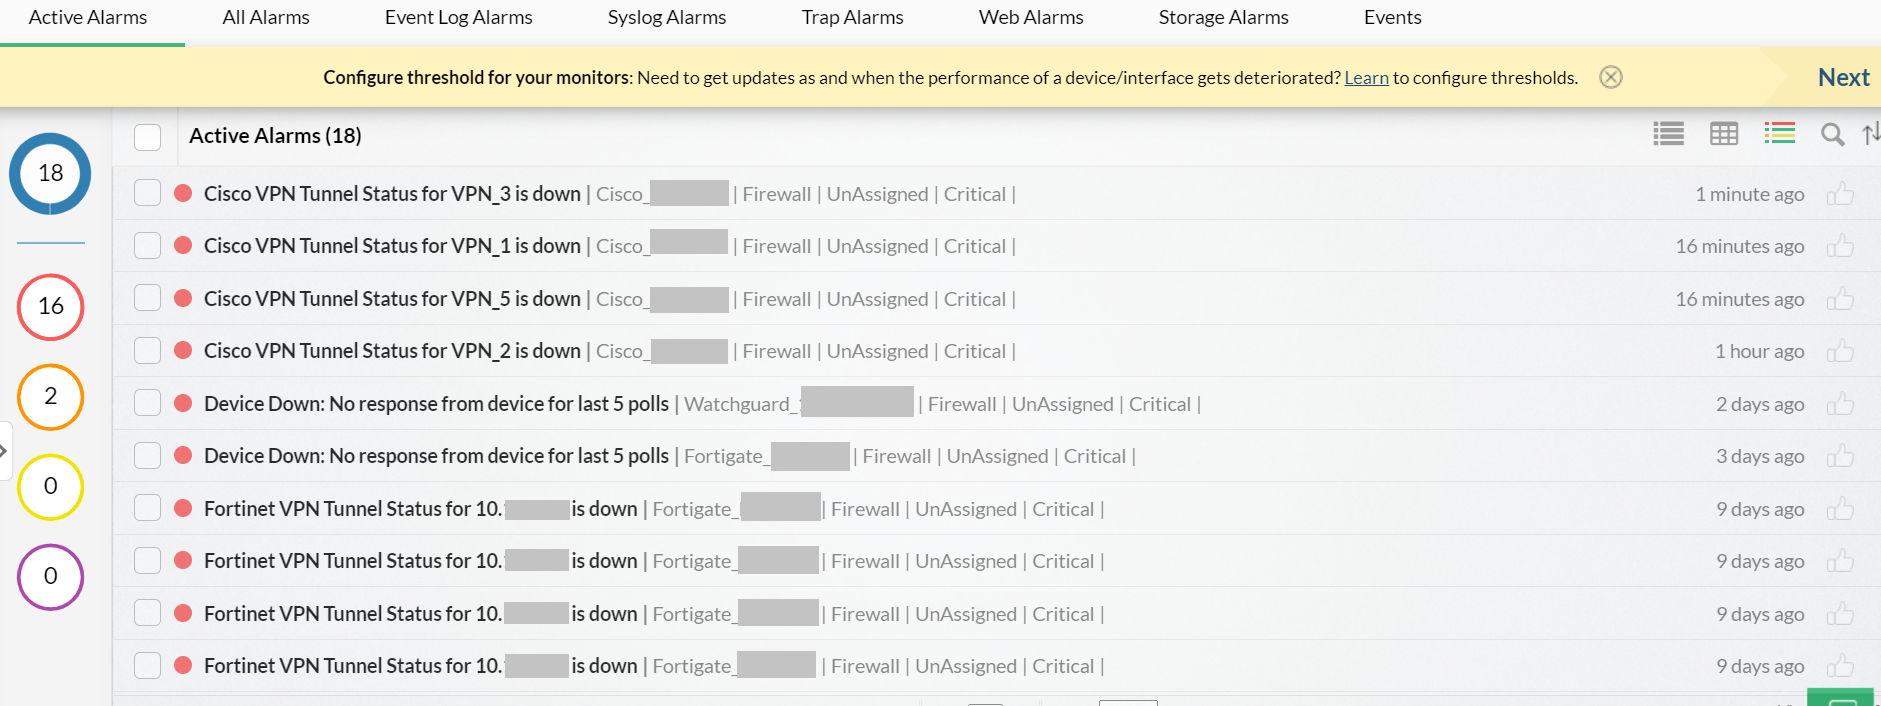
OpManager sends down alerts when the monitored VPN tunnel is unavailable or if the total traffic violates the configured threshold. These alerts can be leveraged for more effective troubleshooting.
VPN Monitoring Tool - ManageEngine <span class=

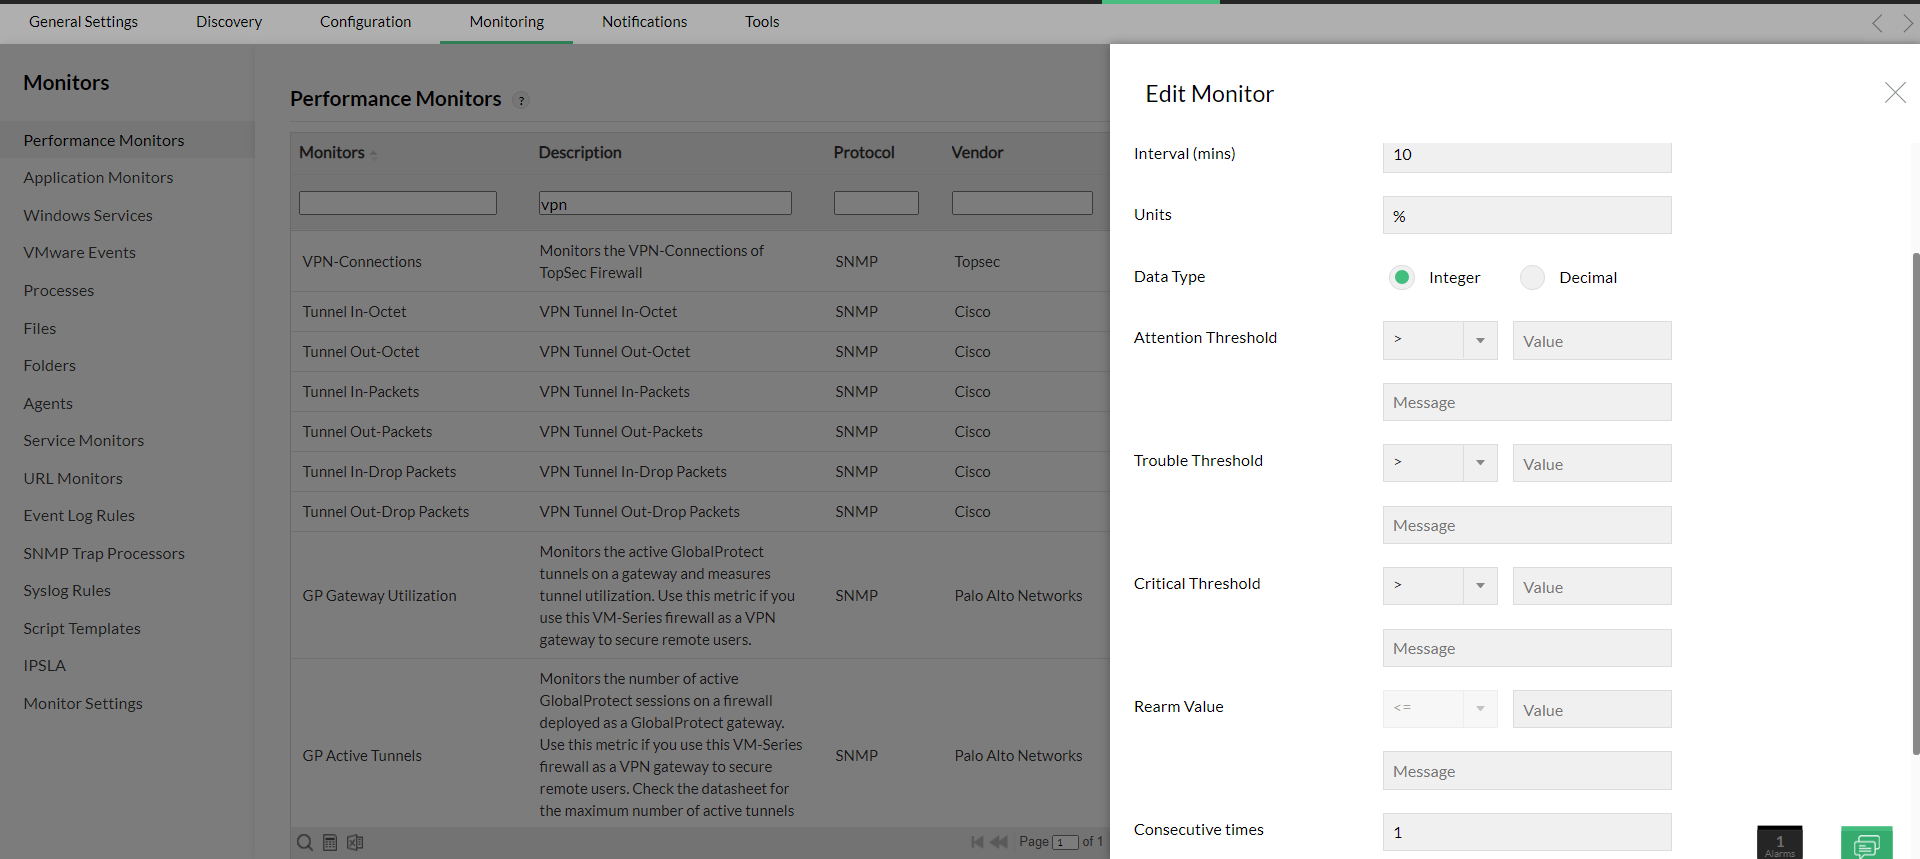
OpManager automatically associates a set of VPN-specific performance monitors to the firewall device once it's discovered in OpManager. These monitors help you obtain device-specific data regarding VPN performance and traffic. You can further modify the thresholds for the respective monitors according to your environment, and keep an eye on the overall performance to check if the metric is under control. Listed below is a set of default performance monitors that come built-in with the firewall devices of their respective vendors.

Vendor Default performance monitors added during discovery
Cisco
  • Cisco VPN Tunnel Status: The availability (up/down) status of the tunnel.
  • Cisco VPN Tunnel Uptime: The duration the tunnel is alive.
  • Cisco VPN Tunnel - Rx Bytes: The incoming data received through the tunnel, in bytes.
  • Cisco VPN Tunnel - Tx Bytes: The outgoing data sent through the tunnel, in bytes.
Fortinet
  • Fortinet VPN Tunnel Status: The availability (up/down) status of the tunnel, in bytes.
  • Fortinet VPN Tunnel Uptime: The duration the tunnel is alive.
  • Fortinet VPN Tunnel - Rx Bytes: The incoming data received through the tunnel, in bytes.
  • Fortinet VPN Tunnel - Tx Bytes: The outgoing data sent through the tunnel, in bytes
Watchguard
  • Watchguard VPN Tunnel Status: The availability (up/down) status of the tunnel.
  • Watchguard VPN Tunnel Uptime: The duration the tunnel is alive.
  • Watchguard VPN Tunnel - Rx Bytes: The incoming data received through the tunnel, in bytes.
  • Watchguard VPN Tunnel - Tx Bytes: The outgoing data sent through the tunnel, in bytes.

VPN Monitoring Tool - ManageEngine <span class=

You can also associate notification profiles for high priority devices so network administrators receive notifications via SMS, email, etc. when there's a problem with a VPN's tunnel health.

Custom dashboards for VPN widgets

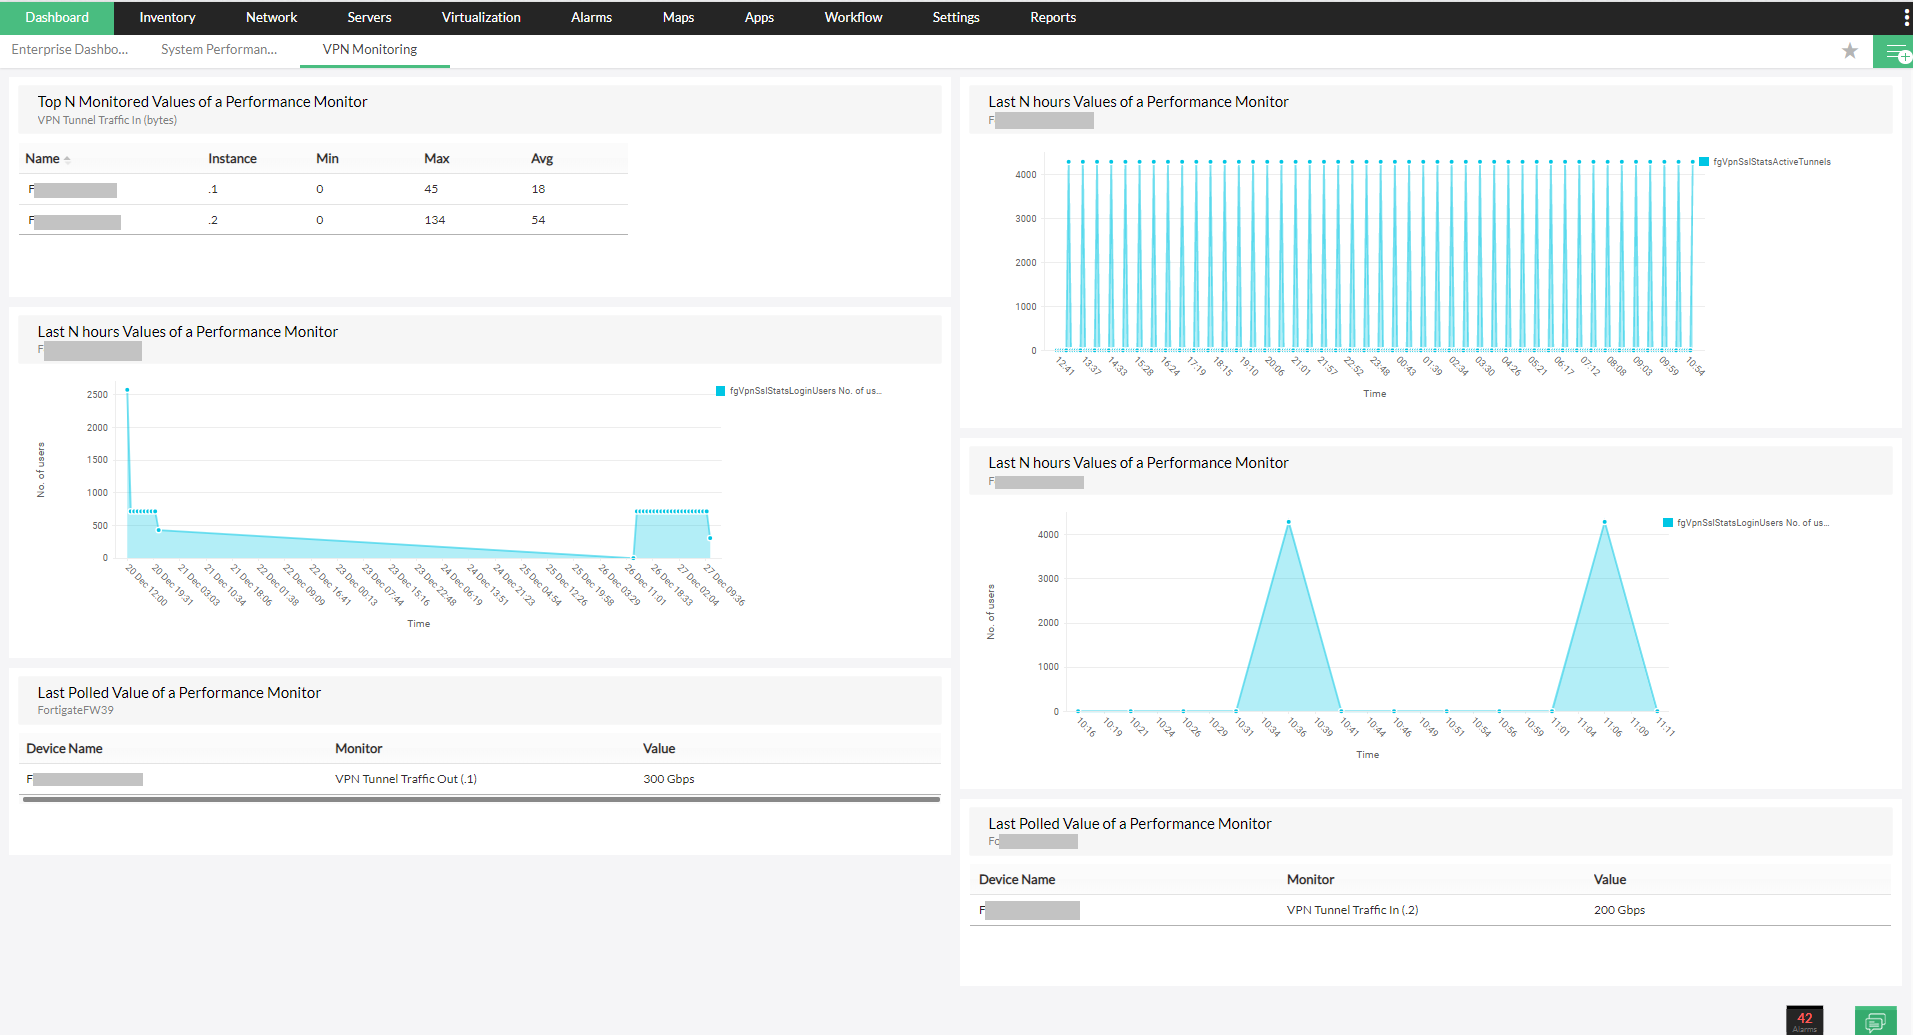
Say goodbye to moving between multiple windows to fetch crucial data; with OpManager, you can monitor all business-critical VPN metrics on one screen. Create customized dashboards that can accommodate VPN widgets such as VPN tunnel monitoring, VPN traffic monitoring, and other widgets you feel are critical to your business, helping you draw inferences with ease. All you have to do is create a custom dashboard, select the desired performance monitors, add them to your dashboard, and you're good to go.
Monitor VPN Reports - ManageEngine <span class=

Monitor VPN Reports - ManageEngine <span class=

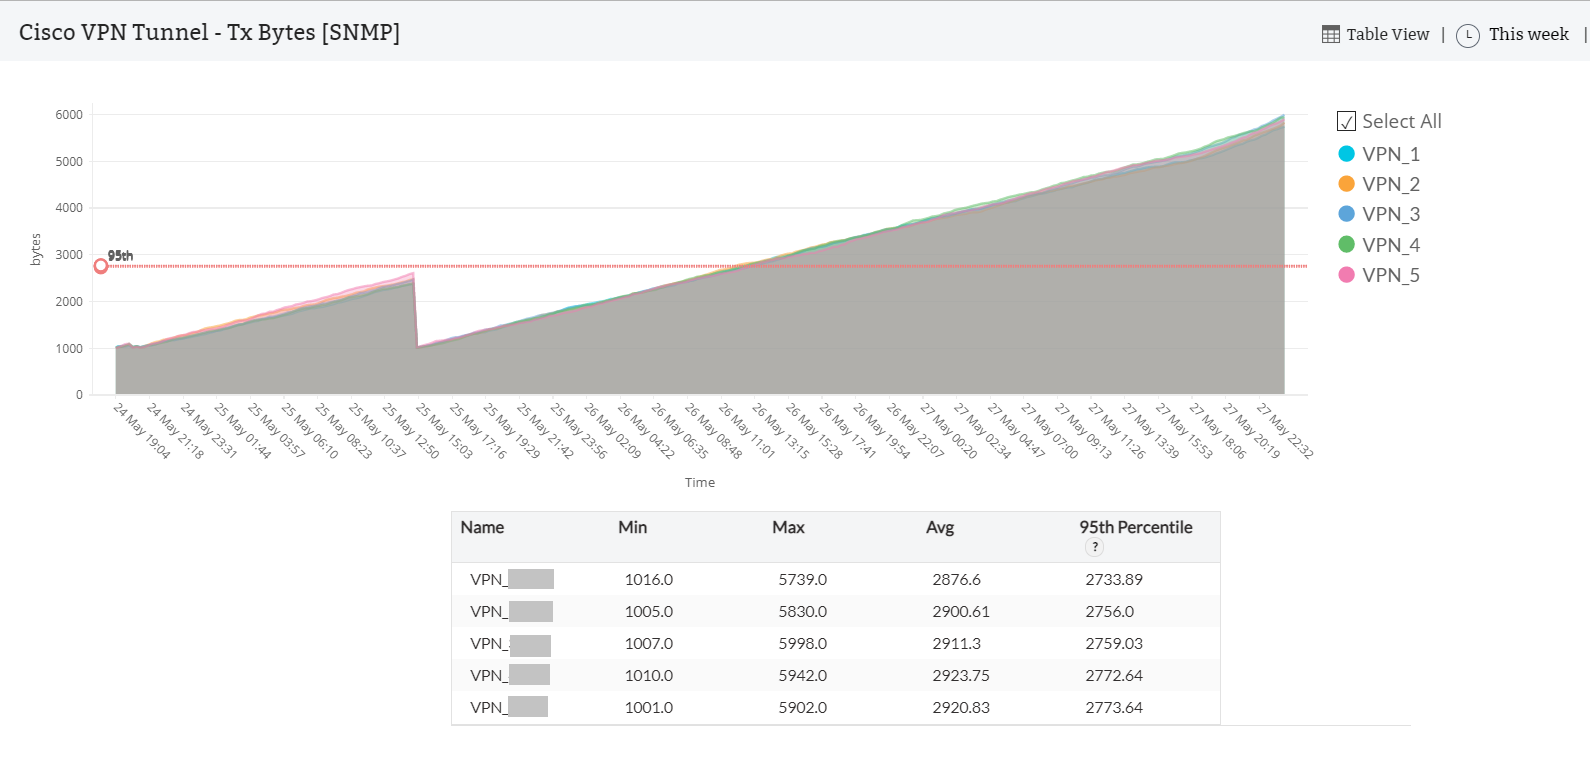
OpManager offers graphical and tabular representations of data sets to help gauge and visualize data seamlessly and derive better inferences. You can drill down further into the individual metrics graphs, or view all charts on the same page to gain a holistic view of the current trends.
VPN Tunnel Reports - ManageEngine <span class=

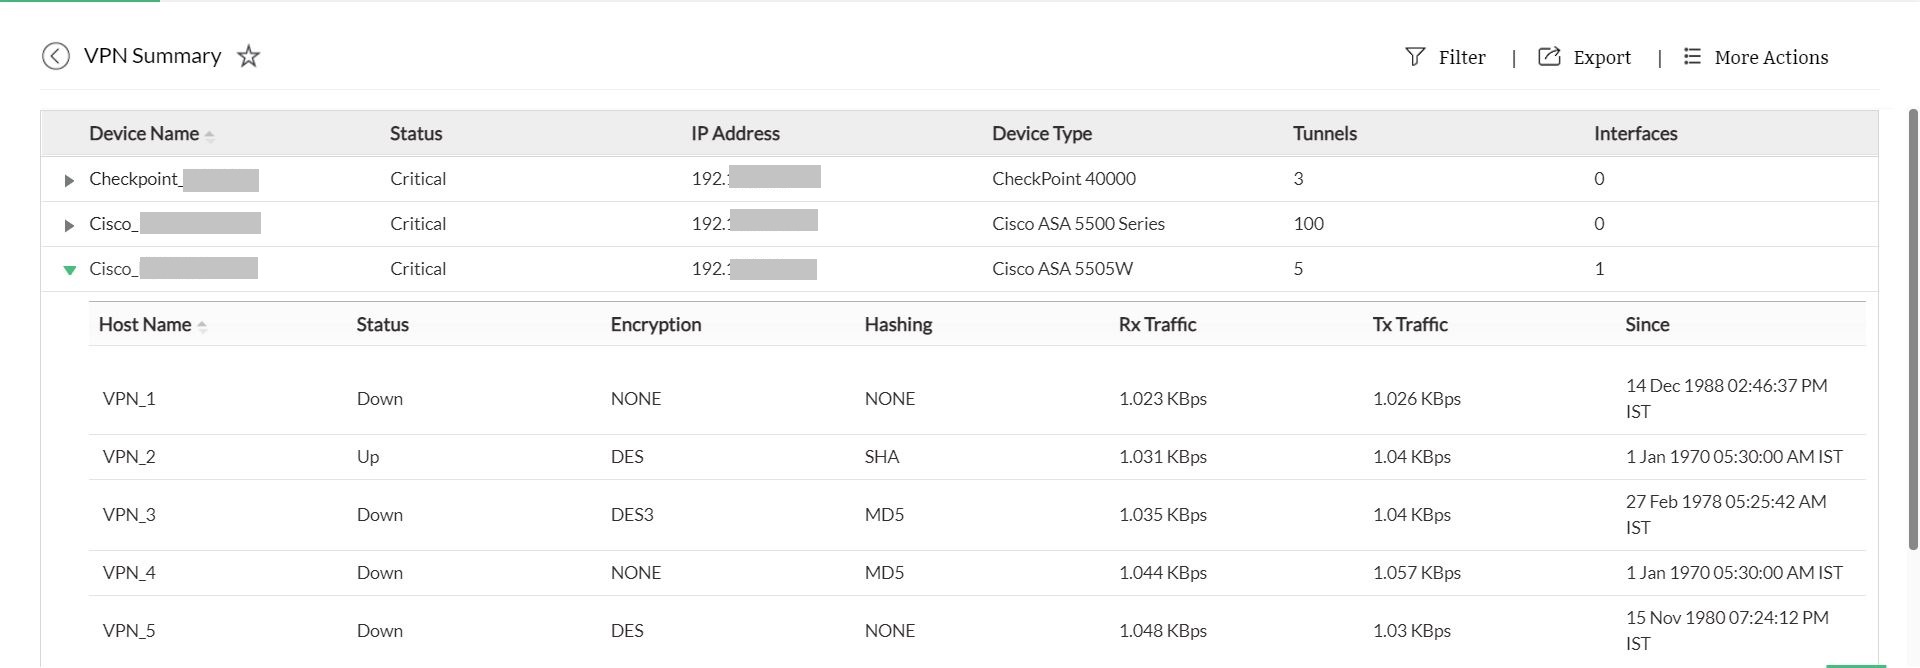
To study trends over longer intervals, OpManager generates reports that include stats obtained over a longer period of time. The VPN Summary report provides personalized information on overall VPN performance and availability. You can schedule or export these reports to other formats like PDF or XLS, and also generate custom reports as per your organization's needs.
VPN Tunnel Reports - ManageEngine <span class=

Additional VPN specific performance monitors

In addition to the default monitors associated to firewall devices, OpManager comes with a set of performance monitors exclusive to VPN monitoring. You can associate these monitors to the required devices directly or via Device Templates, and start monitoring the health and performance of VPN tunnels.

Vendor Performance monitors available in OpManager
Cisco
  • VPN tunnel IN-Bytes data: The total number of octets received by the IPsec Phase-2 tunnel.
  • VPN tunnel OUT-Bytes data: The total number of octets sent by the IPsec Phase 2 tunnel.
  • VPN tunnel status: The status of the management information base (MIB) table row.
  • VPN session count: The number of currently active sessions.
  • Active web VPN sessions: The number of currently active web VPN sessions.
  • SSL VPN connections (switched virtual circuits, also known as SVCs, or AnyConnect): The number of currently active SVC sessions.
  • The number of currently active SVC sessions
  • Tunnel In-Octet
  • Tunnel Out-Octet
  • Tunnel In-Packets
  • Tunnel Out-Packets
  • Tunnel In-Drop Packets
  • Tunnel Out-Drop Packets
  • Total Clientless only WEB VPN sessions
  • Active Web VPN sessions
  • Peak concurrent Webvpn sessions
Fortinet
  • VPN SSL tunnel uptime: The uptime of SSL VPN tunnels (in seconds) from the time of VPN reboot.
  • VPN bytes received: The number of bytes received in the tunnel since installation.
  • VPN bytes sent: The number of bytes sent in the tunnel since installation.
  • VPN tunnel traffic in: The number of incoming bytes of L2 traffic through this tunnel since it was established.
  • VPN tunnel traffic out: The number of outgoing bytes of L2 traffic through this tunnel since it was established.
  • Active VPN SSL tunnels: The current number of active SSL tunnels in the virtual domain.
  • Active SSL VPN Users: The current number of users logged in through SSL-VPN tunnels in the virtual domain.
Barracuda
  • VPN tunnels count: The number of live client-to-site VPN tunnels.
  • VPN tunnel status: Monitors the status of VPN tunnels.
ZyXEL
  • VPN bandwidth: Monitors the VPN bandwidth.
  • VPN tunnel Rx packets: Total packets received through the tunnel.
  • VPN tunnel Tx packets: Total packets transmitted through the tunnel
CheckPoint
  • VPN decryption errors: Monitors VPN decryption errors
  • VPN peer tunnel state: Monitors the VPN tunnel's status.
Juniper
  • Concurrent VPN tunnels: The number of concurrent pulse IPsec and NC users.
Palo Alto Networks
  • GP Gateway Utilization: Monitors the active GlobalProtect tunnels in a gateway, and measures tunnel utilization. Use this metric if you use this VM-Series firewall as a VPN gateway to secure remote users.
  • GP Active Tunnels: Monitors the number of active GlobalProtect sessions in a firewall deployed as a GlobalProtect gateway. Use this metric if you use this VM-Series firewall as a VPN gateway to secure remote users.

You can also use OpManager's Firewall Analyzer add-on to get VPN usage trends and block hostile IPs from accessing your VPNs.

For more information on how OpManager can aid in your VPN network monitoring efforts, try out a 30-day free trial, or register for a free demo.


 Pricing  Get Quote