Reports Settings
This section explains the report settings that can be configured in Applications Manager as well as data retention settings. To access this section, click the Report Settings link under the Settings tab. The section consists of the following inner tabs:
Reports Settings
Availability Reporting:
- Treat Monitor Groups as Application Cluster (Availability based on default calculation): By default, the Monitor Group availability will be shown as down (0%) if any one of the monitors in the Monitor Group is down.
- Treat Monitor Groups as Services Group: By selecting this option, you can calculate Monitor Group availability based on the services availability. For eg., if there are 5 monitors in a Monitor Group and one monitor is down, Monitor Group availability is calculated as 80% available (one monitor - 20%).
- Do not include Scheduled Maintenance and Unmanaged state in availability reporting: If you select this option, you can exclude scheduled maintenance and unmanaged state data from availability reports.
Note: Refer here to learn more about Availability report calculation.
Attributes Reporting:
- Plot attributes report with Bar chart: If you select this option, you can view the attributes report in the form of bar charts.
- Plot attributes report with Line Graph: If you select this option, you can view the attributes report in the form of line graphs.
- Show Plot shape in graph: By selecting this option, you can see the dots / blobs in the line graphs.
- Show Poll Data Custom Time dropdown: By selecting this option, you can enable the Show Polled Data and Custom Time dropdowns in all the reports and allows you to choose time periods for the same.
- Moving Average: A simple moving average is the unweighted mean of the previous n data points. For example, a 10-day simple moving average of attribute value like CPU utilization is the mean of the previous 10 days' CPU Utilization value. By selecting this option, you can add moving average graph in the 7, 30 graphs of the various monitors.
Forecast Reporting: Allows you to enable the use of Machine Learning techniques for more reliable reporting.
Dashboard Reporting: Allows you to choose the PDF orientation of the dashboard report files.
Export: Allows you to choose the date and time format for appending with the file names of the exported report files.
Note:
- From Applications Manager version 177200, the Time Format for Export option is supported, allowing you to append the selected time format to exported report file names.
- From Applications Manager version 175800, the option to enable or disable Machine Learning for Forecast Report generation has been removed, as the Machine Learning algorithm will be used by default.
Data Retention
To plot graphs and generate reports, Applications Manager collects data from the monitors at regular intervals. By default, Applications Manager aggregates the performance data into hourly data at the end of each hour. The hourly data thus calculated will be aggregated into daily data at the end of each day. The aggregated data will be used in graphs and reports.
Applications Manager allows you to maintain the database with the required data. By default, the detailed data will be maintained for six hours max, the hourly data for 90 days and the daily data for 365 days. After the specified period, the database will be cleaned up automatically. Learn more
To configure your own settings for database retention, follow the steps given below:
- Click on the Settings tab.
- Under 'Reports Settings' section, click Data Retention tab.
- Enter the number of days for which hourly statistics should be maintained.
- Enter the number of days for which daily statistics should be maintained.
- Enter the number of recent alarms that should be maintained in the alarm database.
- Enter the number of days for which hourly statistics of disk and servlet attributes should be maintained. By default, it will be maintained for 30 days.
- Enter the number of days for which the health history data should be maintained.
- Enter the number of days for which the downtime history data should be maintained.
- Enter the number of days for which the event count data should be maintained.
- Save the changes.
Note: Unsolicited traps will be maintained for a default value of the last 5 Hours.
Logo Settings
Click on the Logo Settings tab to configure the report logo settings. By default, presentation reports display the ManageEngine Applications Manager Logo in the upper left corner.
- Click on Change to change the logo.
- Click on the Browse button and select an Image.
- Click on Save to set the logo.
The user can change Logo in pdf and Excel Report. The ideal image size should be about 262x54 pixel dimensions and not more than 100 KB. You can upload any file in gif/jpg/png formats.
Customize the logo in Applications Manager’s dashboard
You can update the Applications Manager dashboard and login page with your company’s logo directly through the web client.
To update the Header logo:
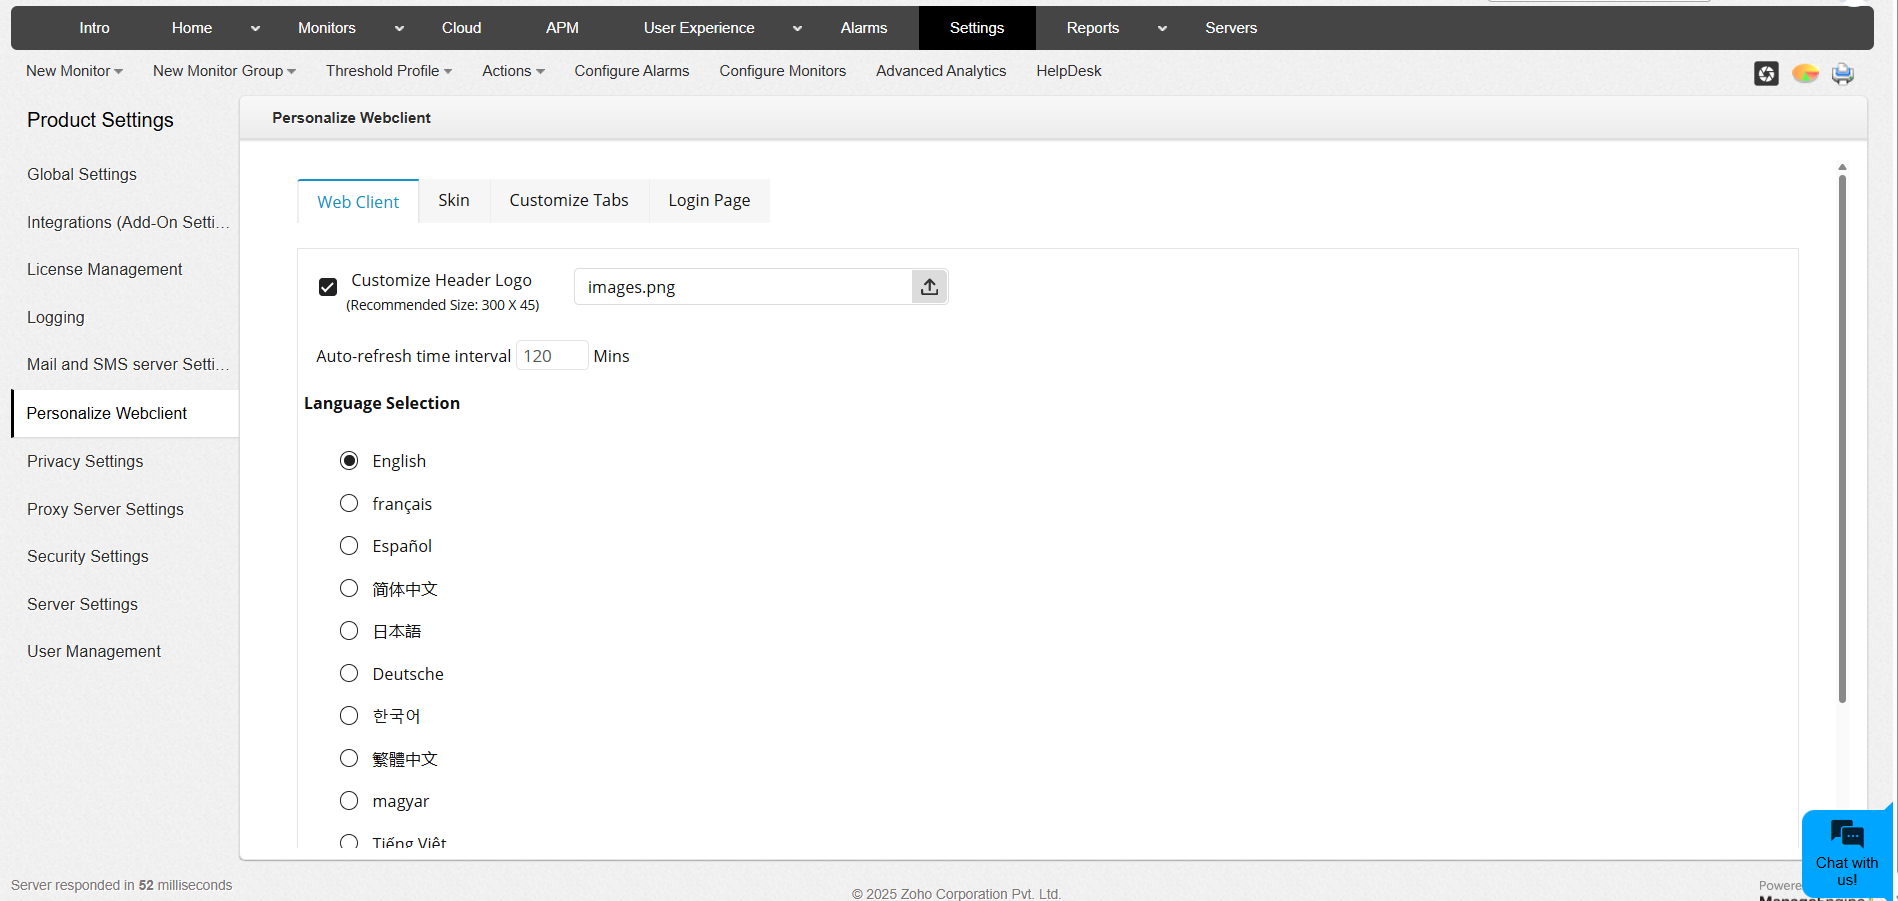
- Navigate to Settings → Personalize Web Client → Web Client.
- Select the checkbox for Customize Header Logo.
- Upload your custom logo image. Supported formats include .png, .jpg, and .jpeg.
- Click on Apply. The uploaded image will replace the default Applications Manager logo in the respective section of the product.

To update the image in the Login page:
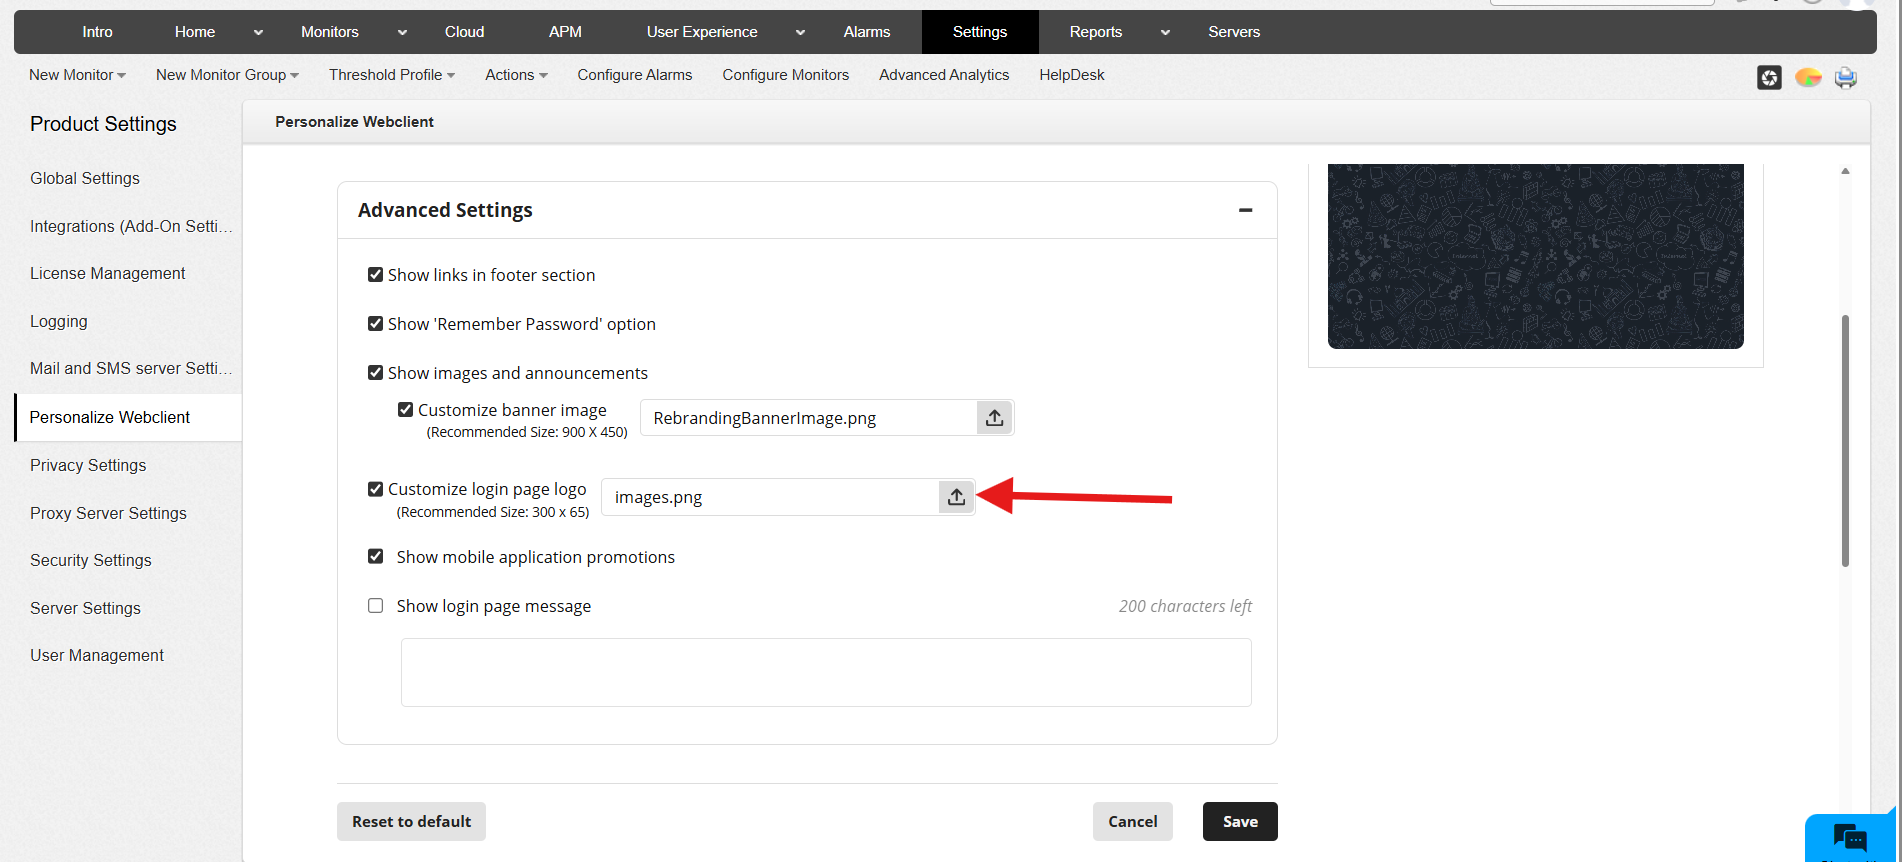
- Navigate to Settings → Personalize Web Client → Login Page.
- Click on the Advanced Settings folder.
- Select the checkbox for Customize login page logo.
- Upload your custom logo image. Supported formats include .png, .jpg, and .jpeg.
- Click on Save. The uploaded image will replace the default Applications Manager logo in the Login page of the product.

To update the header logo or login page logo for build versions earlier than v177100, follow these steps:
- Copy the required image files (for example, header-logo.gif and loginpage-logo.gif) into the directory working\images.
- Create or update the OEM.txt file and place it in working\conf\OEM.txt. Add the following entries:
am.header.logo=header-logo.gif
am.loginpage.logo=/images/loginpage-logo.gif
- Restart the build for the changes to take effect.
Export Data Protection
You can enable password protection for reports sent as PDF attachments or published as report links (configured via
Schedule Reports) by selecting 'Enable' for the
PDF Password or
File Access Password options respectively. Click
Modify Password to configure a password and select where the updated password should be sent to:
- All users - Updated Password should be sent to all admin users and the list of emails which where configured while scheduling reports.
- Admin users - Updated Password should be sent to all admin users only.
- No users - Password will be updated in database and mail with the password will not be sent to any user. However, as always, during Report Scheduleing, the scheduled reports mail and a password mail will be sent to users assoicated with that specific Report Schedule.
Clicking Save will send out the password to the selected users.
Thank you for your feedback!

