How to troubleshoot common Windows application errors and crashes
Last updated on:In this page
- What is an application error or crash?
- Format of Event ID 1000
- How and when application errors and crashes occur
- Probable causes of application errors and crashes
- Common troubleshooting tips for fixing application errors and crashes
- Investigating Event ID 1000 for troubleshooting application errors
- Troubleshooting application crashes or errors with EventLog Analyzer
- Getting alerted in real-time for application crashes
When critical applications like Adobe Photoshop crash on a system, it becomes essential for system administrators to analyze the reason for the crash and fix the problem. Often, Windows application crashes record error messages in the form of logs that can be viewed and analyzed using Event Viewer.
This article explains how to analyze the root cause of application errors and crashes through event log analysis.
What is an application error or crash and the common event IDs associated with them?
An app crash or error refers to an unexpected malfunction that disrupts the normal operation of a software program. This can manifest in several ways, and Windows utilizes different event IDs to categorize these incidents based on the nature of the application. The table below elaborates on the different types of application errors and the event IDs associated with them:

Format of Event ID 1000
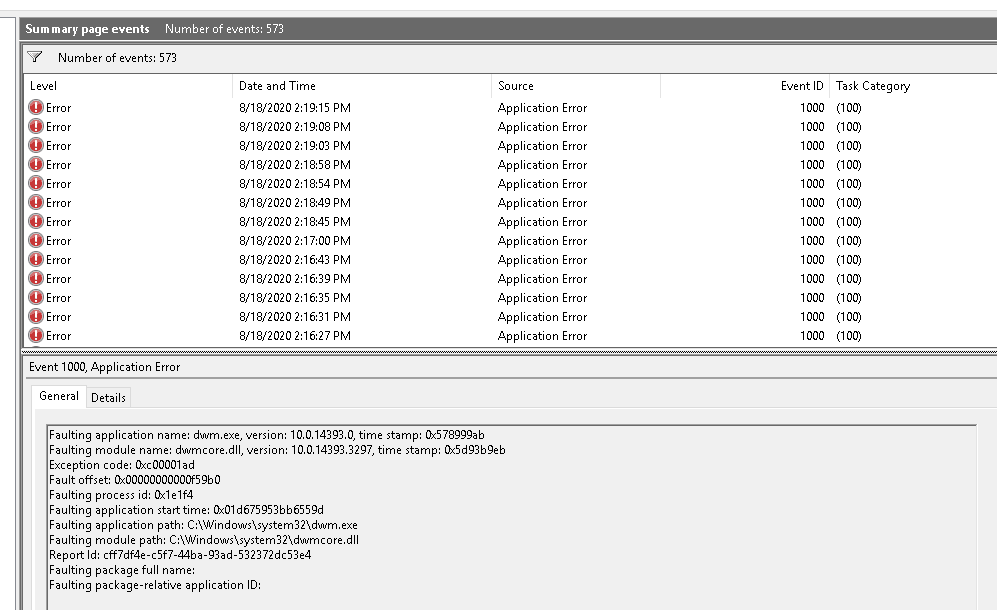
The following example explains how to interpret an Event ID 1000 entry:
- Event ID 1000 entry indicates that the application "dwm.exe" version "10.0.14393.0" crashed.
- The fault occurred in the module "dwmcore.dll", which is version "10.0.14393.3297".
- The Exception code "0xc00001ad" signifies a serious error within a program, often related to memory corruption or access violations.
- The Fault Offset "0x00000000000f59b0" provides a memory address within the module where the error occurred.
- The Faulting Process ID "0x1e1f4" shows the unique ID of the process at the time of crash.
- The Faulting Application Start Time "0x01db75953bb6559d" marks when the application was launched.
- The Faulting Application Path and Faulting Module Path give the full paths to the executable and module involved in the crash, respectively.
- The Report ID is a unique identifier for this specific error report, useful for tracking and diagnostics. This detailed information helps diagnose and address the underlying issues causing application crashes.
How and when application errors and crashes occur
Application errors and crashes occur when unforeseen issues disrupt the normal operation of a program, leading to abrupt termination or error messages that disrupt productivity. These issues often point to underlying problems such as insufficient system resources, software bugs, or conflicts with system components. For instance, memory leaks, where a program fails to release memory properly, can gradually degrade performance and eventually cause a crash. Similarly, conflicts with system resources like conflicting software libraries or device drivers can lead to instability. Understanding these root causes is crucial for developers and IT administrators to implement effective troubleshooting and preventive measures, ensuring smoother application performance and enhanced user experience.
Frequent application crashes often stem from operations that exceed the device's hardware limits or encounter unexpected conditions in the environment. Diagnosis typically involves parsing error messages, analyzing system logs for pertinent events, and implementing corrective actions to restore application functionality and stability. This process might include optimizing resource usage, debugging code to identify and resolve software flaws, or configuring system settings to mitigate environmental factors impacting performance.
Some of the possible causes include insufficient resources, software bugs, conflicting applications, and corrupt application files.
Probable causes of application errors and crashes
Hardware issues:
- Insufficient storage: Applications operate effectively utilizing a defined amount of system resources. Crashing can occur if the application uses more resources than actually available. This results in generating application errors and crashes (Event ID 1000).
- Environmental factors: The performance and reliability of hardware can be influenced by external conditions such as power surges, outages, or extreme temperatures. For example, applications that write data to a disk might encounter corrupted files if a sudden power outage occurs, leading to crashes when the program attempts to access the compromised data.
Software issues: In rare cases, corrupted software or software conflicts can lead to unexpected application errors and crashes.
- Software bugs: Unexpected behaviors and crashes in software can be attributed to faults in coding or logical weaknesses inherent in the application itself. These issues might arise during the development process or result from modifications to the components or environment of the program. For instance, if an application fails to manage properly and release allocated memory, it can progressively consume memory resources until system performance is degraded and eventually crashes.
- Corrupted data: Unexpected shutdowns, disk failures, or malware infections can all result in critical file corruption. This might lead to an erratic app behavior.
- .NET Framework: .NET Framework issues commonly cause application crashes due to compatibility mismatches between required and installed framework versions, memory leaks from inadequate management, thread deadlocks in concurrent programming, insufficient exception handling, inefficient garbage collection, and dependency conflicts with other frameworks or libraries. These issues can lead to instability, resource depletion, and unexpected program terminations. Mitigating these risks involves thorough testing, monitoring, and ensuring compatibility between the application and the .NET Framework versions, along with implementing robust coding practices and timely updates provided by Microsoft.
Common troubleshooting tips for fixing application errors and crashes
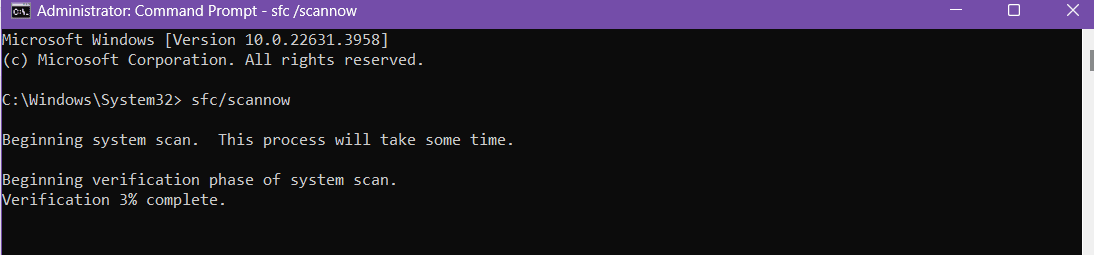
- Run system file checker (SFC): SFC, a commonly used native tool, has been available since Windows 2000 for all Windows NT-based operating systems. This tool scans the corrupted system files and repairs them.
- Open Command Prompt as an administrator and run SFC.
- Right-click on Command Prompt and select Run as administrator.
- In the elevated Command Prompt, type sfc/scannow command and enter.
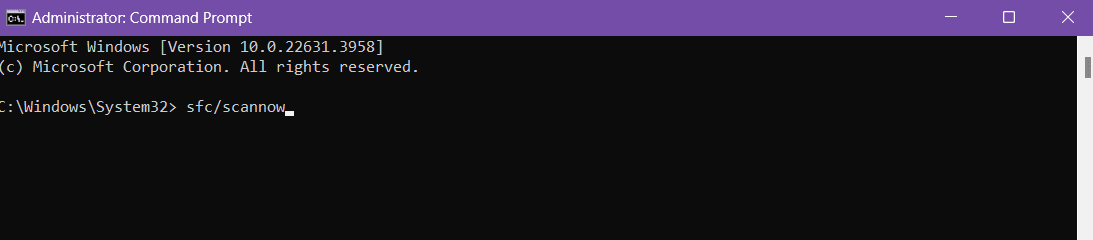
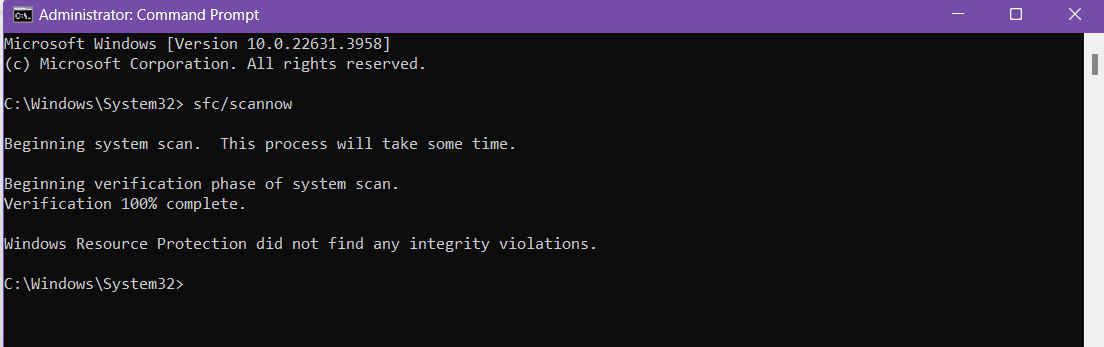
- Open Command Prompt as an administrator and run SFC.
- Perform a clean boot: A clean boot is a troubleshooting technique used in the Windows OS to isolate the cause of startup problems or software conflicts. This method starts your Windows system with a minimal set of programs and drivers required for its functioning. Performing a clean boot enables you to identify if there is a problem with corrupted system files or conflicting background programs.
- Check for latest Windows/software updates: Windows operating systems can occasionally encounter issues where certain services and modules do not function correctly. To address the Event ID 1000 application error, consider upgrading Windows to the latest build.
For the Windows 10 OS, perform these steps:
- Navigate to Start and select Settings.
- Choose Update & Security.
- Click on Check for updates.
- Windows will then search for available updates and proceed to download them.
- Once downloaded, restart your computer to complete the installation process.
This update procedure aims to resolve underlying system inconsistencies that might contribute to the application error, ensuring a smoother operation of your Windows environment.
- Reinstall Microsoft .NET Framework: For most Windows apps, .NET Framework is an essential component. If the previously mentioned steps do not work, try reinstalling the.NET Framework.
- For Windows 10 and 11:
- Turn off .NET Framework features using Control Panel:
Open the Control Panel on your Windows system and go to Programs > Programs and Features. Click on Turn Windows features on or off in the left pane. In the Windows Features dialog, locate the .NET Framework options. Uncheck the boxes for the versions of .NET Framework you wish to turn off. Click OK to apply the changes, which will disable the selected .NET Framework features. - Uncheck .NET Framework versions:
Ensure that you uncheck all the versions of the .NET Framework that you need to reinstall. This action will remove the current installation of these versions from your system, allowing for a clean reinstallation. - Download and reinstall from the Microsoft website:
The latest version of the .NET Framework. Navigate to the .NET Framework download page, select the appropriate version for your system, and download the installer. - Run the downloaded installer:
Once the download is complete, run the installer. Follow the on-screen instructions to install the .NET framework. After installation, restart your computer if prompted to ensure that all changes take effect and the new installation is properly configured.
- Turn off .NET Framework features using Control Panel:
- For Windows 7 and older versions:
- Uninstall .NET Framework:
Open the Control Panel and navigate to Programs > Programs and Features. Locate Microsoft .NET Framework in the list of installed programs. Select the version you want to uninstall and click Uninstall. Follow the prompts to remove the .NET Framework from your system. - Download and reinstall.NET Framework:
Visit the official Microsoft website and navigate to the .NET Framework download page. Choose the appropriate version for your operating system and download the installer. - Run the downloaded installer:
Once the download is complete, double-click the installer file to run it. Follow the on-screen instructions to complete the installation of .NET Framework. Restart your computer if prompted to ensure the installation is fully applied and functional.
- Uninstall .NET Framework:
- For Windows 10 and 11:
Investigating Event ID 1000 for troubleshooting application errors
This section describes how you can investigate Event ID 1000 using Event Viewer.
- Step 1: Accessing Event Viewer:
Open Event Viewer by pressing "Win + R", typing "eventvwr.msc", and hitting Enter. Alternatively, search for "Event Viewer" in the Windows search bar. In the Event Viewer window, expand Windows Logs and select Application. - Step 2: Locating Event ID 1000 using filters:
Click Filter Current Log... in the Actions pane. In the filter dialog, enter "1000" in the Event IDs field and click OK. This filters the logs to show only events with ID 1000. - Step 3: Analyzing Event ID 1000:
Double-click on an event with ID 1000 to view details. Check the Faulting application name to identify the problematic application, review the Exception codes for error specifics, and read the Event description for additional context like module names and process IDs. - Step 4: Gathering additional context:
Using correlation, examining the events before and after the crash.
Often, system administrators or security professionals want to analyze the application crashes happening across all Windows devices from a single and central console. This involves aggregating event logs from sources across the network in a centralized location to facilitate comprehensive analysis. Log management tools such as ManageEngine EventLog Analyzer, help IT professionals centrally collect, analyze, correlate, search, and securely archive log data from across network.
Troubleshooting application crashes or errors with EventLog Analyzer
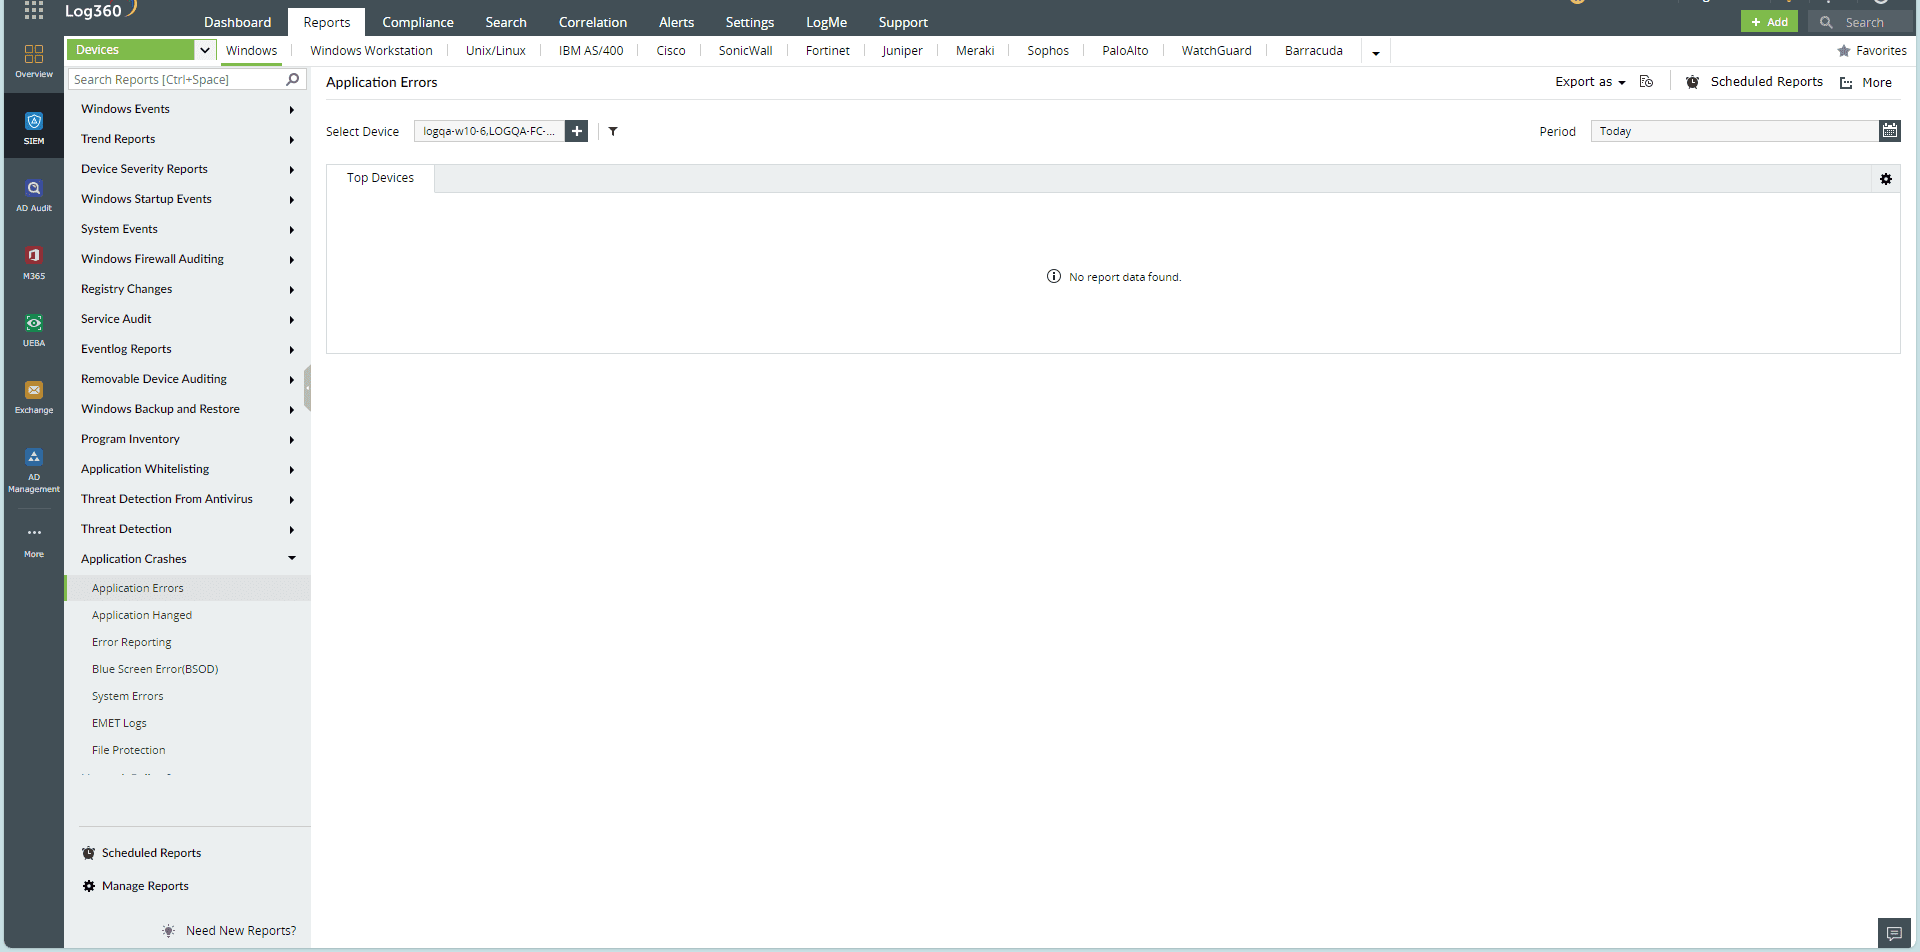
EventLog Analyzer provides you with out-of-the-box reports that deliver you with granular visibility into Windows crashes and errors.
Once you configure the Windows devices for monitoring using this solution, it provides visibility into how the app crashed. EventLog Analyzer differentiates application crashes from hangs and helps you investigate the events that occurred before and after the crashes through an intuitive analytics dashboard.
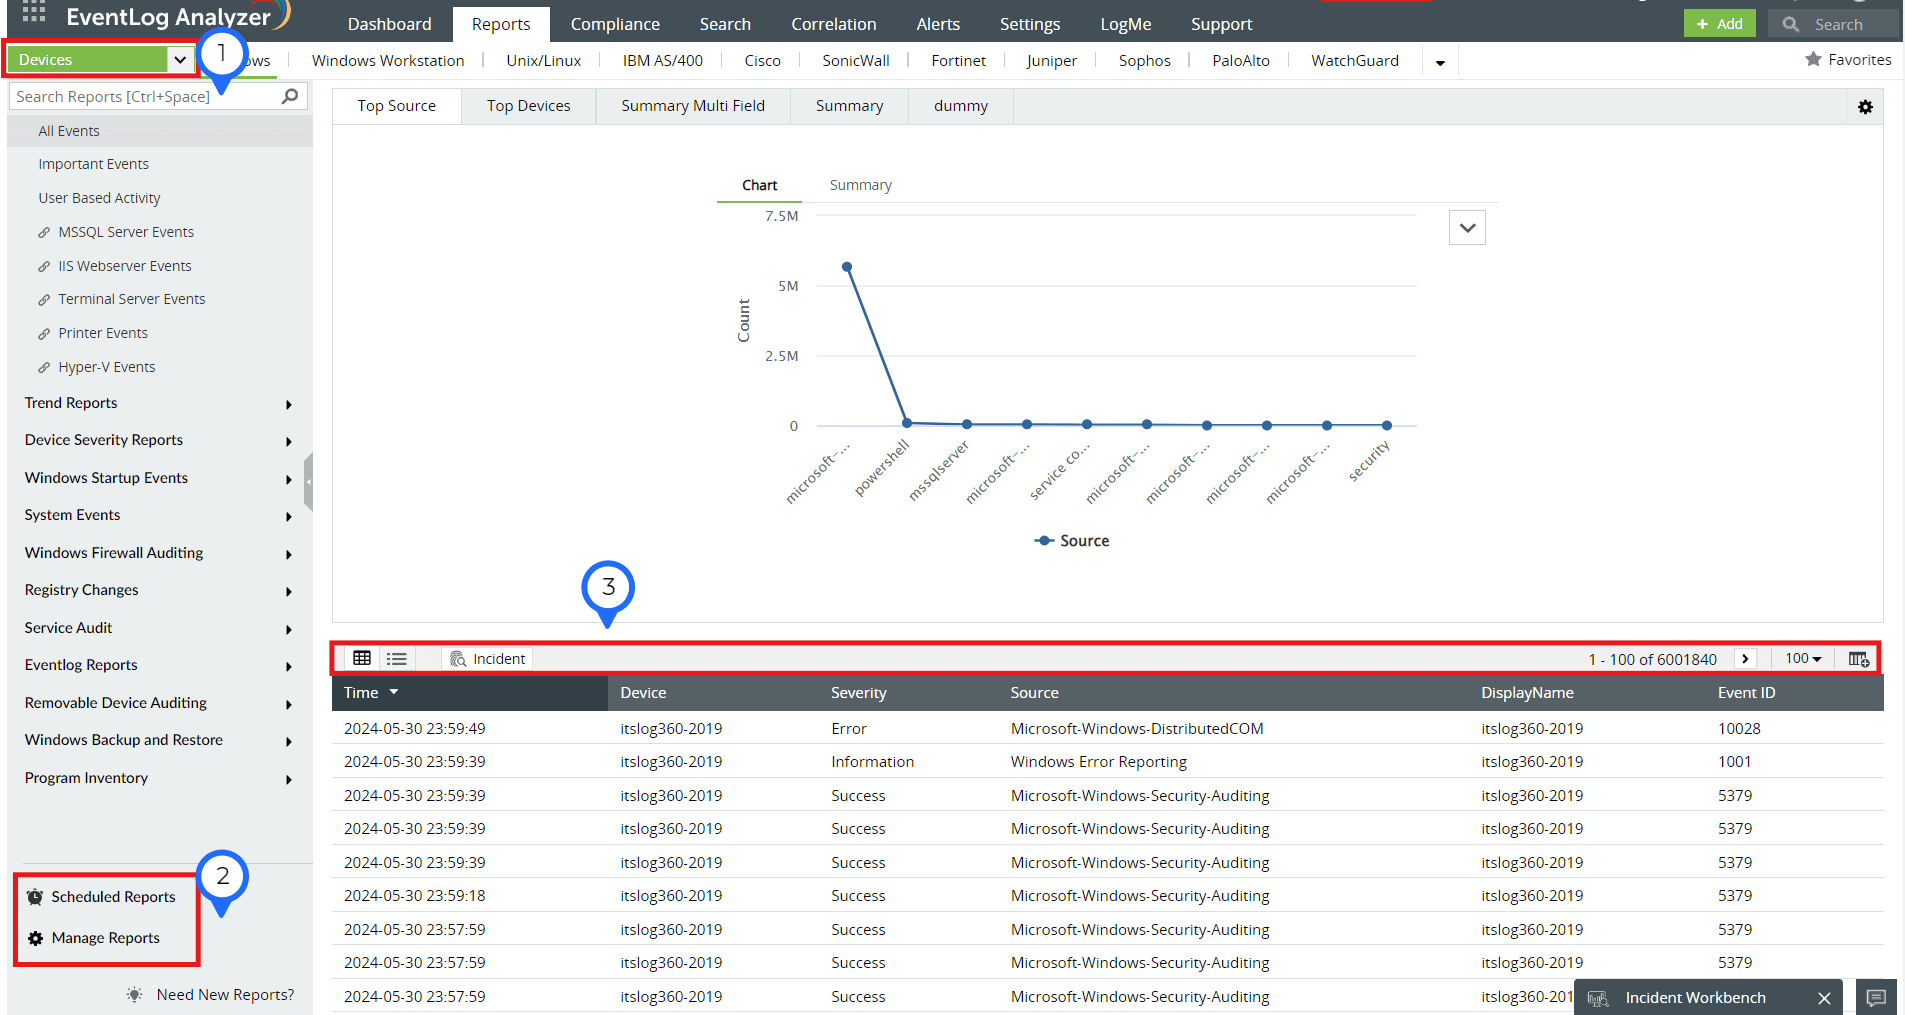
- The reports dashboard provides insights on the event ID that you can find under Reports > WIndows > Application crashes.
- By scheduling reports, you can customize reports to be delivered to you periodically for consistent monitoring. Each report can contain different fields such as devices, time, severity, etc.
- This row enables you to customize your view (tabular/list view), specify the display of incidents by adding or removing columns/rows, and categorize the incidents according to your needs.
Device Summary dashboard to analyze pre and post crash events
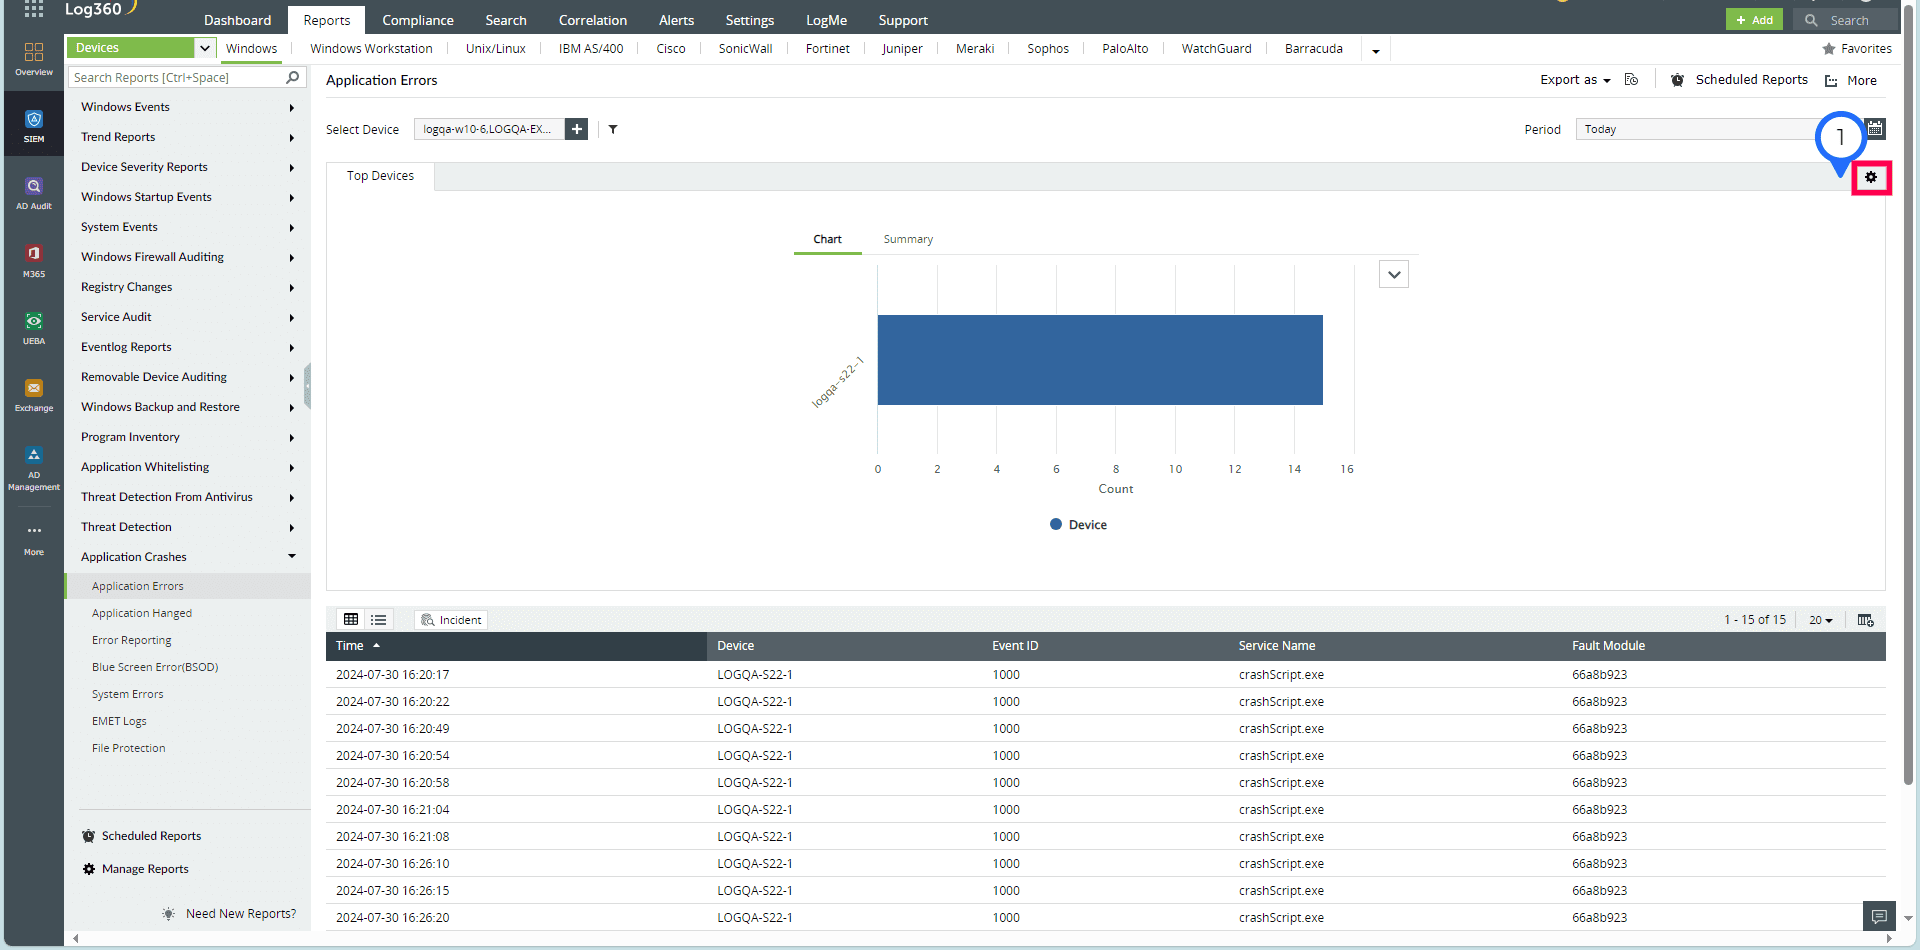
As we can see, there have been multiple crashes on a particular device in quick succession. This indicates that you need to analyze further to find the root cause.
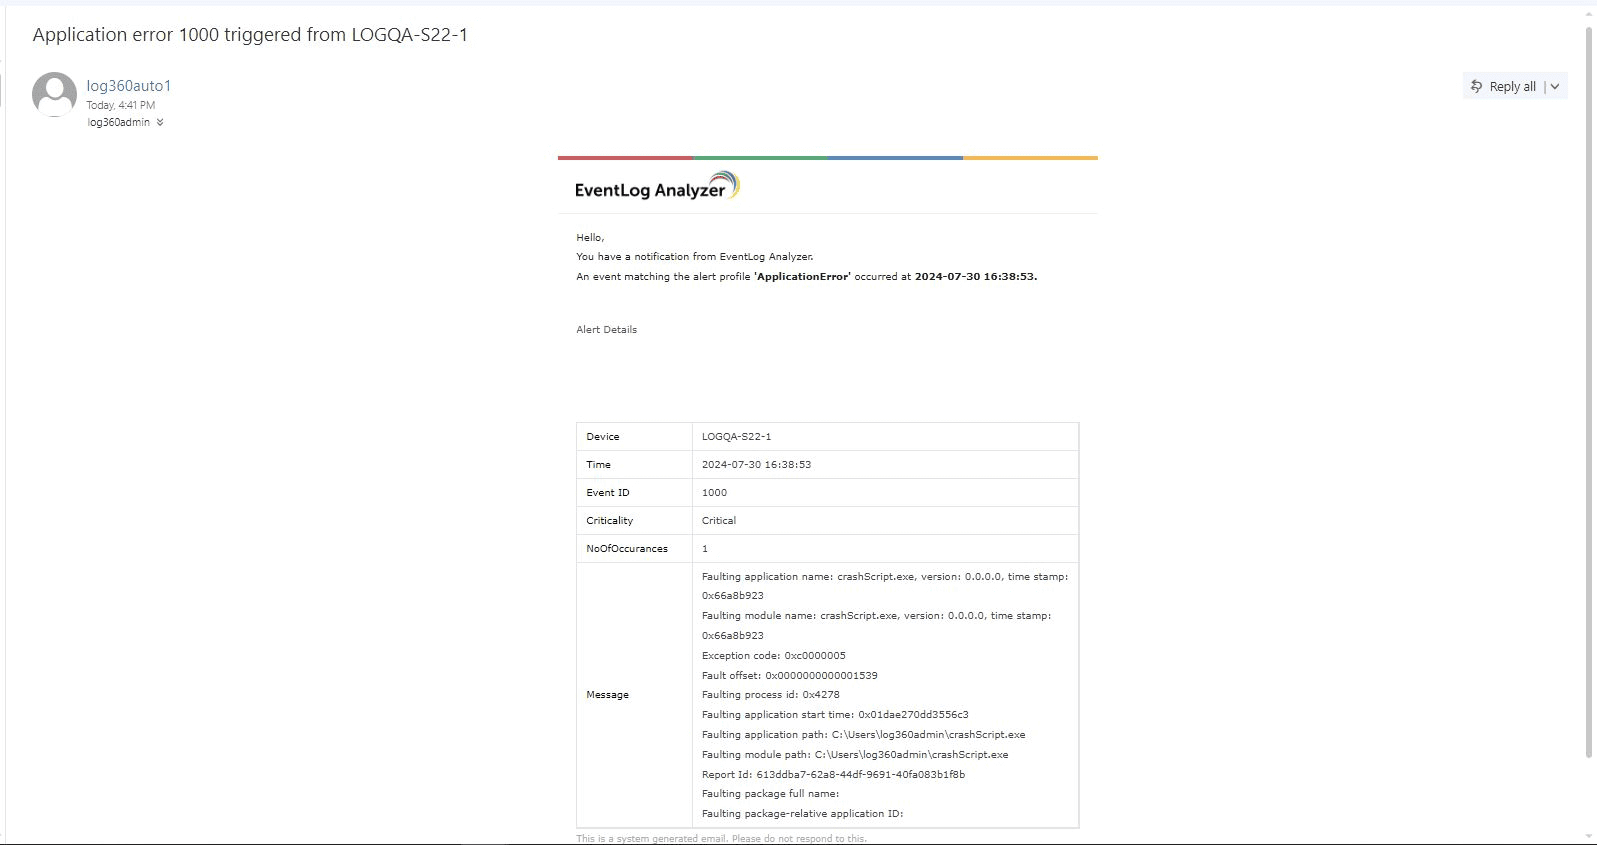
Getting alerted in real-time for application crashes
EventLog Analyzer comes with a predefined alert profile to notify you if critical applications or services crash. The solution also allows you to customize the alert criteria, such as setting up the alert only for specific devices, enabling a smart threshold for the alert so that you instantly detect more crashes than usual, and more. The detailed information provided by these alerts facilitates prompt investigation and resolution.
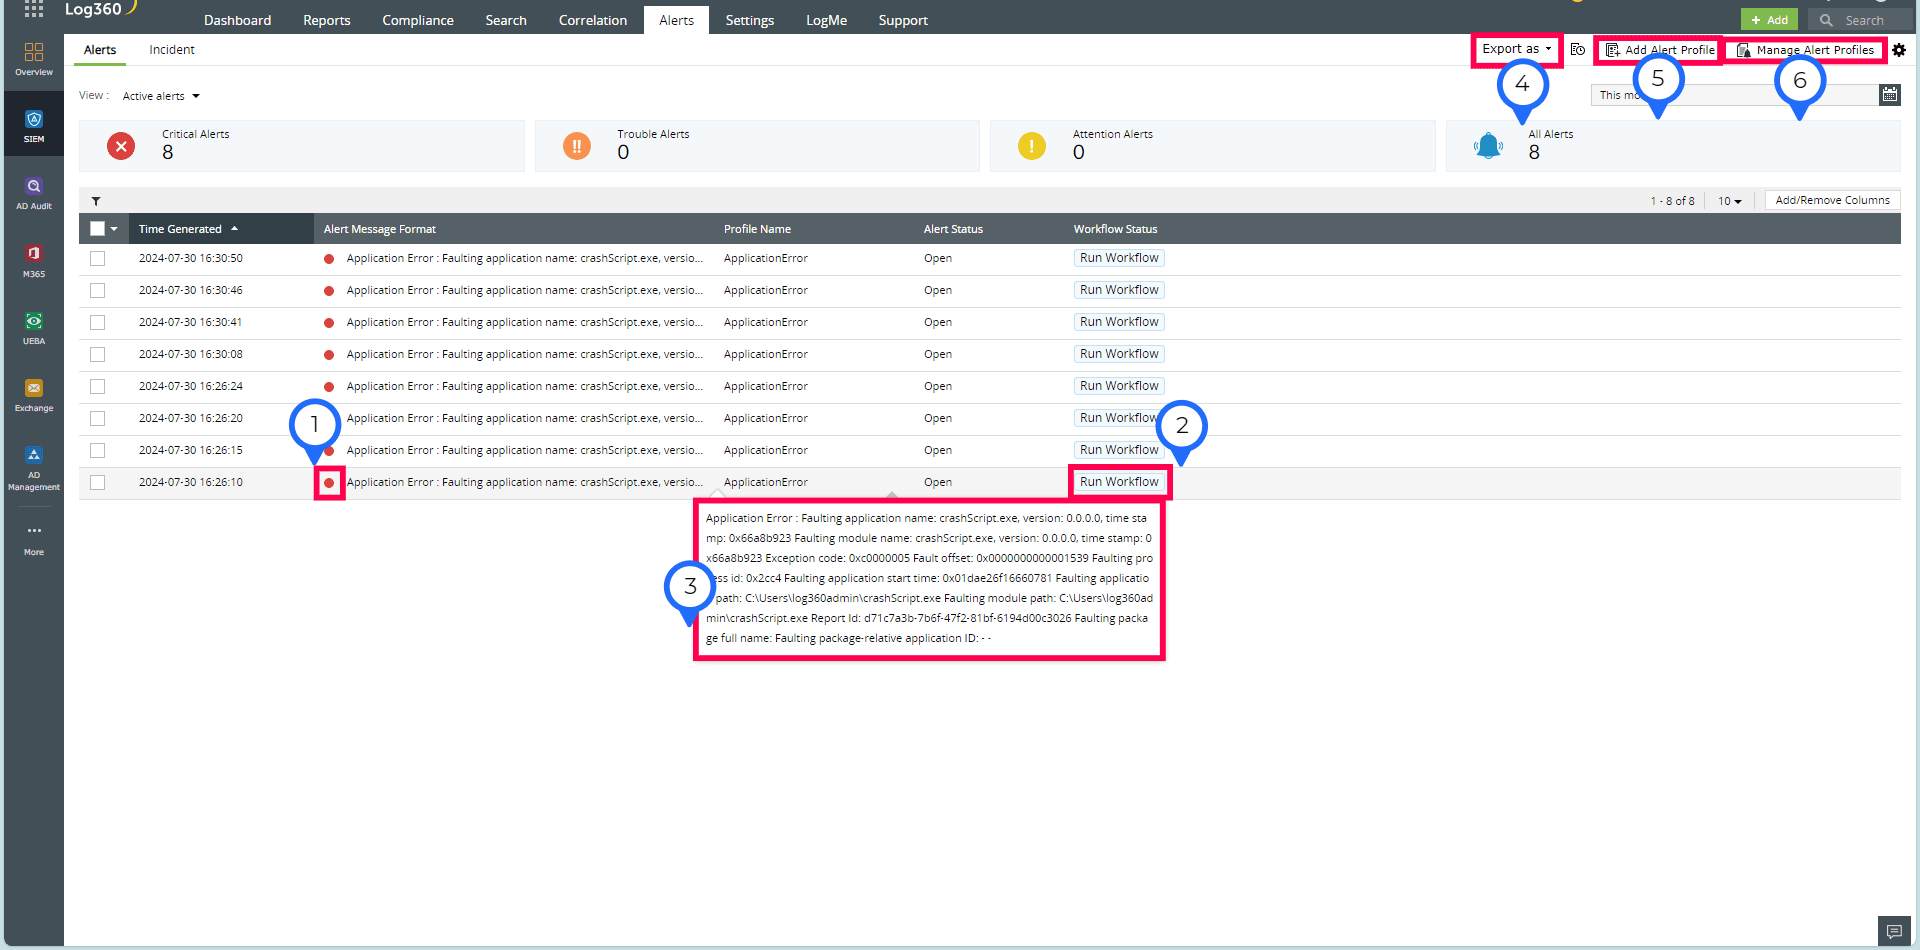
- This section indicates the severity level of the alert, highlighting the urgency and importance of the situation. Severity levels help categorize alerts based on their impact to enable quicker prioritizations and responses.
- After generating the workflow, you can initiate a sequence of predefined actions tailored to mitigate and control the impact of the detected event.
- You can obtain a detailed summary of the detected anomaly, including essential information needed to understand it, as well as receive a clear overview so you can provide a swift analysis and deliver accurate decision-making .
- For documentation and further analysis, you can export the alert details in CSV or PDF formats. These exports are useful for reporting purposes, record-keeping, and sharing information with stakeholders.
- You have the flexibility to add and customize alert profiles to suit your specific monitoring needs.
- You can also manage your alert profiles efficiently by enabling or disabling profiles based on your current requirements. This empowers you to ensure these align with your operational priorities .