SonicWall firewall logs auditing and monitoring
Firewalls are vital components that protect an organization’s network from threats and attacks. They help control network traffic, monitor and report on unauthorized access, and block malicious traffic from entering the network. The syslog data generated from firewalls can give you actionable insights on how to mitigate potential network threats.
EventLog Analyzer provides out-of-the-box support for SonicWall firewalls in addition to with other firewall devices. It analyzes, monitors, and manages all firewall log data, making the auditing process much easier. Other benefits of auditing SonicWall firewalls with EventLog Analyzer include:
- A user-friendly interface with an intuitive dashboard.
- Over 60 out-of-the-box reports for SonicWall firewalls that aid in security and compliance auditing.
- Easily customizable report templates to meet internal policy needs.
- Custom compliance reports to help you comply with regulations like the GDPR.
- Real-time email and SMS alerts on configuration changes and events of interest.
- Powerful log forensic analysis with a high-speed log search engine that uses various search algorithms, including Boolean, range, wild card, group searches, and more.
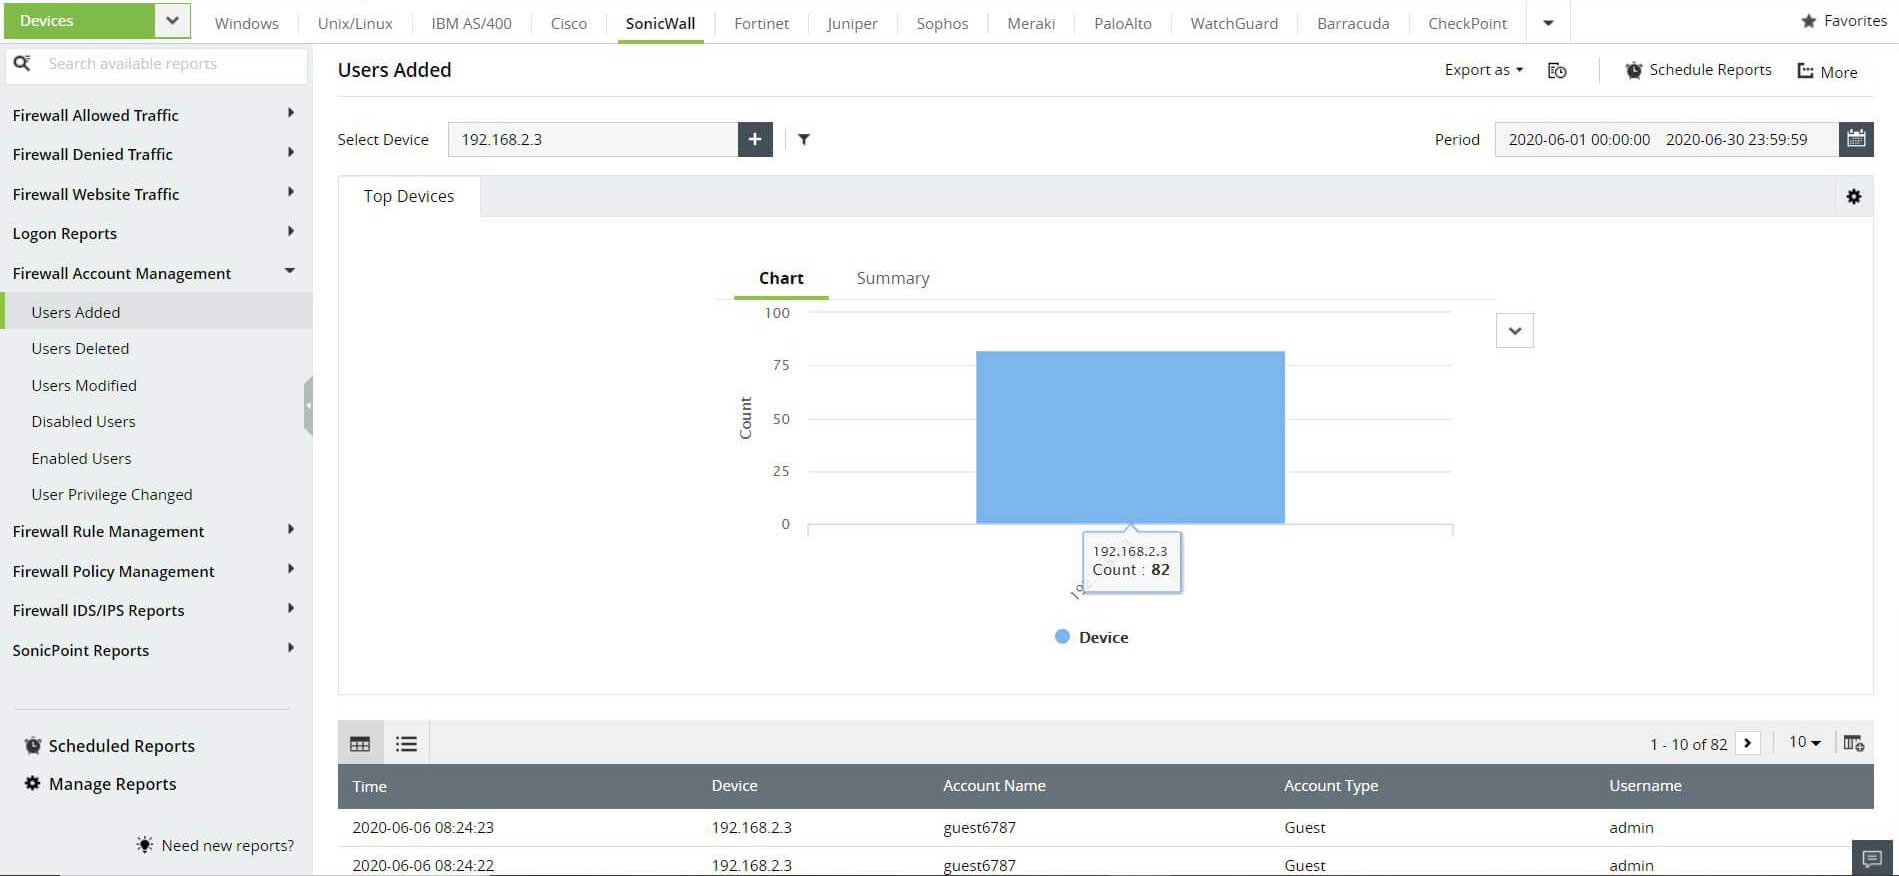
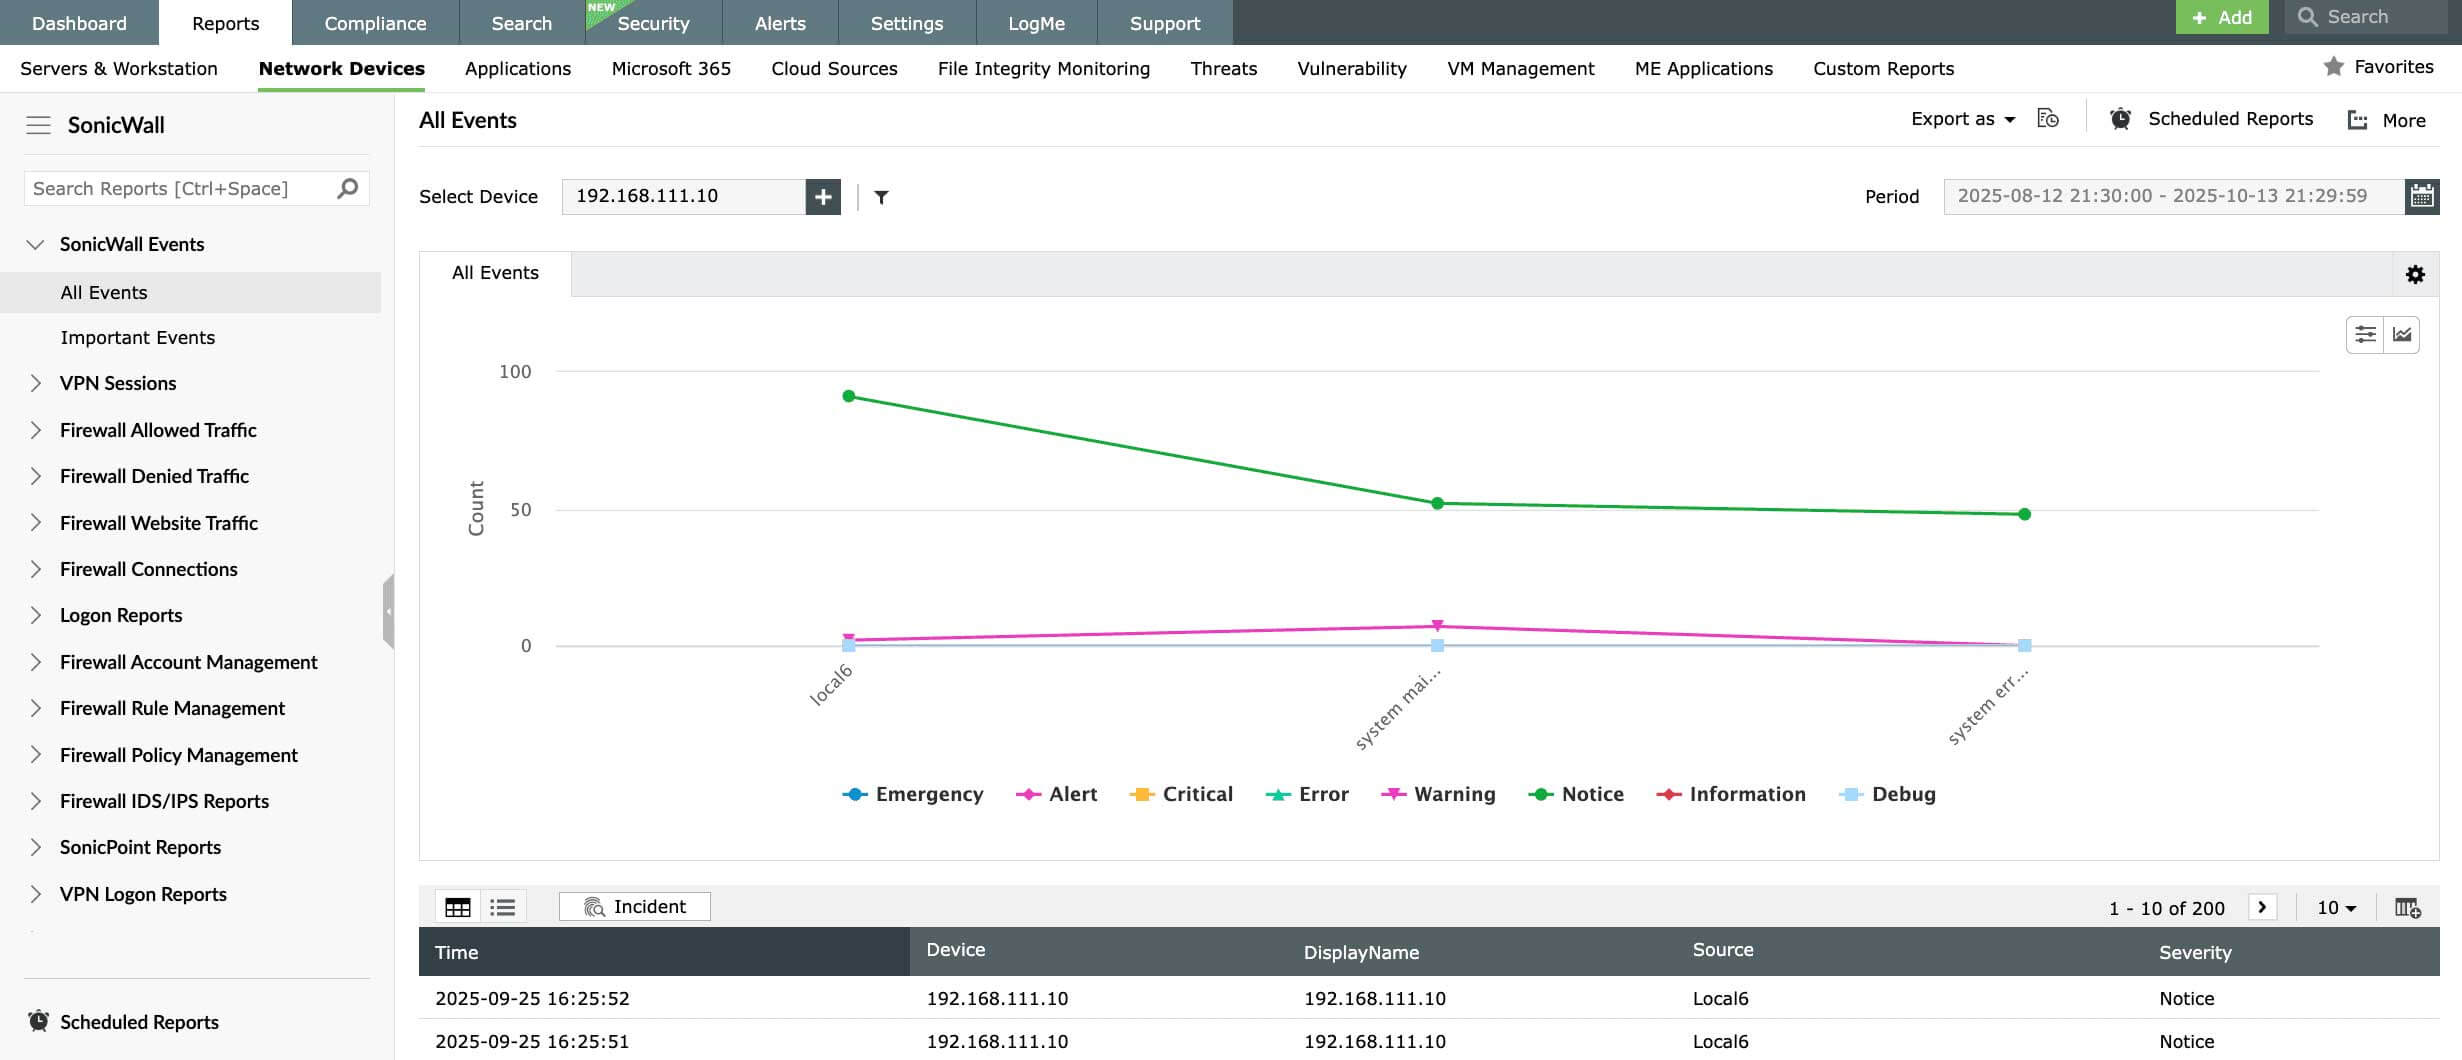
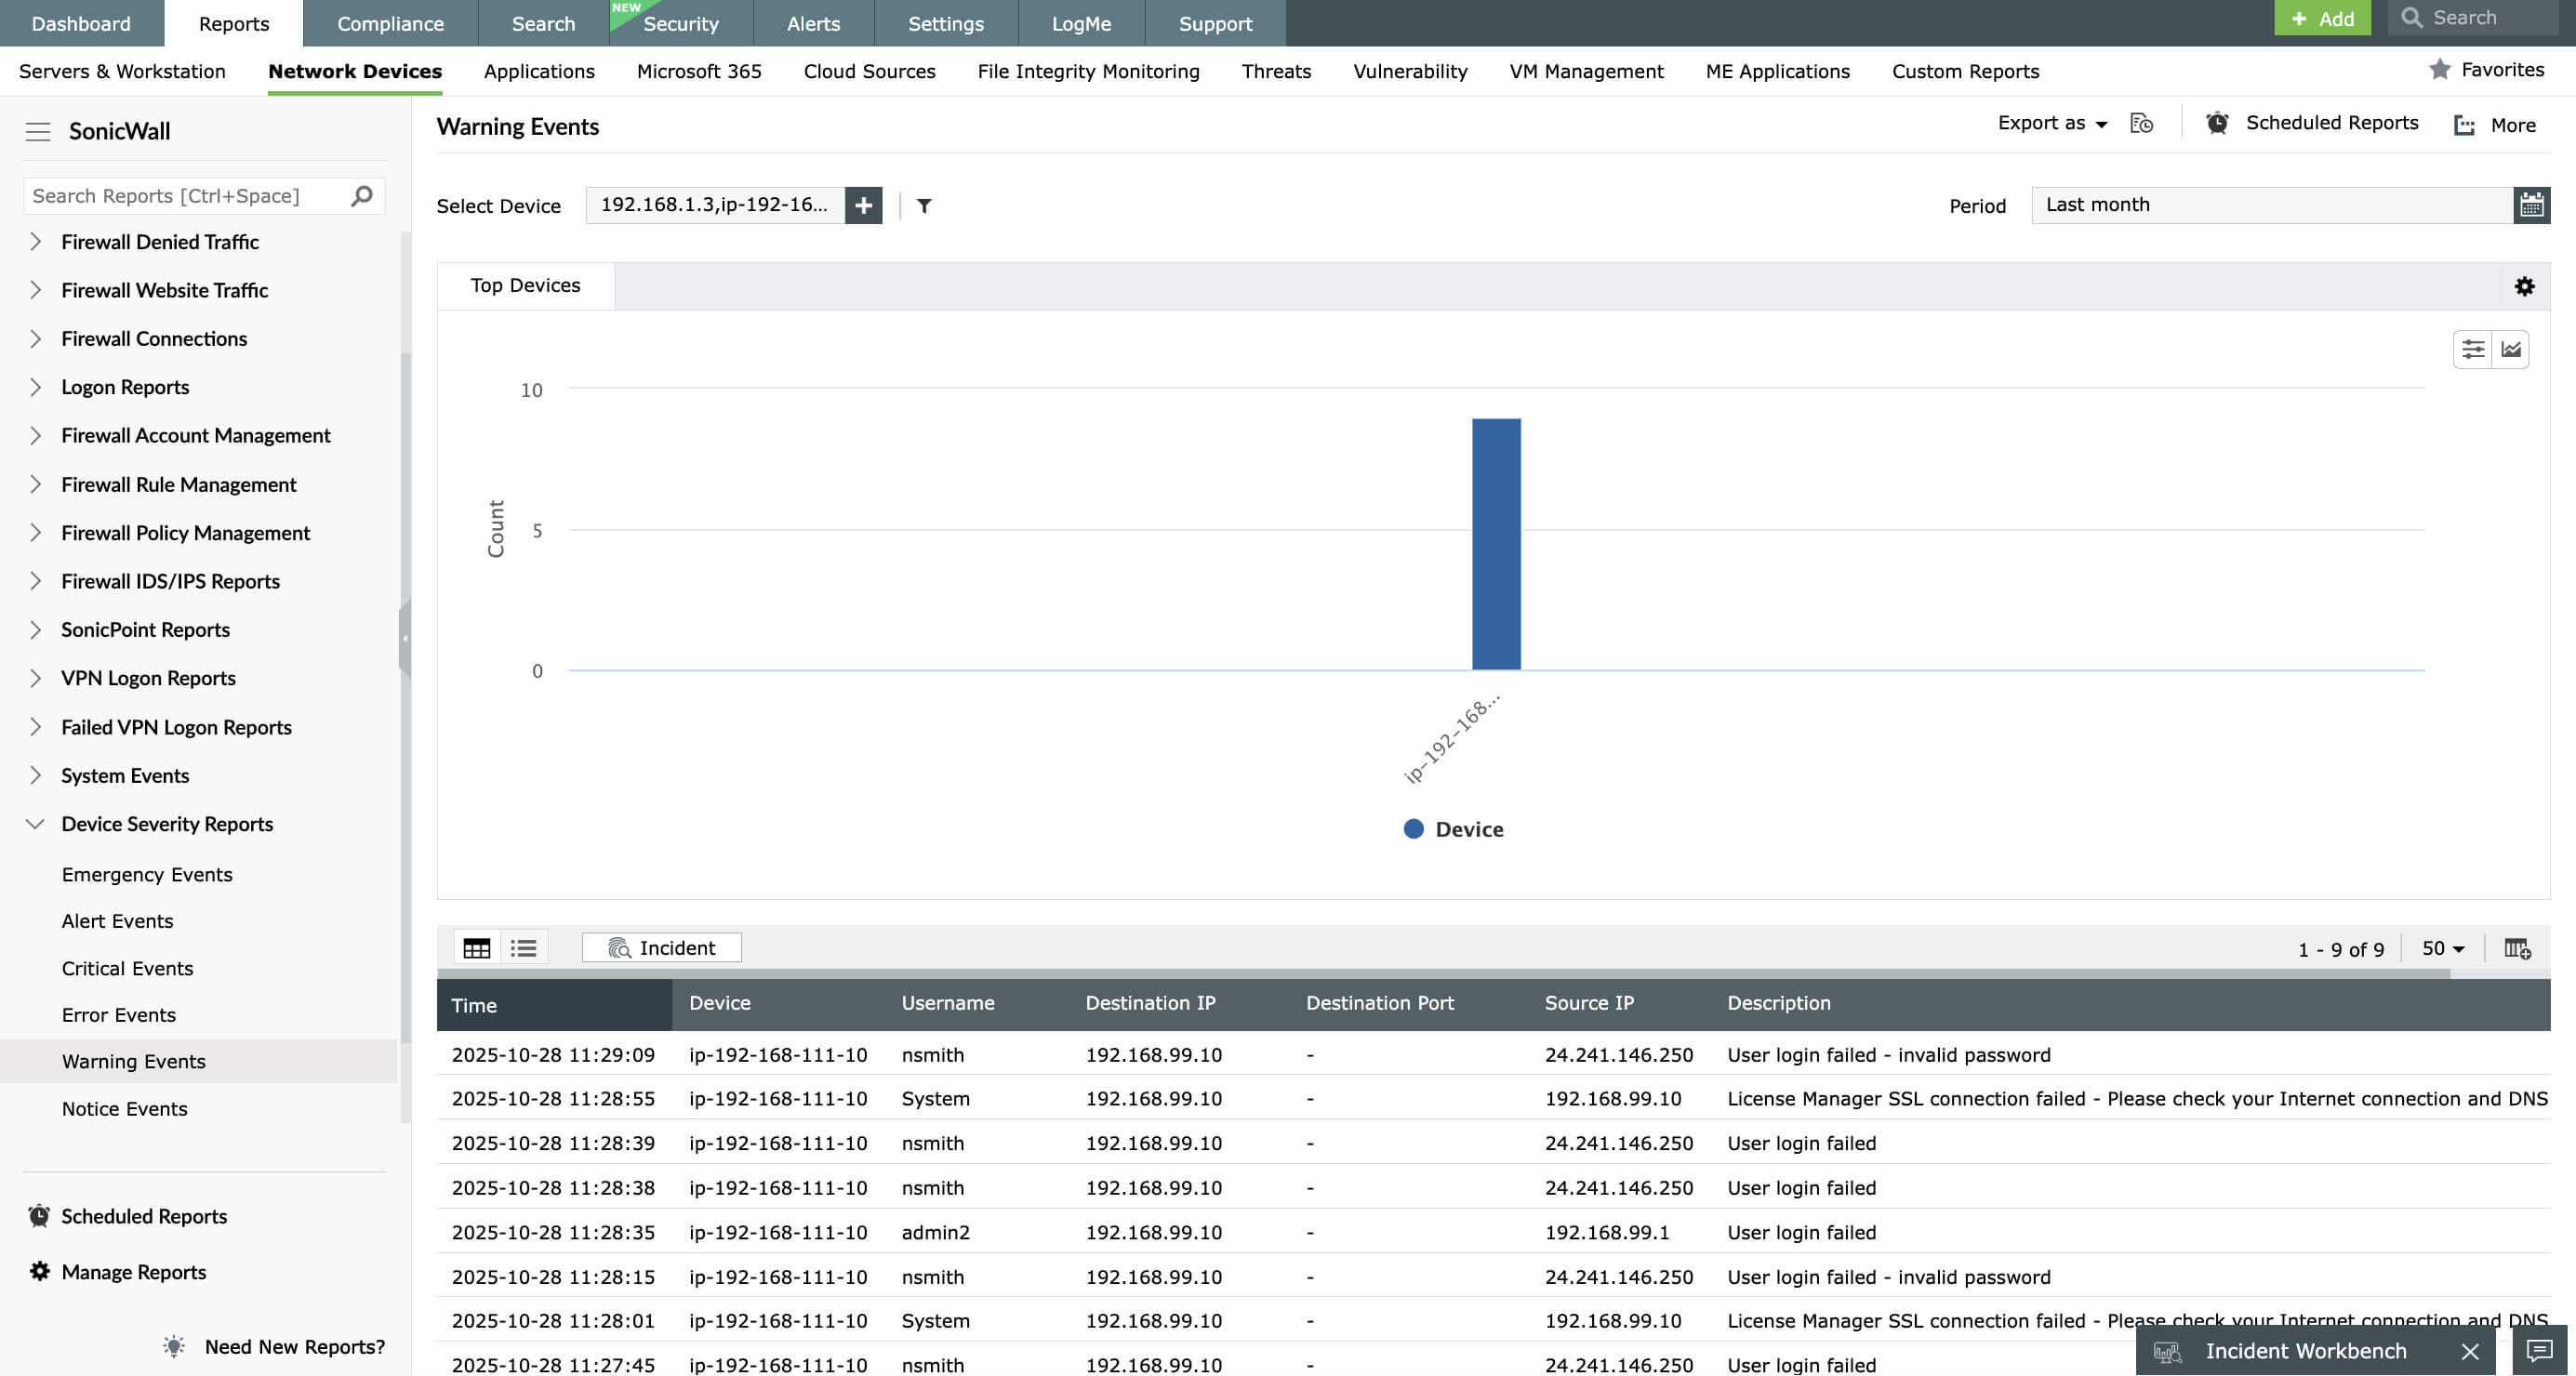
EventLog Analyzer helps monitor SonicWall audit logs and provides simple, predefined audit reports with in-depth information about SonicWall devices. These reports are also presented as intuitive graphs and charts for improved data visualization.
EventLog Analyzer's SonicWall reports fall under the following categories:
These reports give insights into security threats such as SYN flood and routing table attacks, connections that have been denied, and details on critical attacks. These security insights help prevent or mitigate potential attacks on the network. Read more.

These reports track all firewall activities such as the deletion or addition of users, changes in privilege levels, and successful and failed user logons. Monitoring firewall activities helps manage and audit both user and firewall administrator accounts. Read more.

These reports give you an overview of the traffic in and out of your organization’s network, including website traffic. Traffic monitoring reports can also be sorted based on source, destination, port, and protocol to identify patterns. Read more.

These reports track changes made to firewall rules and network policies, which can help with periodic policy cleanup. They also help monitor all access points, security events based on severity (emergency, alert, error, and warning events), and system events (clock updates, removed and inserted PC cards, and status of log space). Read more.
You can get instant notifications for any critical event via SMS or email by configuring predefined alert profiles, or build custom alert profiles by defining criteria that fit your needs. Log data is automatically archived for forensic analysis, helping your organization meet regulatory compliance standards. Archiving log data lets administrators investigate past data by drilling out raw or formatted log data anytime they like.
Installing EventLog Analyzer and configuring syslog collection for your SonicWall device
How to install Eventlog Analyzer
Once you have downloaded EventLog Analyzer and checked the installation requirements, installation is quite easy.
To install the 32-bit version of EventLog Analyzer:
- In Windows, execute ManageEngine_EventLogAnalyzer.exe
- In Linux, execute ManageEngine_EventLogAnalyzer.bin
If you want to install the 64-bit version of EventLog Analyzer:
- In Windows, execute ManageEngine_EventLogAnalyzer_64bit.exe
- In Linux, execute ManageEngine_EventLogAnalyzer_64bit.bin
How to configure syslog forwarding for your SonicWall device
EventLog Analyzer supports logs from SonicWall Firewall when you enable syslog forwarding from SonicWall to the machine in which the solution is installed on port 513 or 514.
To configure syslog forwarding on SonicWall devices:
- Use a web browser to connect to the SonicWall management interface. Then log in with your username and password.
- Click the Log button at the left-hand side of the menu.
- A pop-up will appear on the main display.
- Click the Log Settings tab.
- Under Sending the Log, enter the IP address of the machine running EventLog Analyzer in the Syslog Server field. If you are listening on a port other than 513 or 514, enter the value of the port in the Syslog server port field.
Other features
EventLog Analyzer offers log management, file integrity monitoring, and real-time event correlation capabilities in a single console that help meeting SIEM needs, combat security attacks, and prevent data breaches.
Analyze event log data to detect security events such as file/folder changes, registry changes, and more. Study DDoS, Flood, Syn, and Spoof attacks in detail with predefined reports.
Analyze application log from IIS and Apache web servers, Oracle & MS SQL databases, DHCP Windows and Linux applications and more. Mitigate application security attacks with reports & real-time alerts.
Monitor all types of log data from Active Directory infrastructure. Track failure incidents in real-time and build custom reports to monitor specific Active Directory events of your interest.
Monitor and track privileged user activities to meet PUMA requirements. Get out-of-the-box reports on critical activities such as logon failures, reason for logon failure, and more.
Perform in-depth forensic analysis to backtrack attacks and identify the root cause of incidents. Save search queries as alert profile to mitigate future threats.
Need Features? Tell Us
If you want to see additional features implemented in EventLog Analyzer, we would love to hear. Click here to continue


