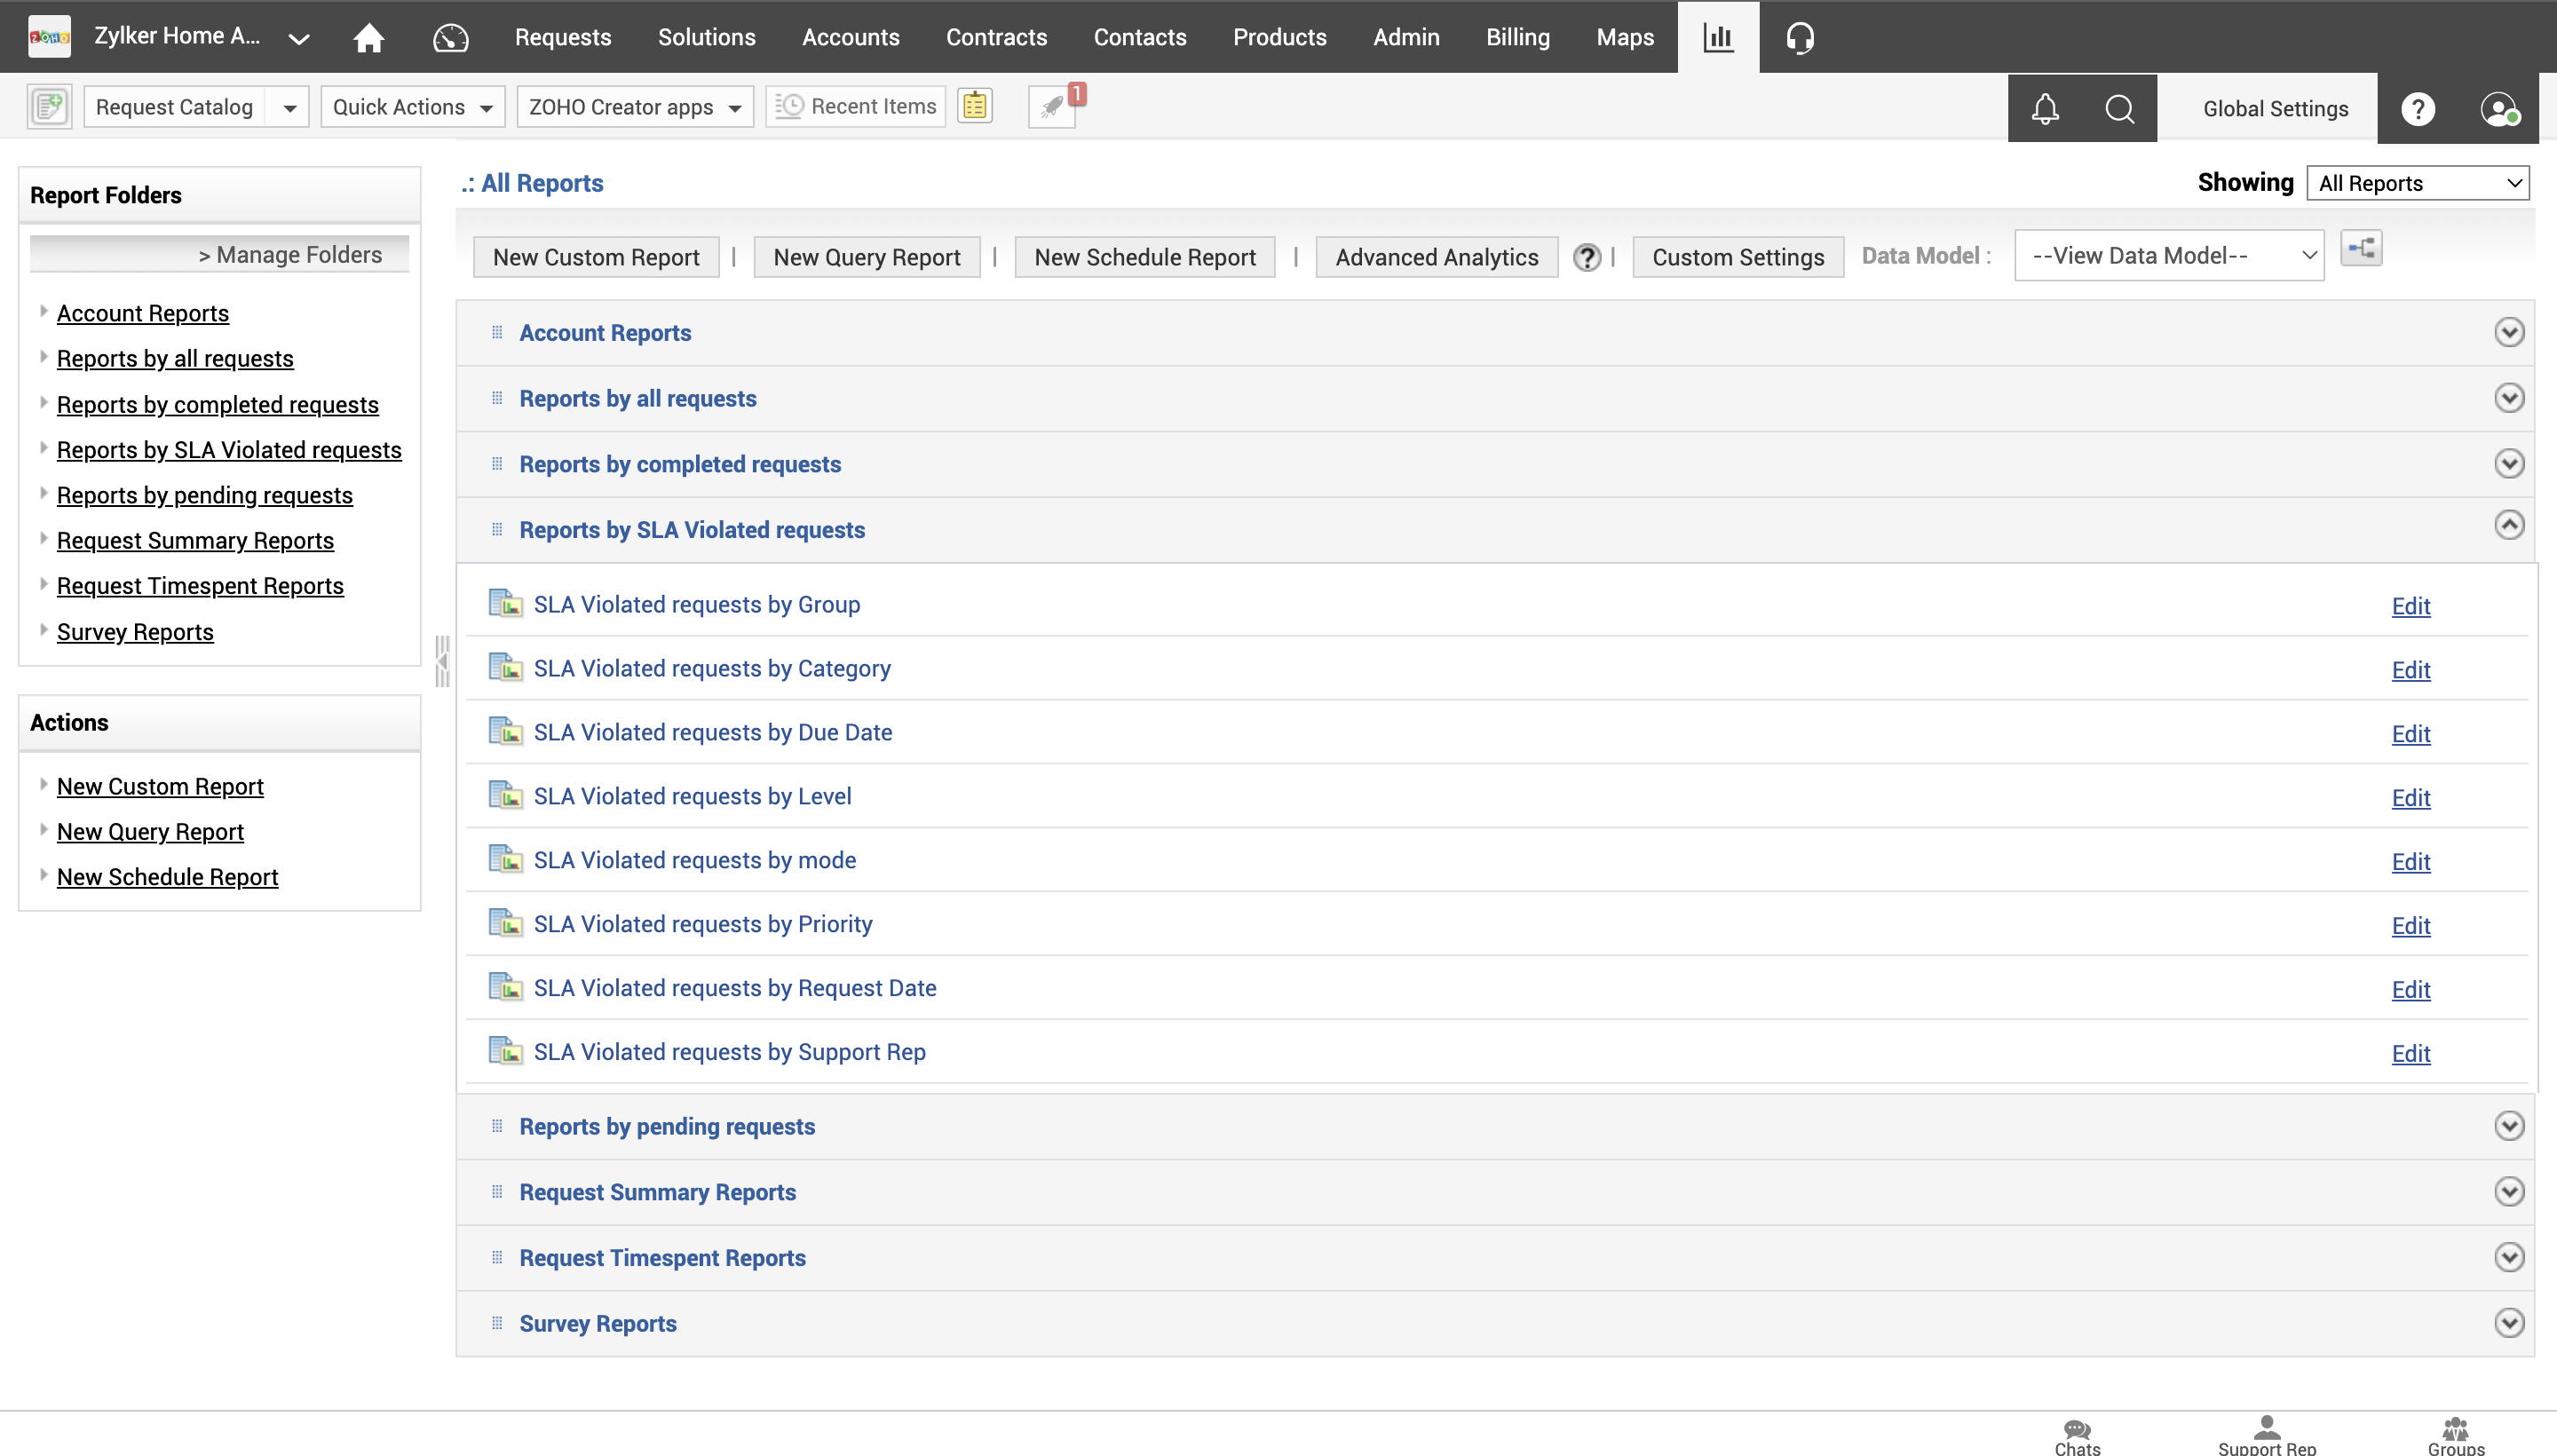
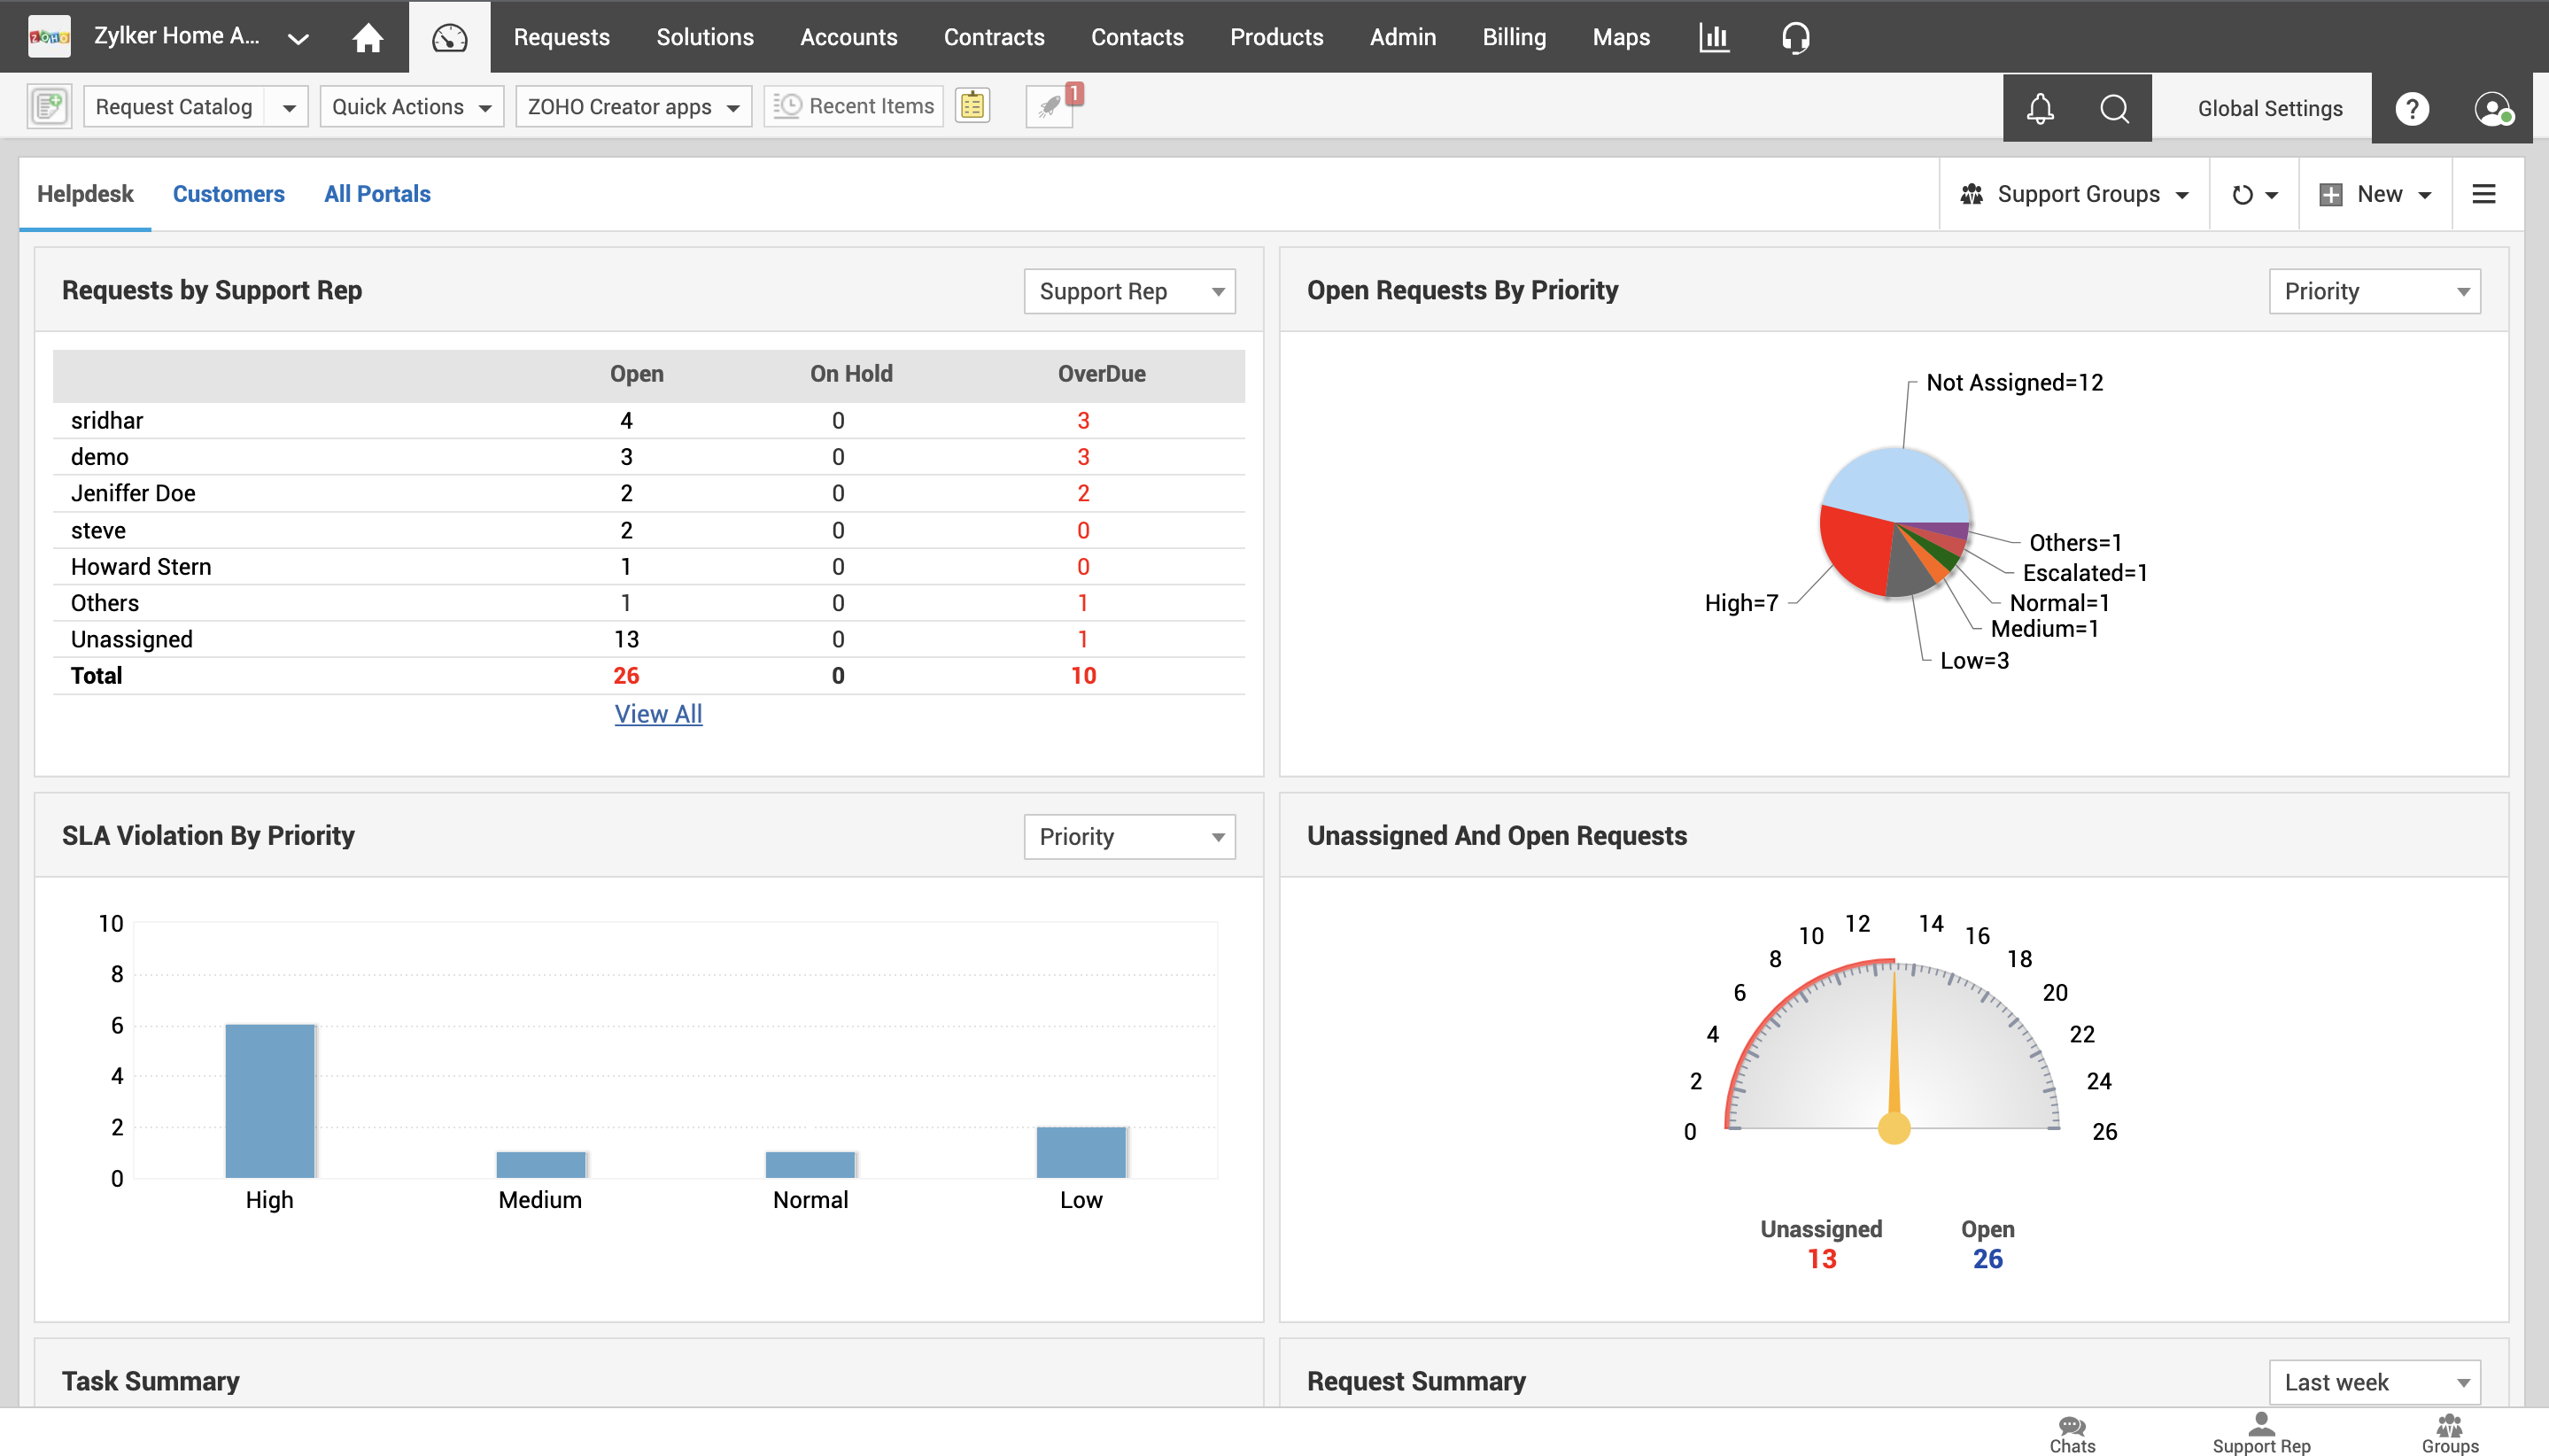
How can you make good decisions about your help desk when you don't know what's actually going on there? You can't—and that's where SupportCenter Plus comes in. We understand the need for accurate analysis of significant KPIs, and with SupportCenter Plus, you can easily analyze the information presented. Create and schedule custom reports, dashboards, and KPIs so you're never in the dark when it comes to your help desk.
Shed light on all the right stats. Step up on IT management.
- Extract real-time information with predefined reports, summarized in tabular and matrix formats.
- Automatically email scheduled KPI reports to managers.
- Integrate with Zoho Analytics for enhanced analysis of help desk statistics.
- Share reports with your customers.
- Create your own custom widgets in the dashboard.
- Extract reports in PDF, CSV, XLS, or HTML format.


Visualize your KPIs as widgets. Bring your help desk to the light.
- Choose from over 50 cutting edge key performance indicators (KPIs) as graphical widgets.
- Drag and drop widgets to create new dashboards and share them with other technicians.
- Create and customize your dashboards, specific to each business unit (BU).