Real-Time Performance Statistics
Does your network experience low quality and lagging remote sessions? Don't remain frustrated; Remote Access Plus helps you resolve these issues and more. Monitoring real time network performance overcomes low quality and lagging issues for both the viewer and end user's device. With the Performance Statistics feature, IT administrators receive an extensive view on latency, download and upload speed, CPU utilization, and memory usage spontaneously during a remote session.
Steps to view performance statistics
To view the real time statistics follow the steps below:
- Open the Remote Access Plus web console.
- Search for the device and initiate a remote session, by clicking on the corresponding Connect button.
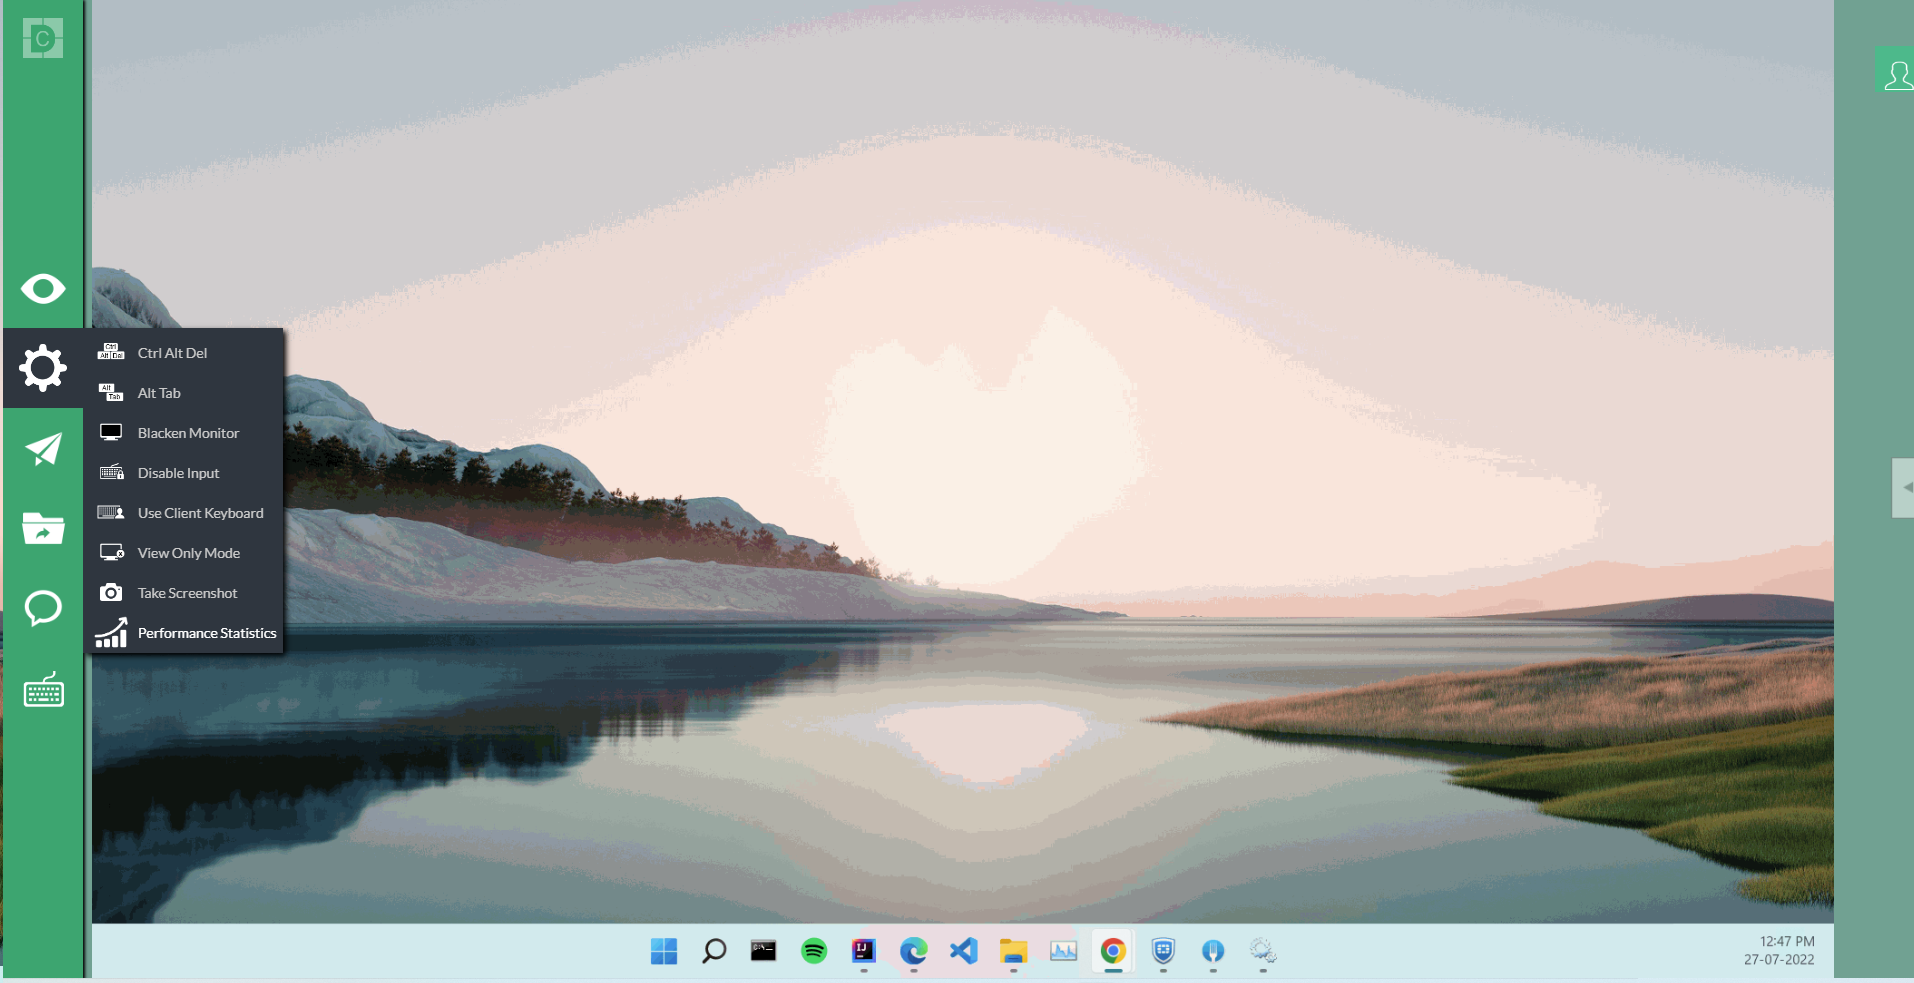
- In the remote session, hover over the arrow in left side of the window and place the cursor on the gear icon. A list of actions will be displayed.
- Now click on the option Performance Statistics.
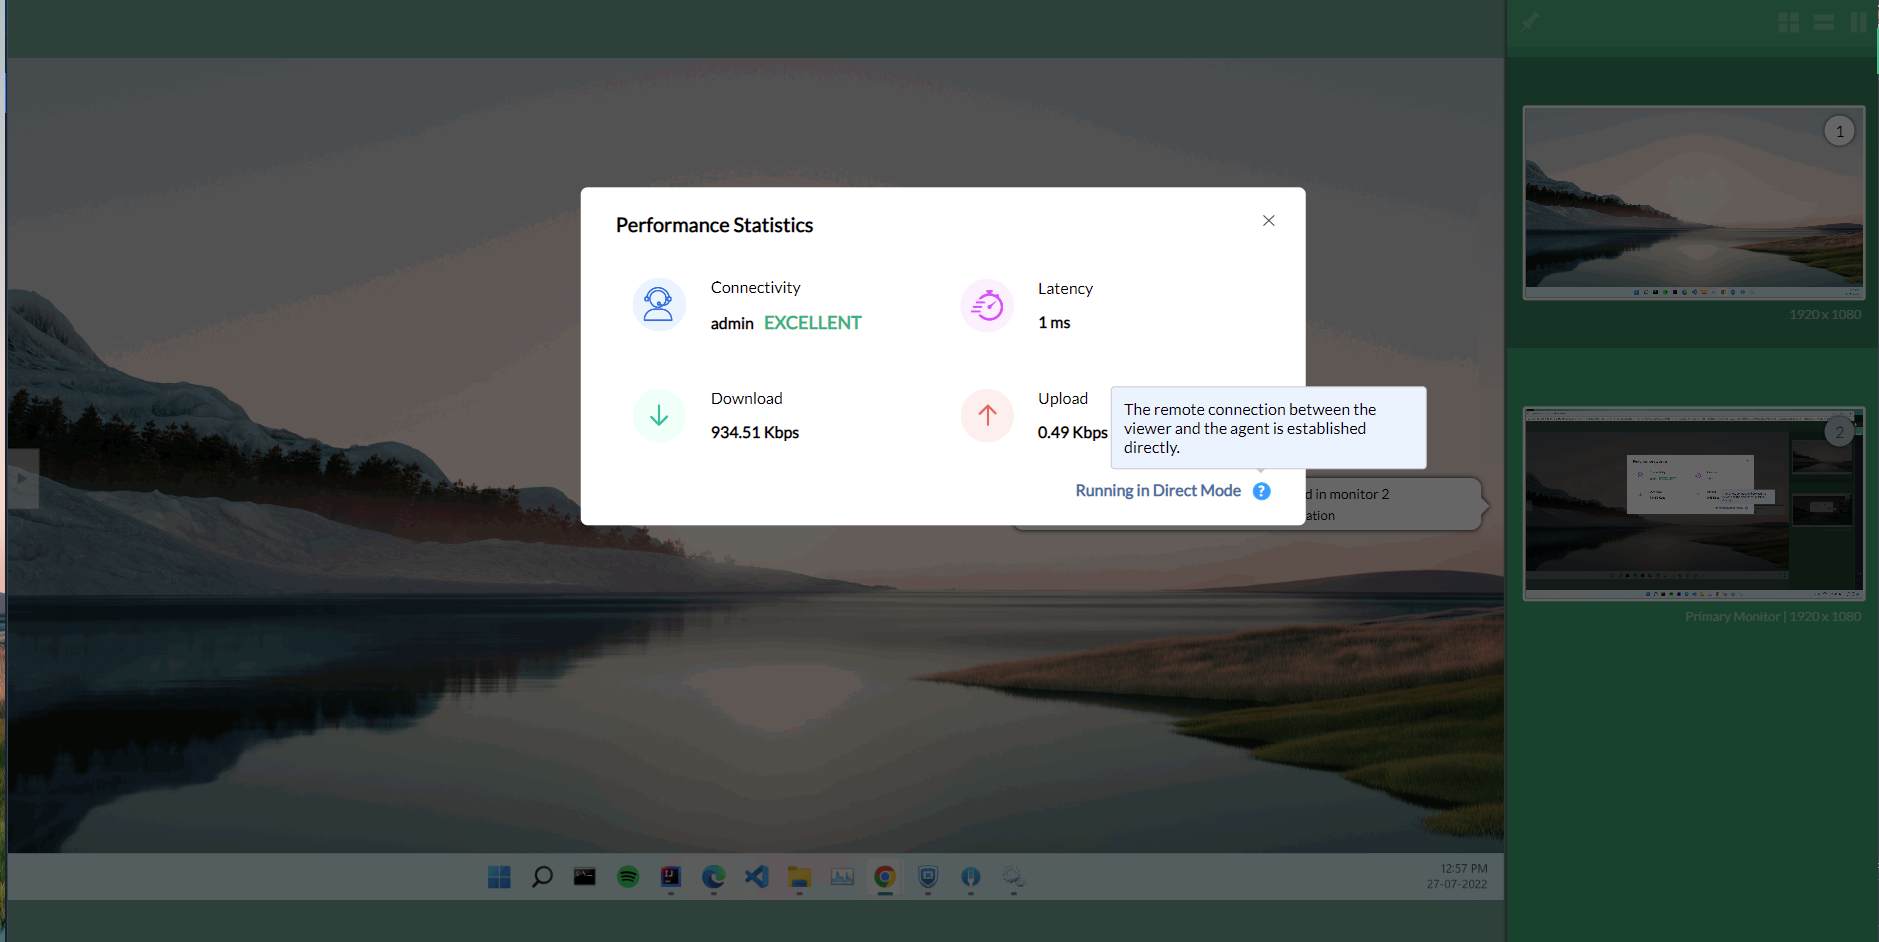
- Direct Mode: If the viewer connects to the agent (end user device) directly, then the connectivity status, latency, download and upload speed of the viewer will be displayed.
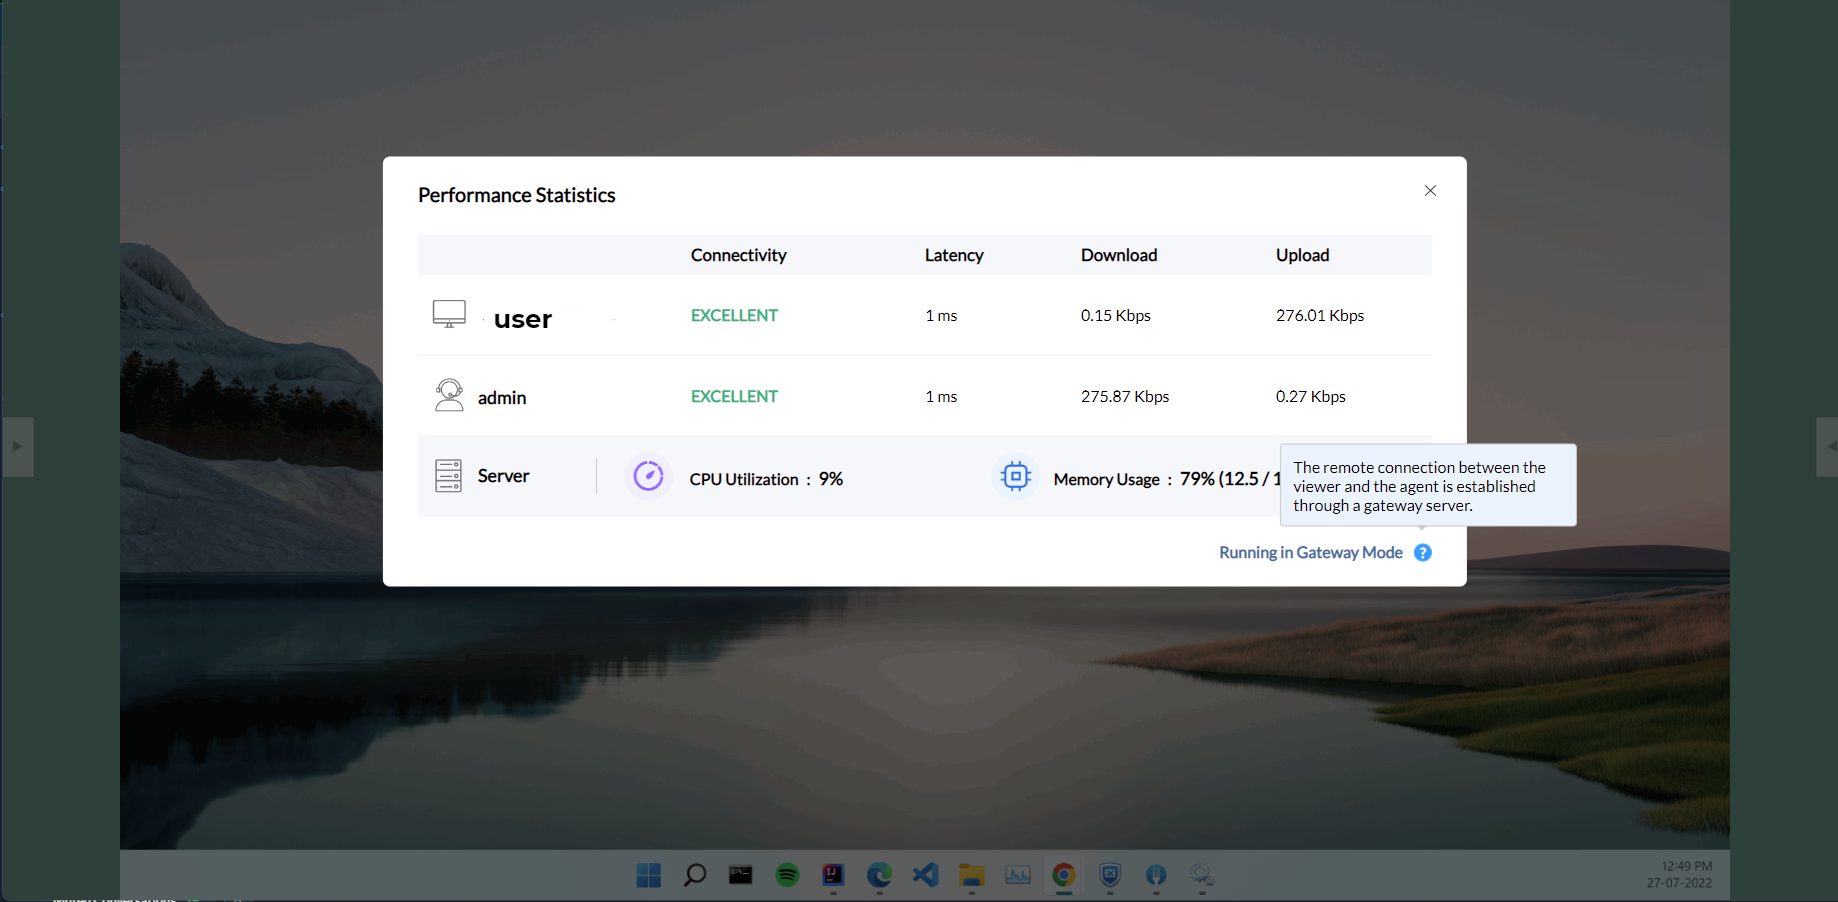
- Gateway Mode: If the viewer and end user are connected through gateway server, connectivity status, latency, download and upload speed of viewer and end user device along with CPU utilization, and memory usage of server will be displayed. When multiple technicians are active in the same session, the performance statistics of all the technicians device will be displayed.
Statistics Overview
Benefits of using Performance Statistics
- Provides the ability to monitor real-time performance.
- Displays the fine-grained visibility of the viewer and agents connectivity status.
- Shows performance statistics of Windows, Linux, and Mac devices.
- Determines network issues while staying connected in a remote session.
- Identifies if the connectivity problem is from the viewer or agent side.
- Helps deliver an unhindered remote session by avoiding lag and poor visibility.
Frequently Asked Questions
What is the difference between direct and gateway mode?
When the viewer and agent are on the same network, they will communicate in the direct mode. When the viewer and agent are on different networks, they will communicate through a gateway server. Learn More.
Can I view the performance statistics of any flavored OS?
You can view the performance statistics of Windows, Linux and Mac devices.
Is it possible to see the performance of a remote computer without initiating remote session?
You will be able to receive real time performance statistics while in a remote session.
Will the admin be able to view their own device performance?
Yes, performance statistics will show both the viewer and agents latency, and the download and upload speed.
Where will I be able to find Performance Statistics?
Initiate a remote session from Remote Access Plus web console. Hover on the gear icon found in the left corner. Click on Performance Statistics to view the real time diagnosis.


