OpManager monitors the devices and interfaces in your network and raises alarms to notify the user, whenever any network abnormalities such as slow response time, connectivity loss, packet loss occurs. In other words, whenever any device or interface fails to perform at its optimal level an alarm will be generated instantly.
The list of alarms raised in OpManager can be accessed under the Alarms tab in the UI. The All Alarms page contains a comprehensive list of all the alarms. The alarms are also further classified into different types like Active Alarms, Syslog Alarms to enable easy access.
When a device is added, OpManager automatically associates monitors (metrics, e.g: CPU utilization) to that device based on the default device template and begins to monitor the device performance and its availability.
By default, OpManager pings the monitored devices at regular intervals as per the configured poll interval and sends alarm notifications to the user when the device fails to respond or when its response time is high.
You can configure the threshold for the monitors associated with a device and when a device violates the specified threshold value, OpManager will raise an alarm to notify the admin. OpManager supports three severity based threshold levels: Attention, Trouble, Critical. You can customize the threshold value for each severity.
Each severity has a unique color code and the alarm raised will indicate the color of the violated threshold level.
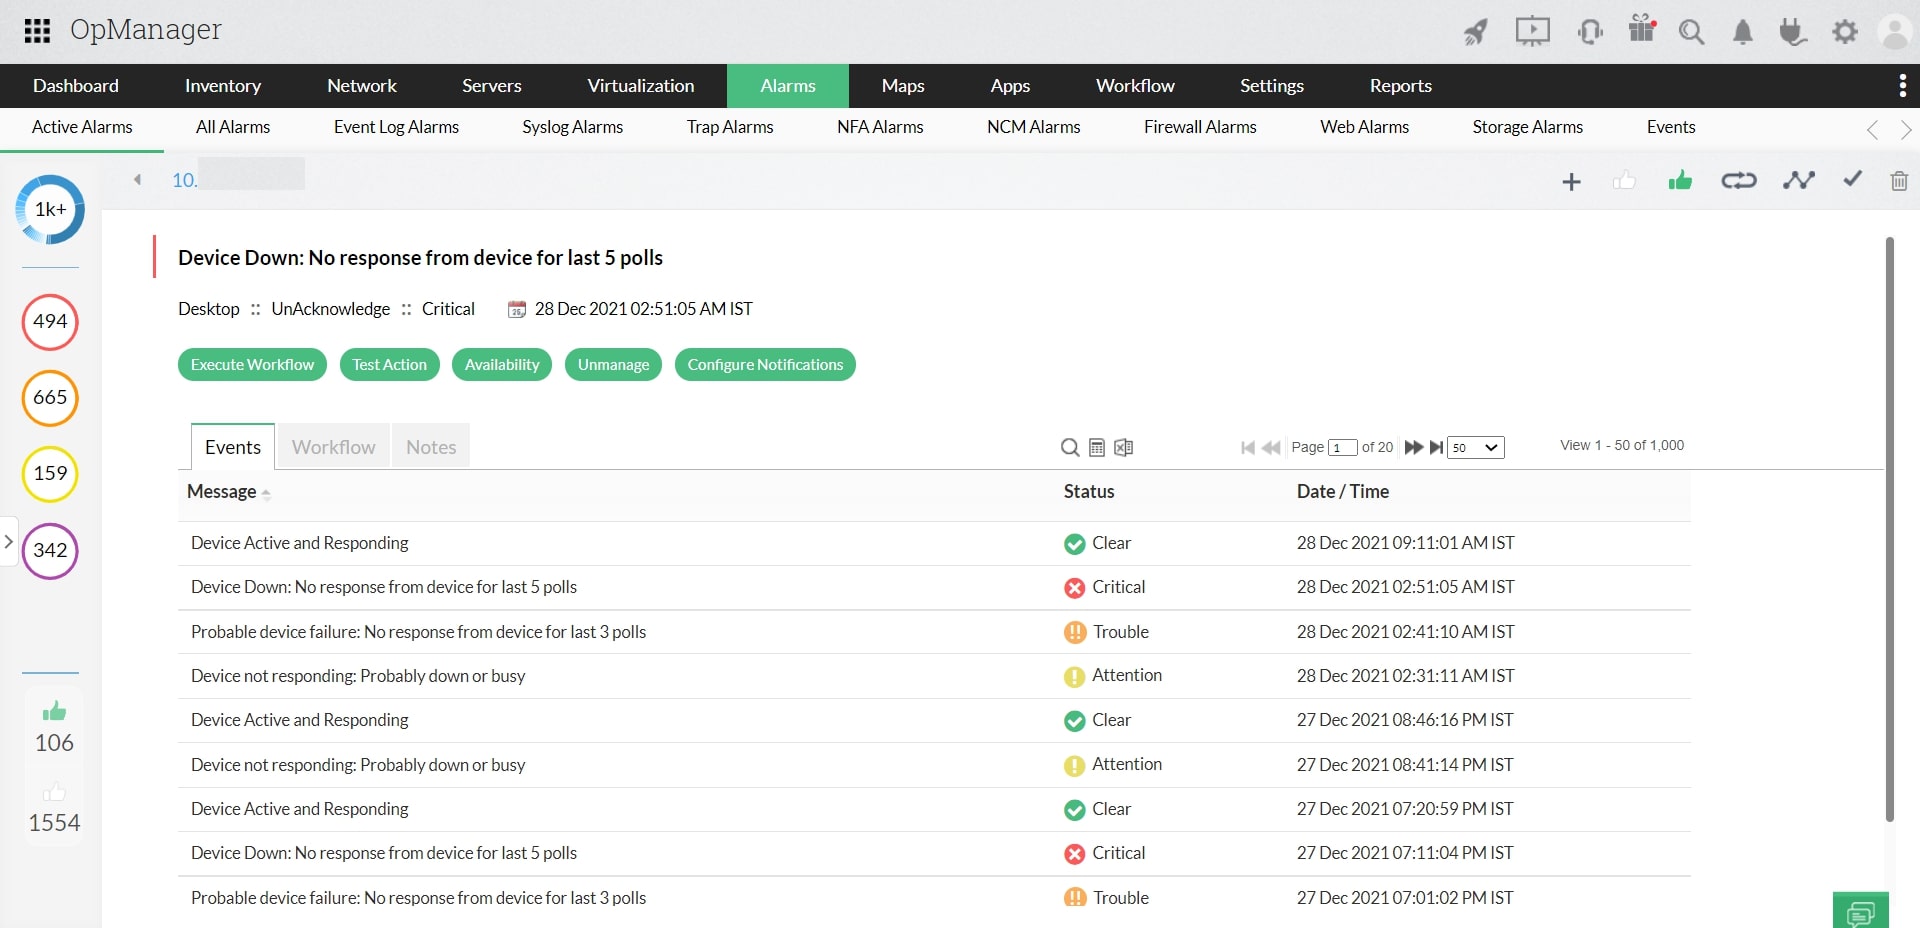
To get a deeper insight on the network issue for which an alarm was raised, you can access the snapshot page of an alarm. (The page that opens when you click on an alarm from the list of alarms is called an Alarm snapshot page.) This page gives the details of the issue, the severity and the time when the alarm was raised.
Additionally, you can perform a wide range of actions (Eg: Execute a workflow) from the Alarm snapshot page.

There are three ways to handle the alarm details in OpManager.
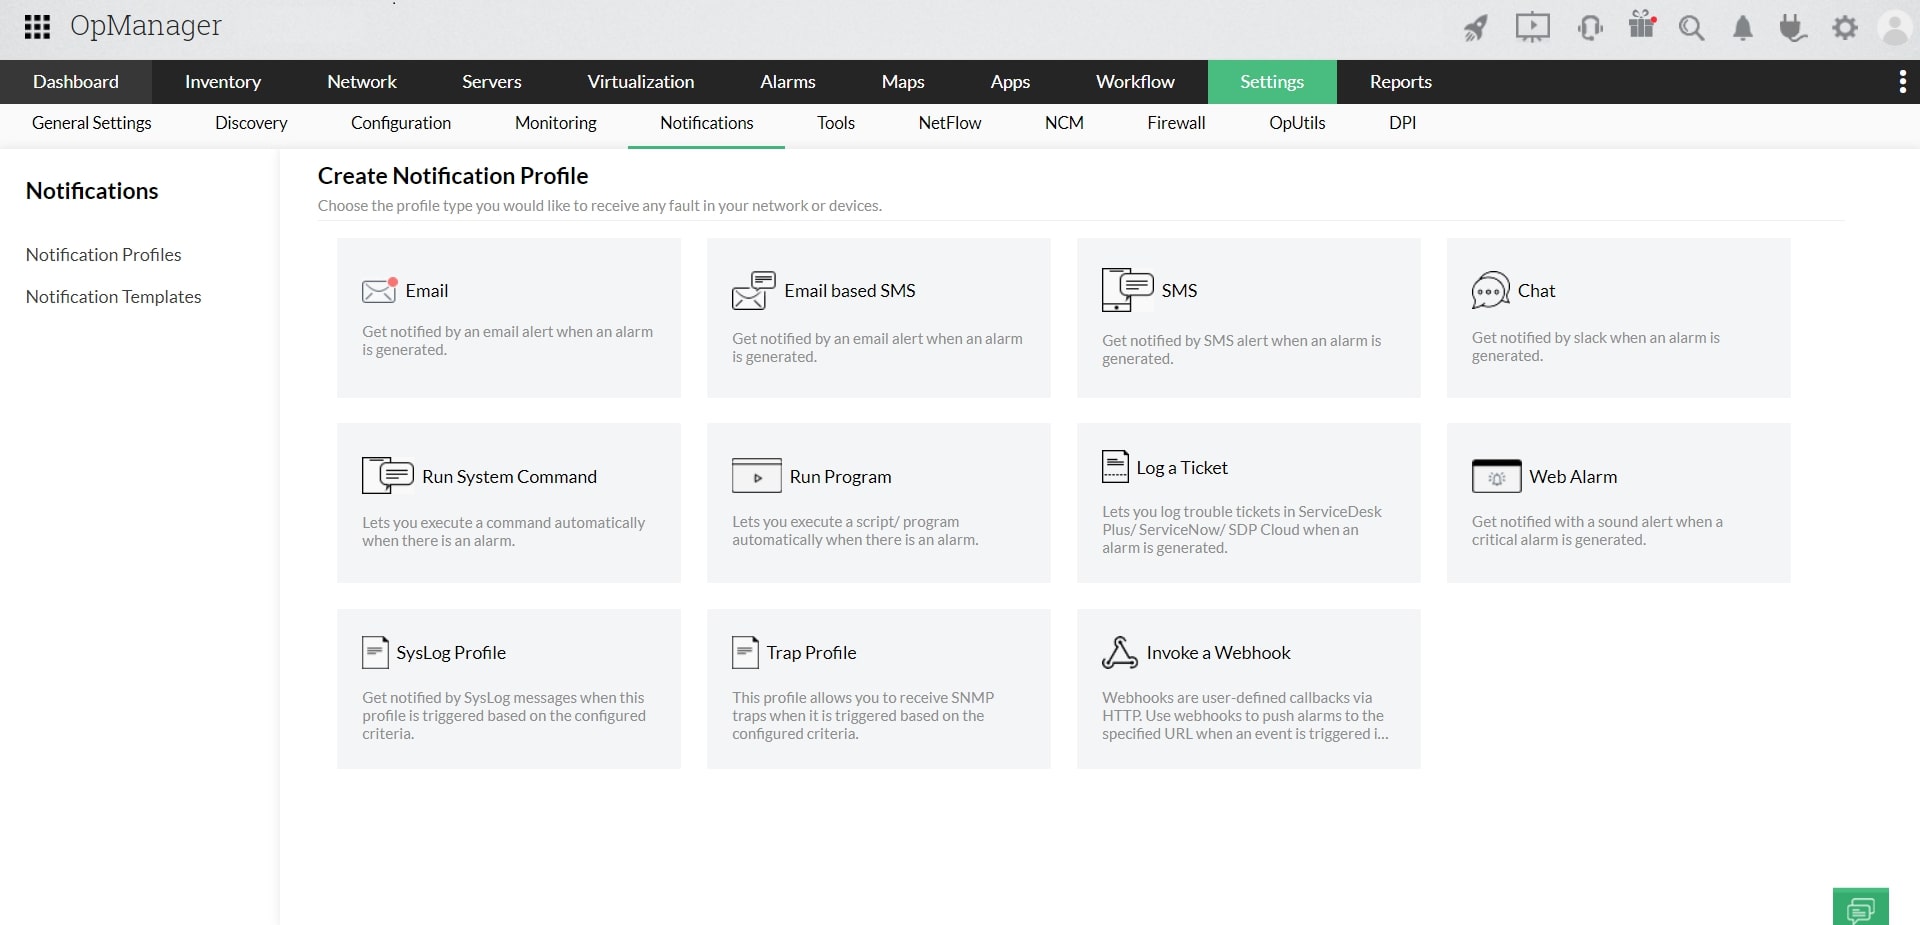
The main objective of an alarm is to notify you about an issue instantly so that you can take corrective actions to resolve the issue quickly. You can choose the type of notification you receive by configuring the Notification Profile. Some of the notification types supported in OpManager are.
Apart from this, you can perform other actions also using the Notification Profile such as Run a Program, Run a System Command, Log a ticket in desk applications like ServiceDesk Plus, Jira and ServiceNow.

Sometimes if an alarm is unattended for too long, the issue may not be resolved and this can cause serious consequences, especially if the alarm left unattended is of critical severity.
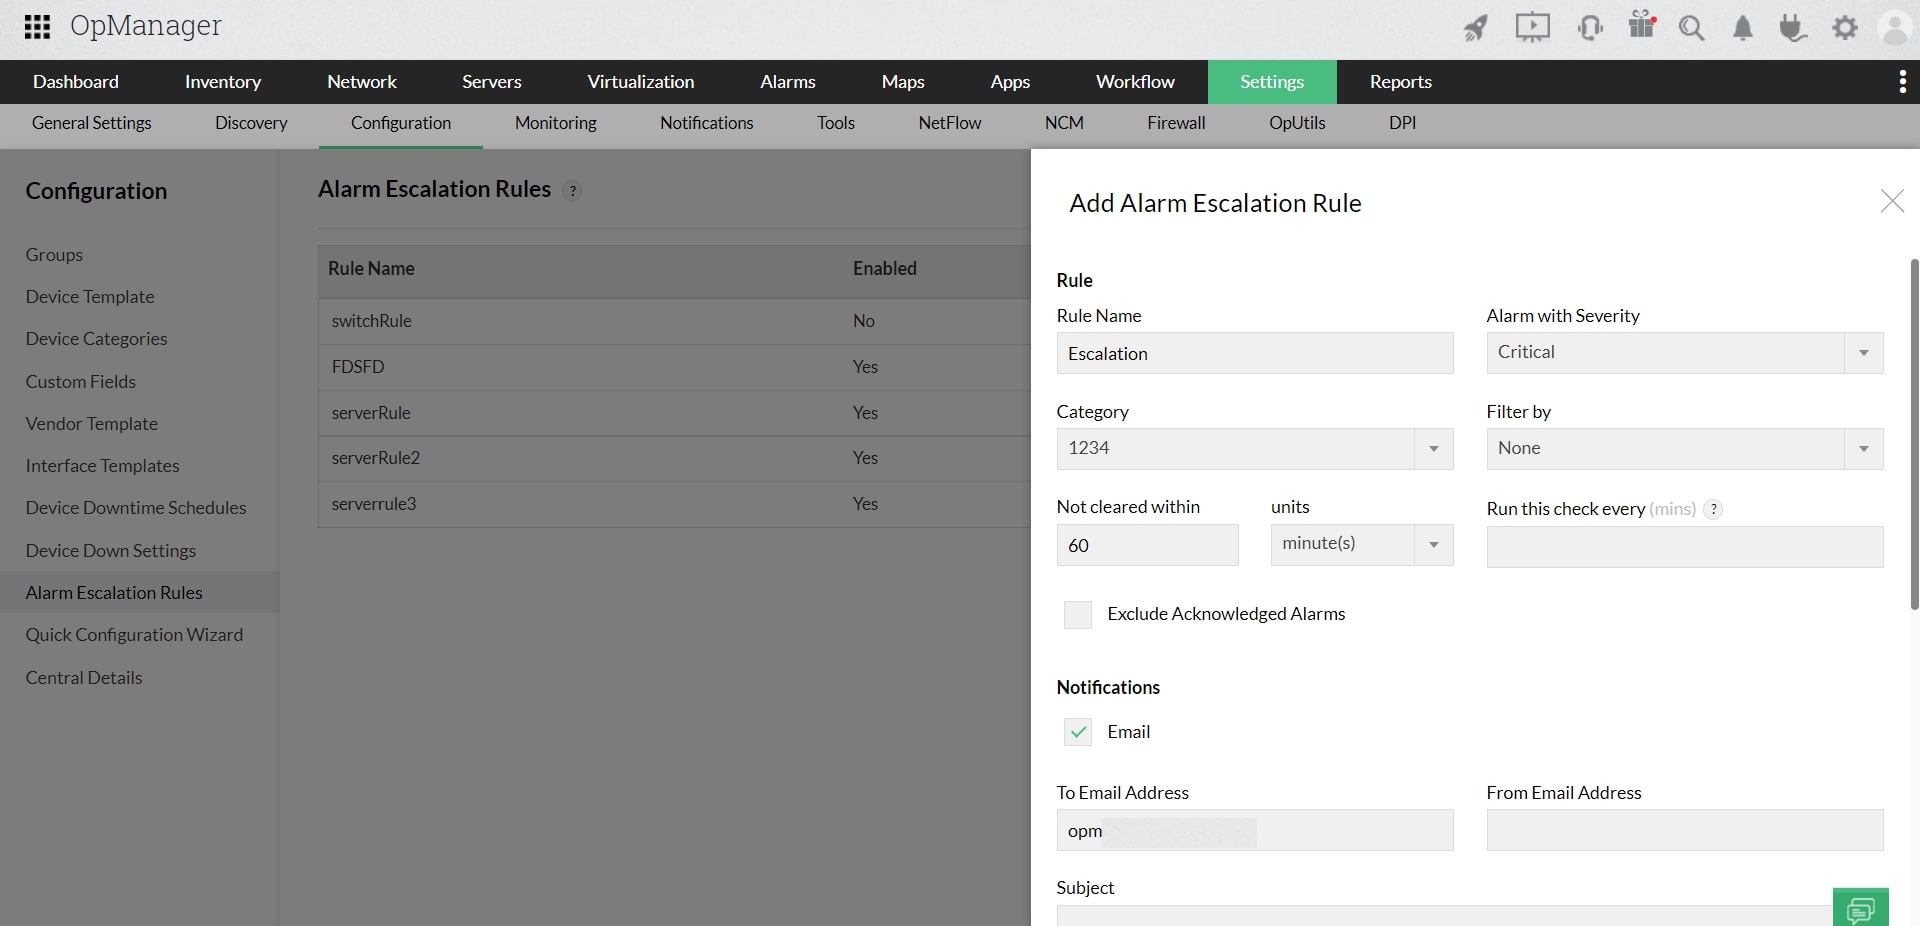
By configuring alarm escalation rules, you can escalate an alarm to a senior level person in-charge or a backup IT admin ensuring that the issue is resolved before it turns into a complete network/device failure. You can configure the severity of the alarm and the maximum time duration after which the escalation should take place.
For example, you can configure to escalate all critical alarms that are not cleared even after 60 minutes.

Sometimes certain devices will be kept under maintenance and may not be available for regular use. You can prevent OpManager to raise alerts for this type of device unavailability by configuring the alarm suppression rules. This will ensure that OpManager does not raise an alarm for the selected devices for the specified time.
Note: This page outlines the overview of features. To get step by step instructions for using a feature we request you to access the hyperlinks mentioned in appropriate places in this page.
Thank you for your feedback!