- Home
- Logging Guide
- How to analyze firewall system events?
How to analyze firewall system events?
In this page
- Analyzing firewall logs: Firewall started/stopped/restarted events
- How to analyze firewall logs with EventLog Analyzer
Analyzing firewall logs: Firewall started/stopped/restarted events
The firewall functions at the entry point of the network. Functioning at the network and transport layers, it handles all the incoming and outgoing traffic in a network. It is important to monitor the status of the firewall regularly. There might be several reasons such as a software error, hardware malfunction, and more which can cause firewall to function abnormally. It is important to understand the reason before you start troubleshooting. Close monitoring of firewall logs can provide necessary information for quick troubleshooting.
The message ID for the failure or restart events varies depending on the cause and vendor. For instance, if the firewall failure is due to hardware issues such as power failure,
- Cisco ASA firewall reports this as %ASA-1-735004 message ID and it corresponds to Power Supply var 1: Failure detected
- Whereas, in Fortinet firewalls (FortiOS 6.0.4), the message ID 22105 corresponds to power failure.
Therefore, for effective troubleshooting you need to quickly identify the cause of these critical issues (such as stop and restart) and take steps accordingly. For this, you need to analyze the logs and relate the message ID with the correct cause. Manually doing this task is time-consuming and is tedious. A log management solution, that automatically parses firewall logs based on the format, extracts fields and present the cause in the form of intuitive reports and alerts can help you to great extent.
How to analyze firewall logs with EventLog Analyzer
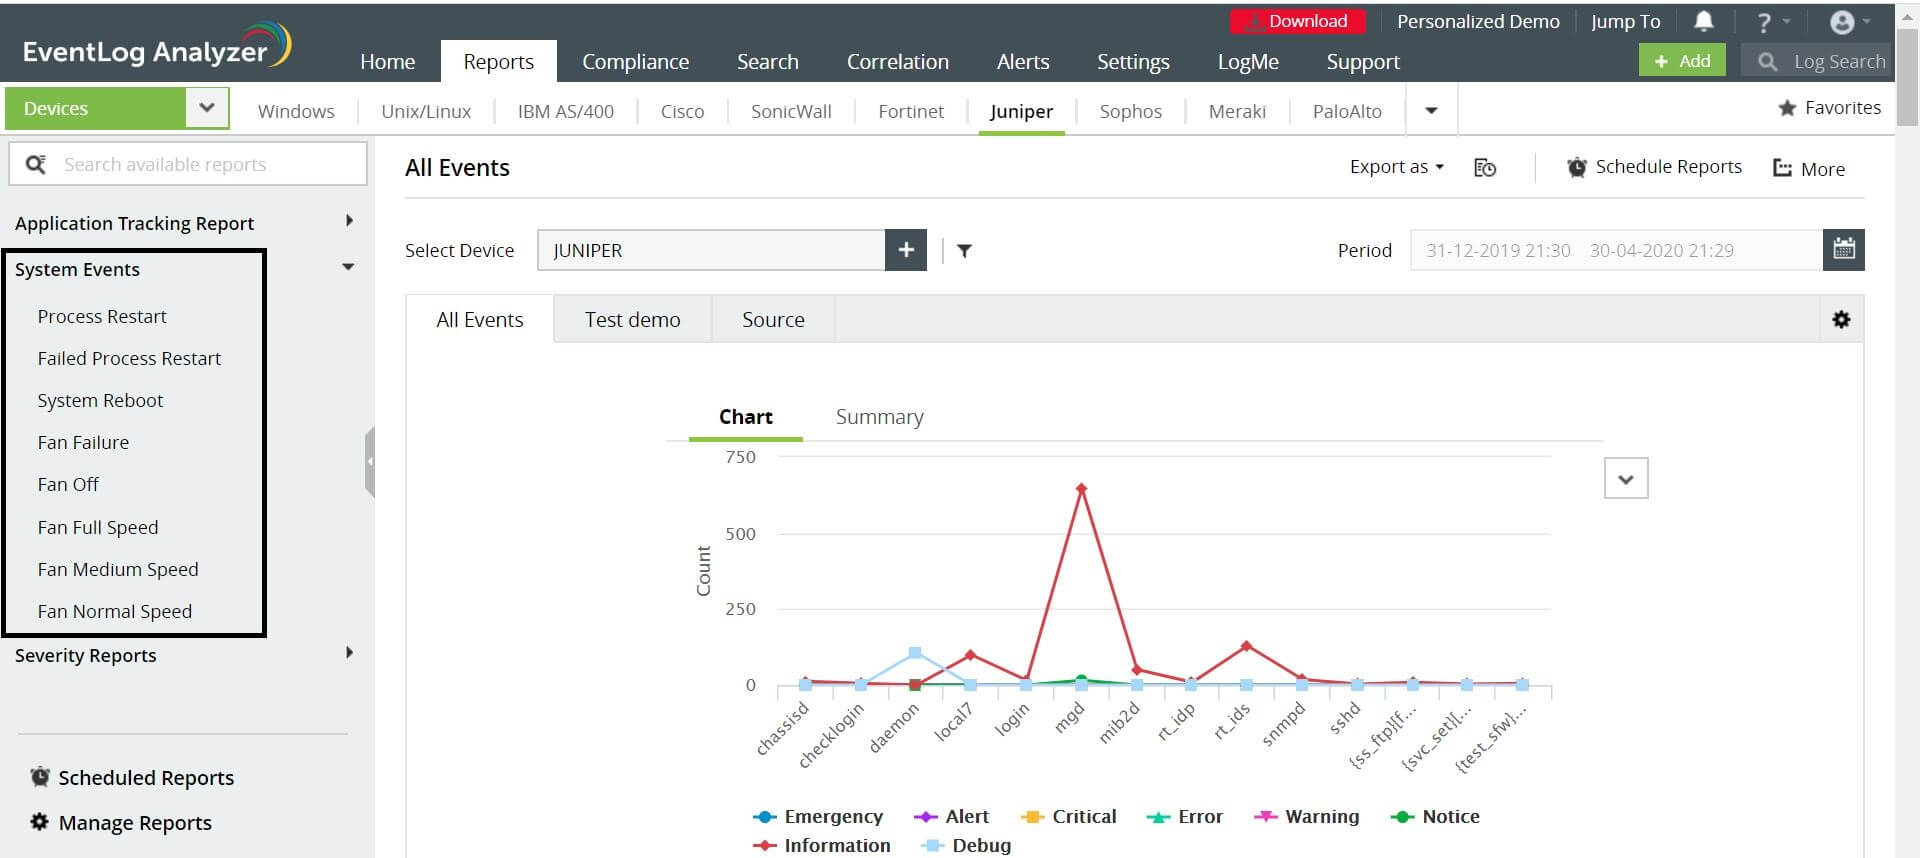
Check out EventLog Analyzer, a comprehensive log management solution which helps to provide real-time reports and alerts on firewall events such as reboot, process restart, failed process restart, and more.


