The Dashboard is shown when the Dashboard icon on the left side is clicked. It is the first page you see when you log in. You can also customize the default Dashboard or you can create new Dashboard as per requirement.
Once the server has started receiving logs, the Dashboard dynamically changes to display the current statistics for each device whose log files are analyzed.
The Firewall Analyzer dashboard consists of tabs. The dashboard contains the following tabs:
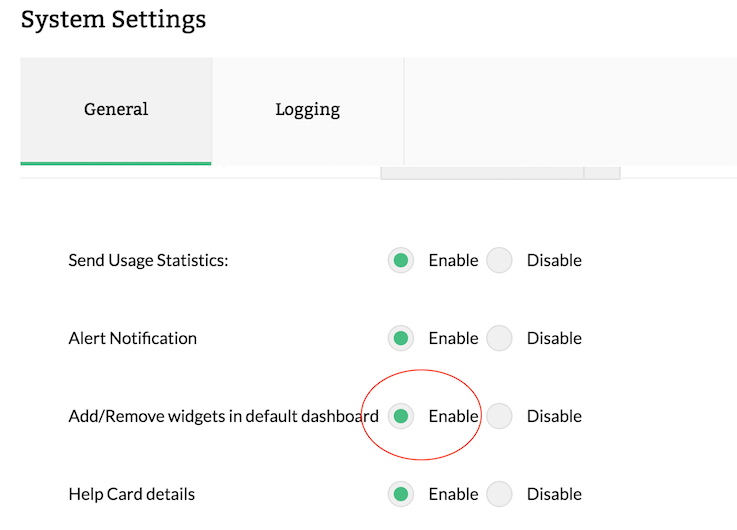
By default you cannot edit the dashboard, to edit the dashboard, enable "add/remove widget in the default dashboard" option under Settings-> System settings. After enabling the same, you can add or remove widgets in the dashboard.
You can also create your own dashboard.
The dashboard will be created and added to the second level tab.
You can make any of the dashboards as default by clicking the * mark besides the dashboard name.
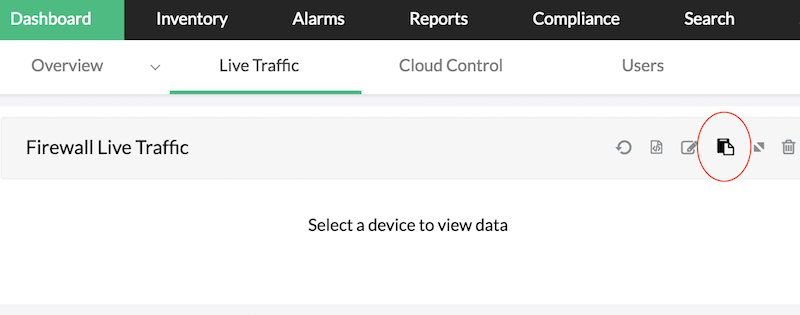
To add a new widget to the Dashboard - Live Traffic page follow the steps given below:


Thank you for your feedback!