The Devices tab shows the devices that have been added to the firewall Analyzer. It also shows the activity status of the added firewall devices. Apart from this it shows the vendor name, the type and status of the firewall device. By default, the devices are listed in table view, click on the view menu to change to list view. The Devices can also be searched for using the search menu.
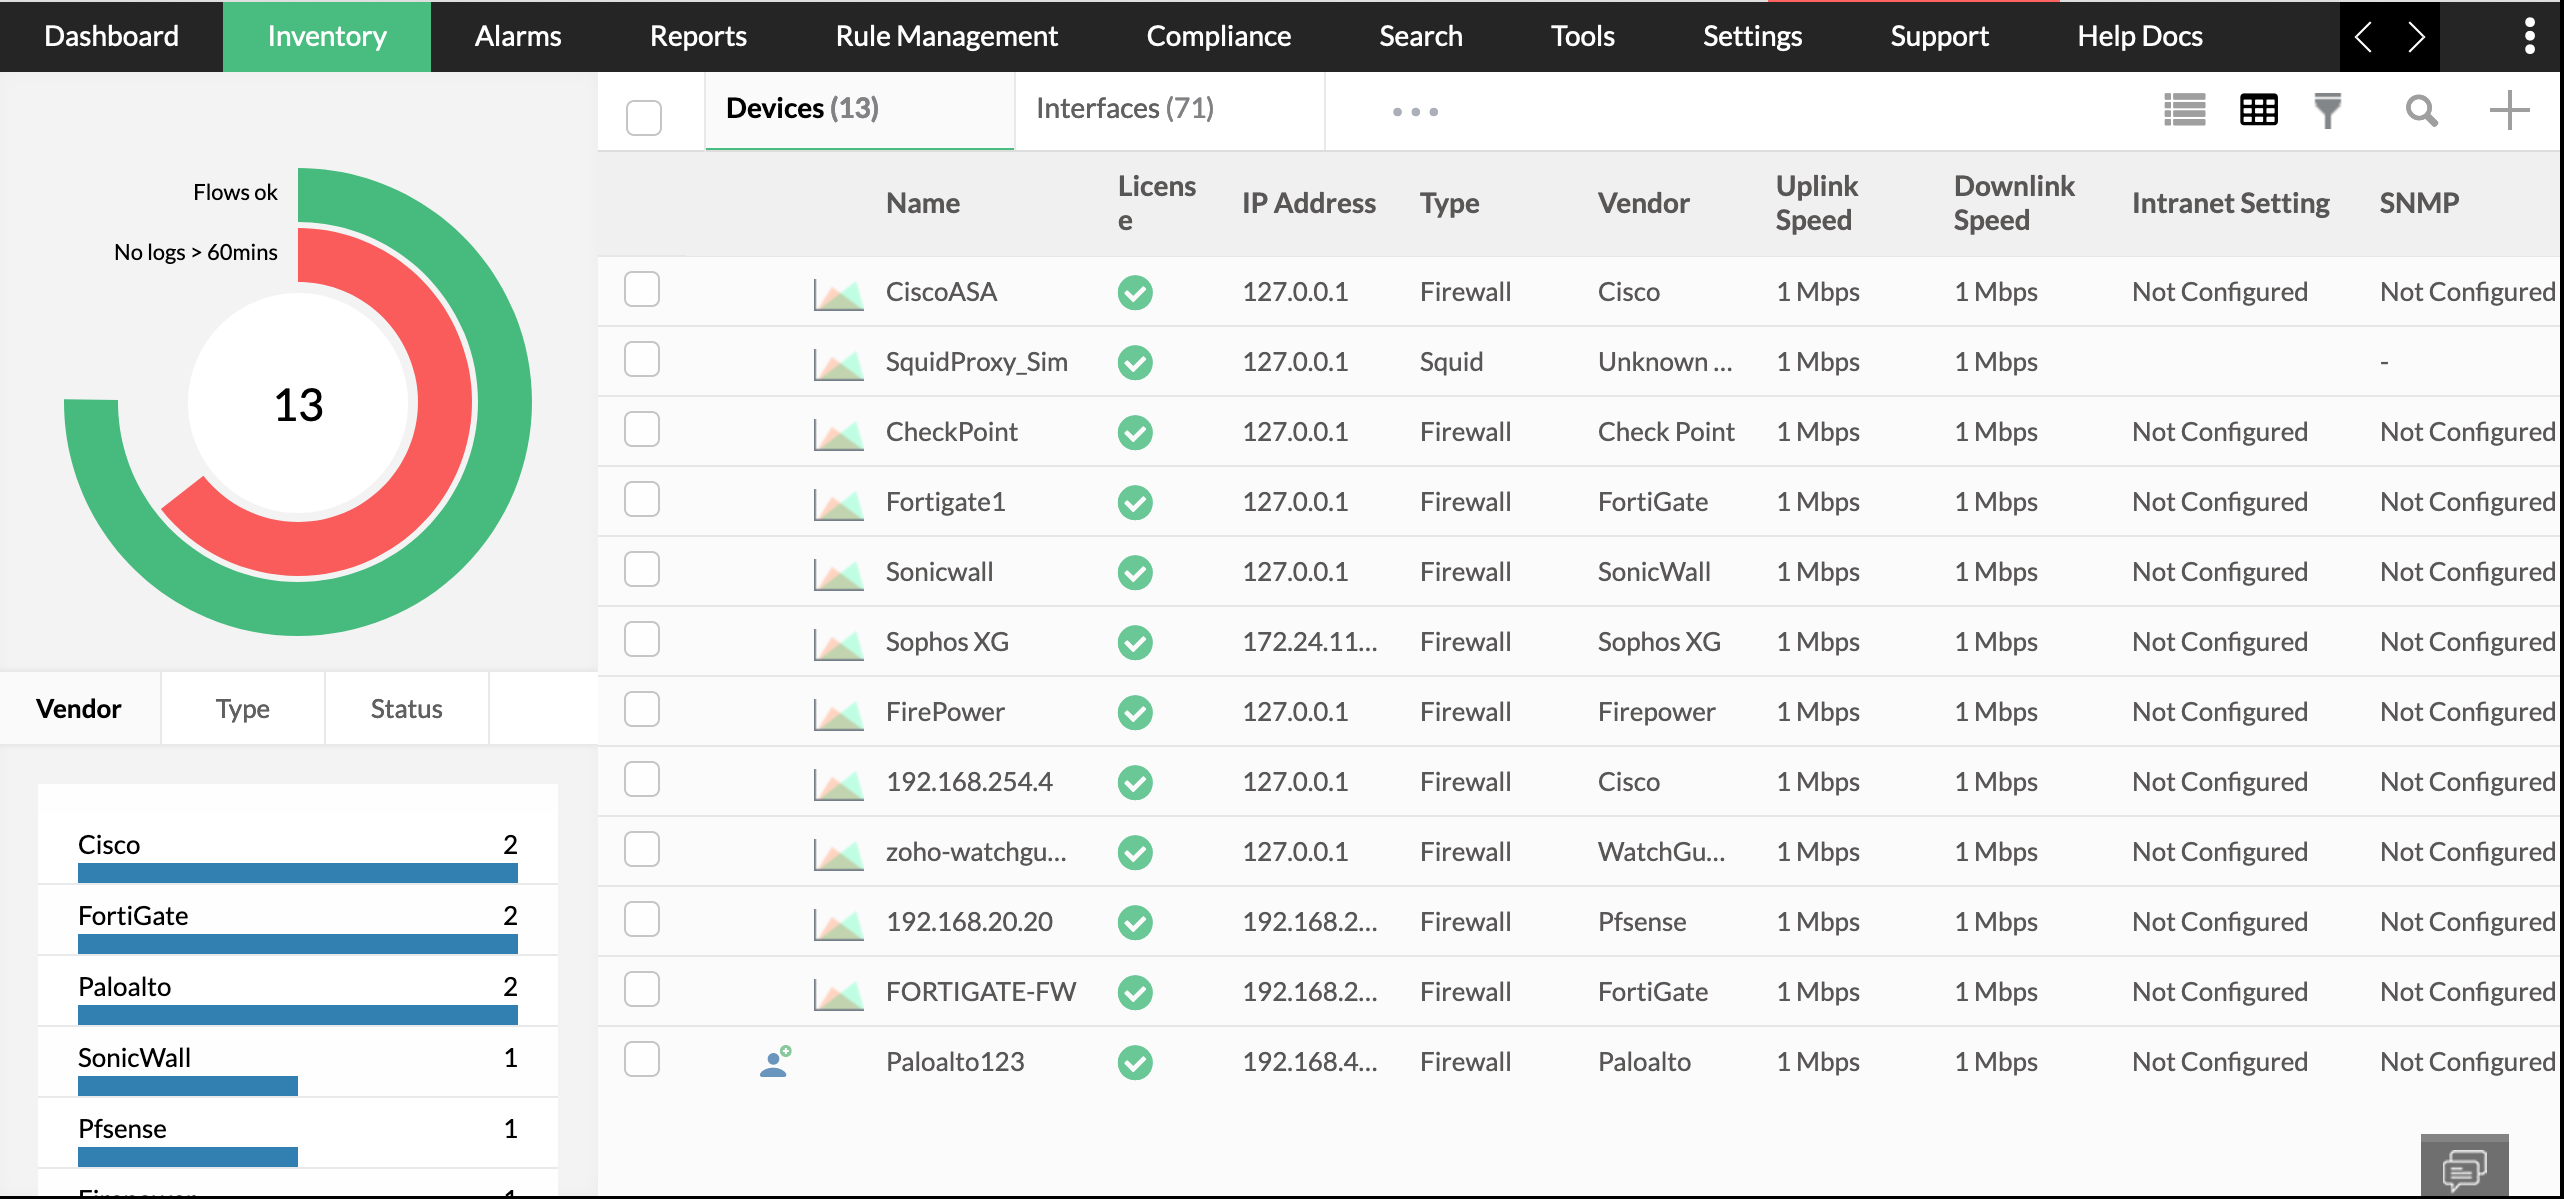
The following data is shown in the device tab.
| Name | Name of the device. |
| License | If the licence is managed or unmanaged. |
| IP Address | The IP address in which the device is configured. |
| Type | The type of network security device. |
| Vendor | The type of vendor. |
| Uplink Speed | The Uplink speed of the device. |
| Downlink Speed | The downlink speed of the device. |
| Intranet Setting. | Provides information on if or not the Intranet is configured. |
| SNMP | Provides information on If or not the SNMP is configured. |
On clicking on any one of the devices, a short summary for that live traffic is shown.
Create a new alarm profile by clicking on the "Create Alarm Profile" menu.
Create a new report profile by clicking on the "Create Report Profile" menu.
Delete the device using the "delete" button.
The menu button (Three dots) is found on the top right corner. On clicking the same you get the following options:
The short summary gives details on the traffic going through that device, both Traffic In and Traffic Out. On expanding the short summary, you get access to in depth reports which has the following graphs.
1. Summary- This provides the summary of the firewall device.
By default, the Uplink and Downlink speed will be shown as 1 Mbps, the same can be edited by using menu icon. Click on Edit Devices - Where you can edit the uplink speed and downlink speed.
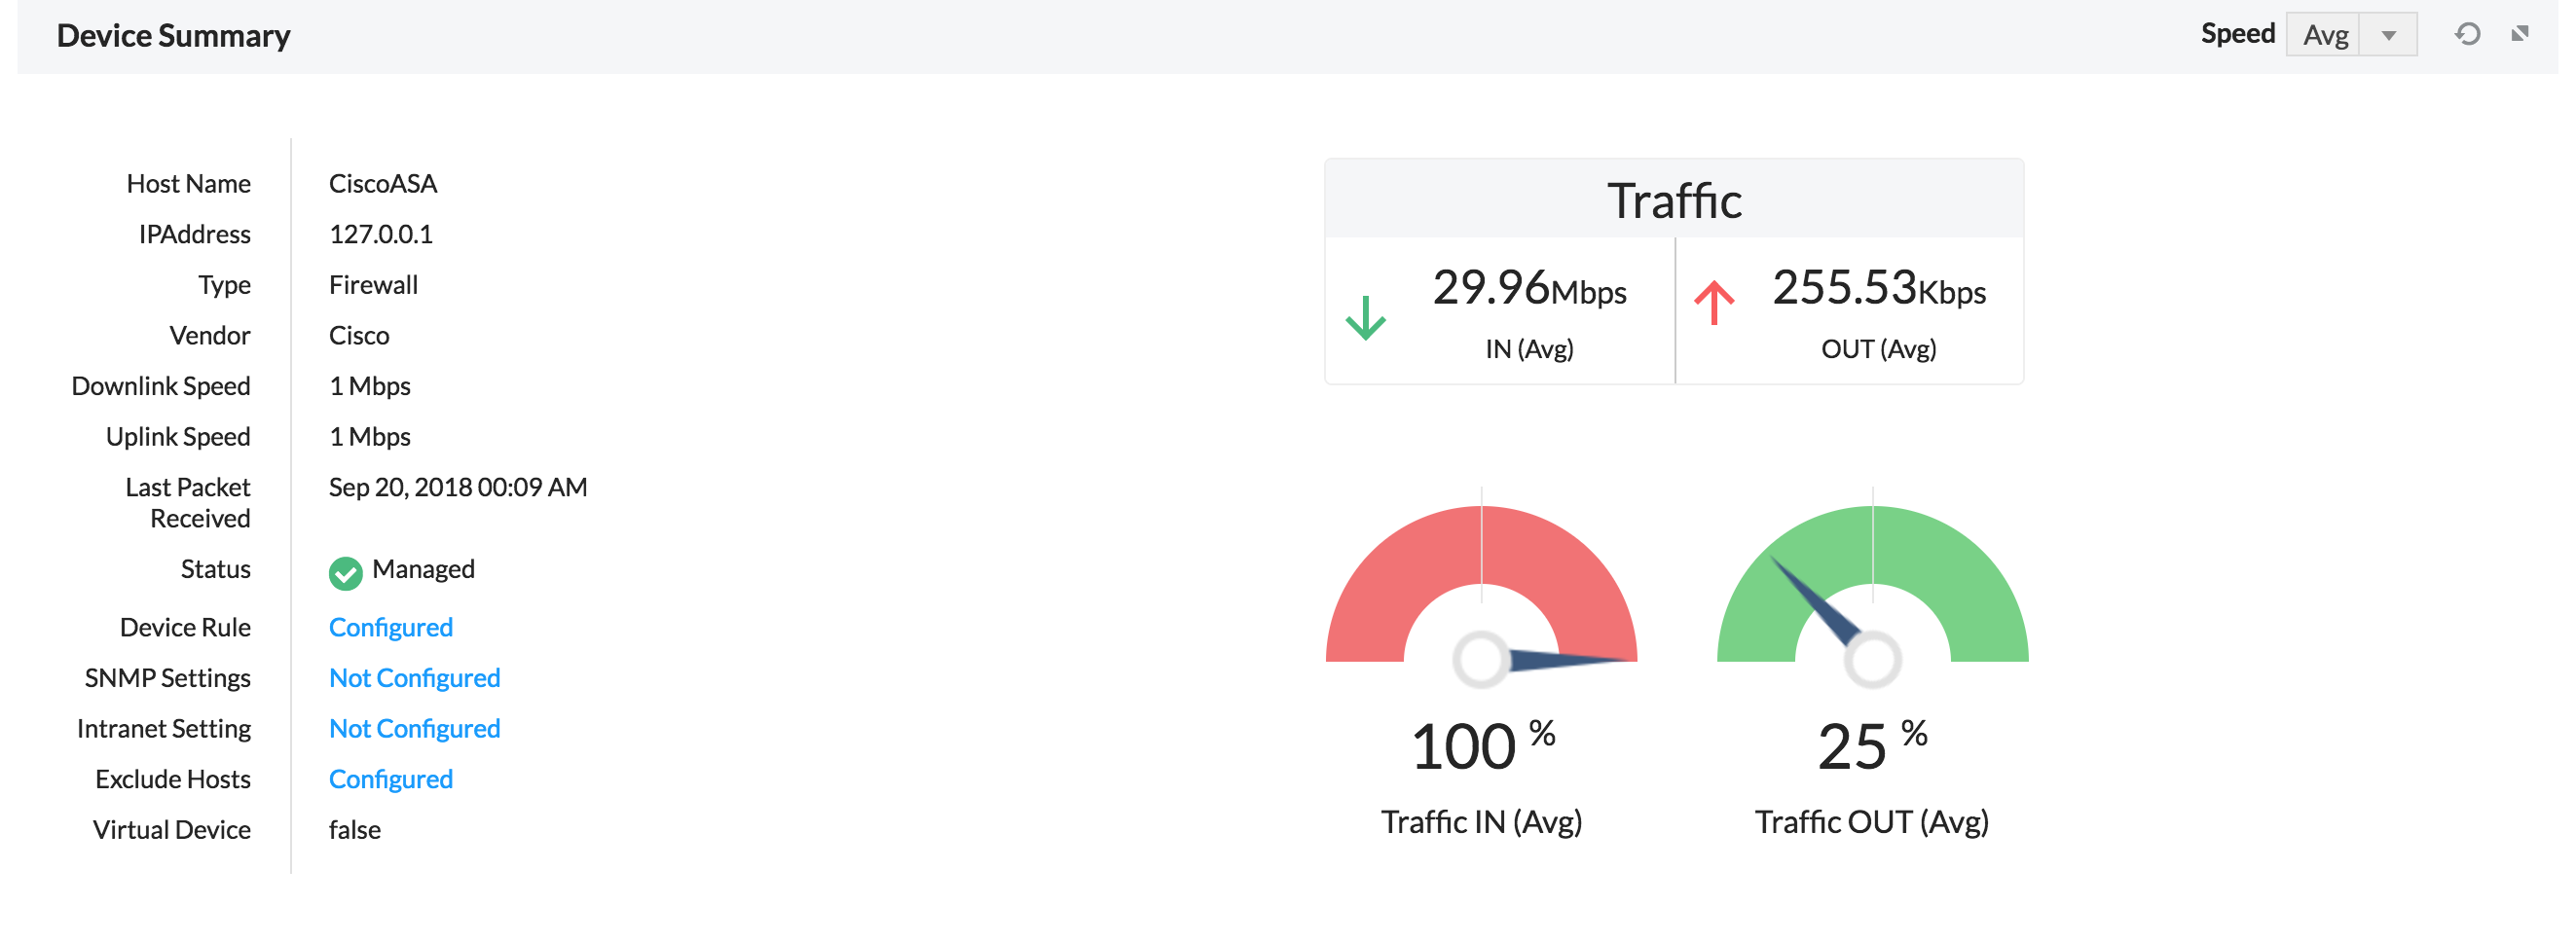
Device rule - Edit the device rule.
SNMP Settings - Edit the SNMP Settings.
Intranet settings - Edit the intranet settings.
Exclude Host - Exclude a host
2. Bandwidth- The traffic in and out of the firewall devices.
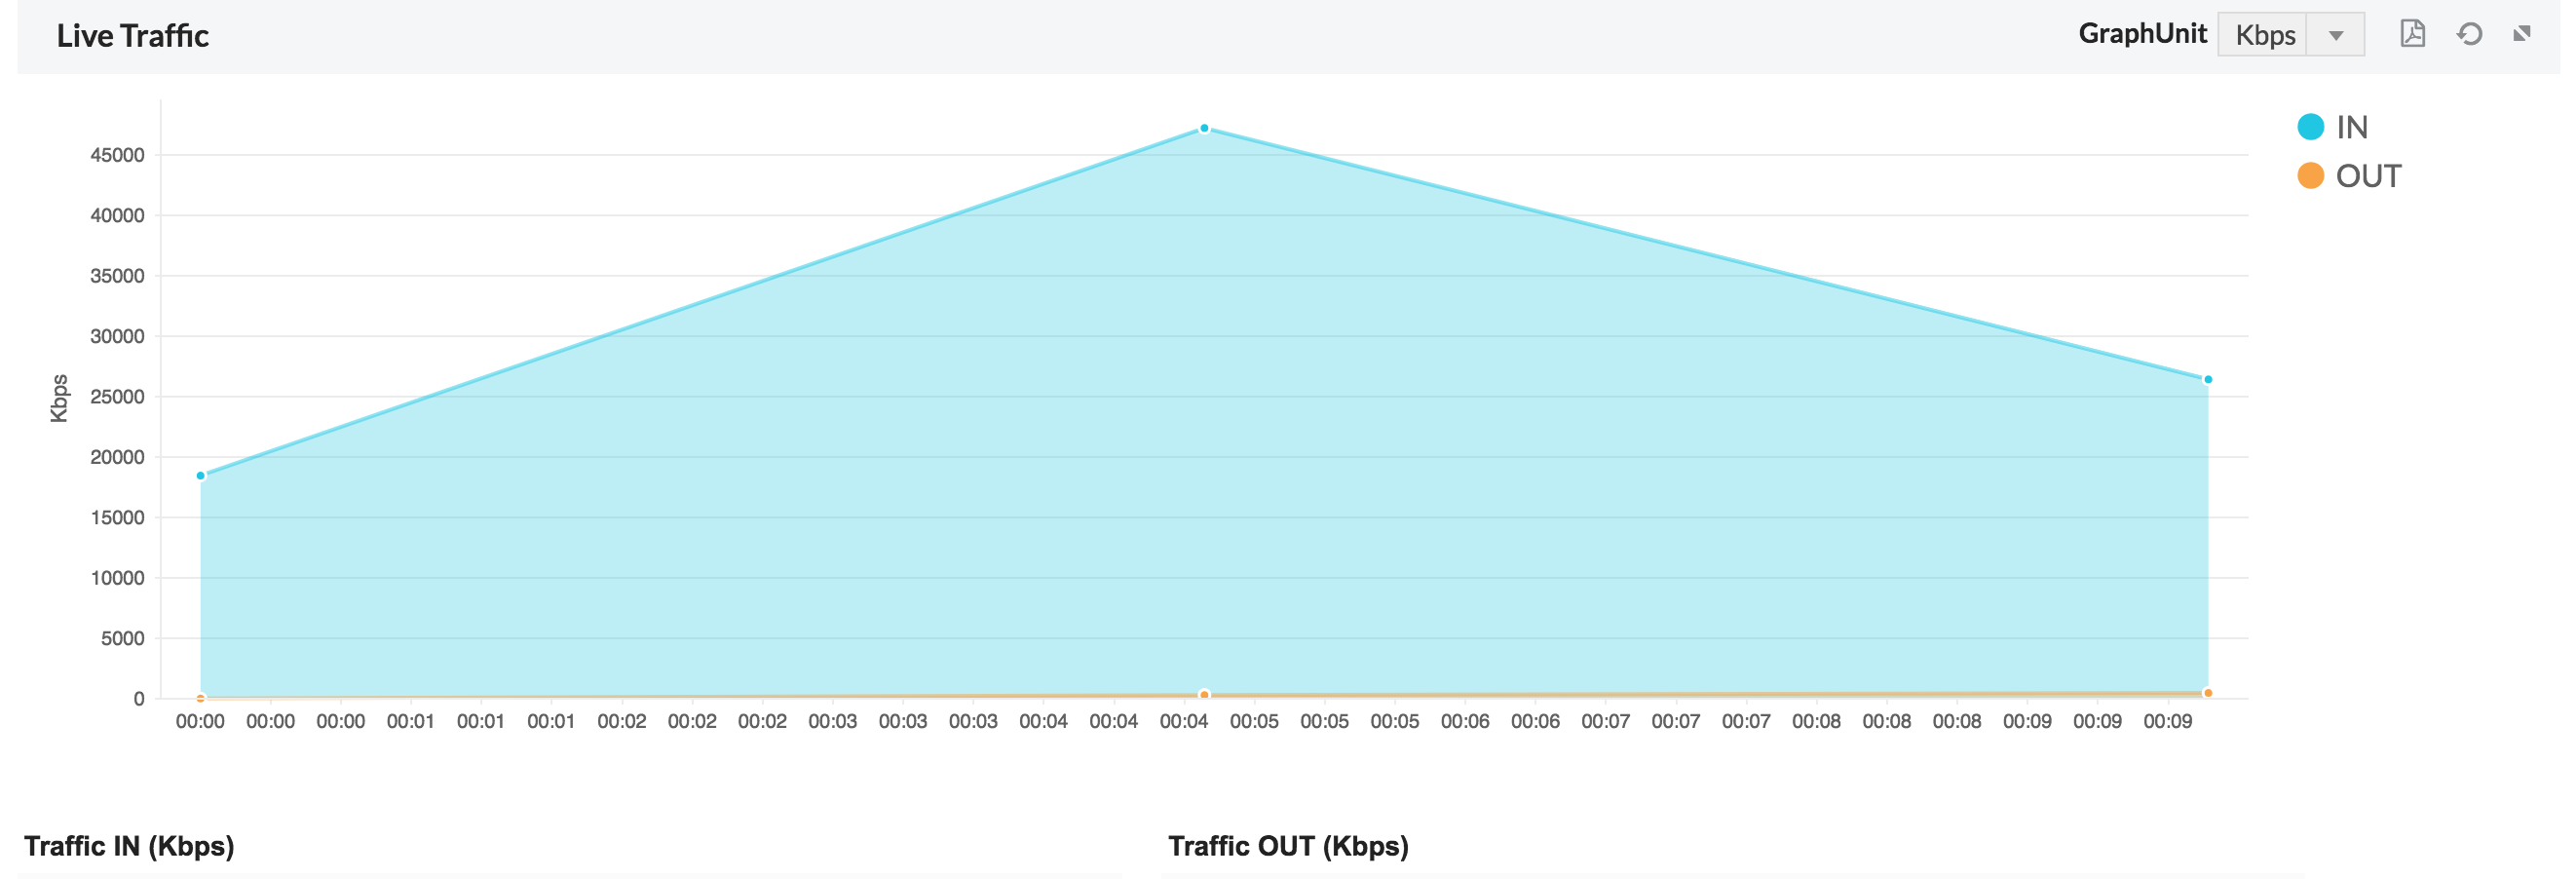
On clicking on the bandwidth report, a detailed bandwidth report "Inbound Traffic Conversations" is shown with the following fields.
| Source | The source IP |
| User | User triggering the inbound traffic |
| Destination | The destination IP |
| Time | Time stamp of when the traffic originated |
| Rule number | The rule used to access the IP |
| Protocol | The protocol used to access the IP |
| Severity | The severity of the inbound traffic |
| Duration | The duration of the traffic |
| Bytes | The number of bytes consumed |
3. Top 10- Gives the Top 10 host IP, Destination IP, Protocol groups, Internal server, external sites and conversations.
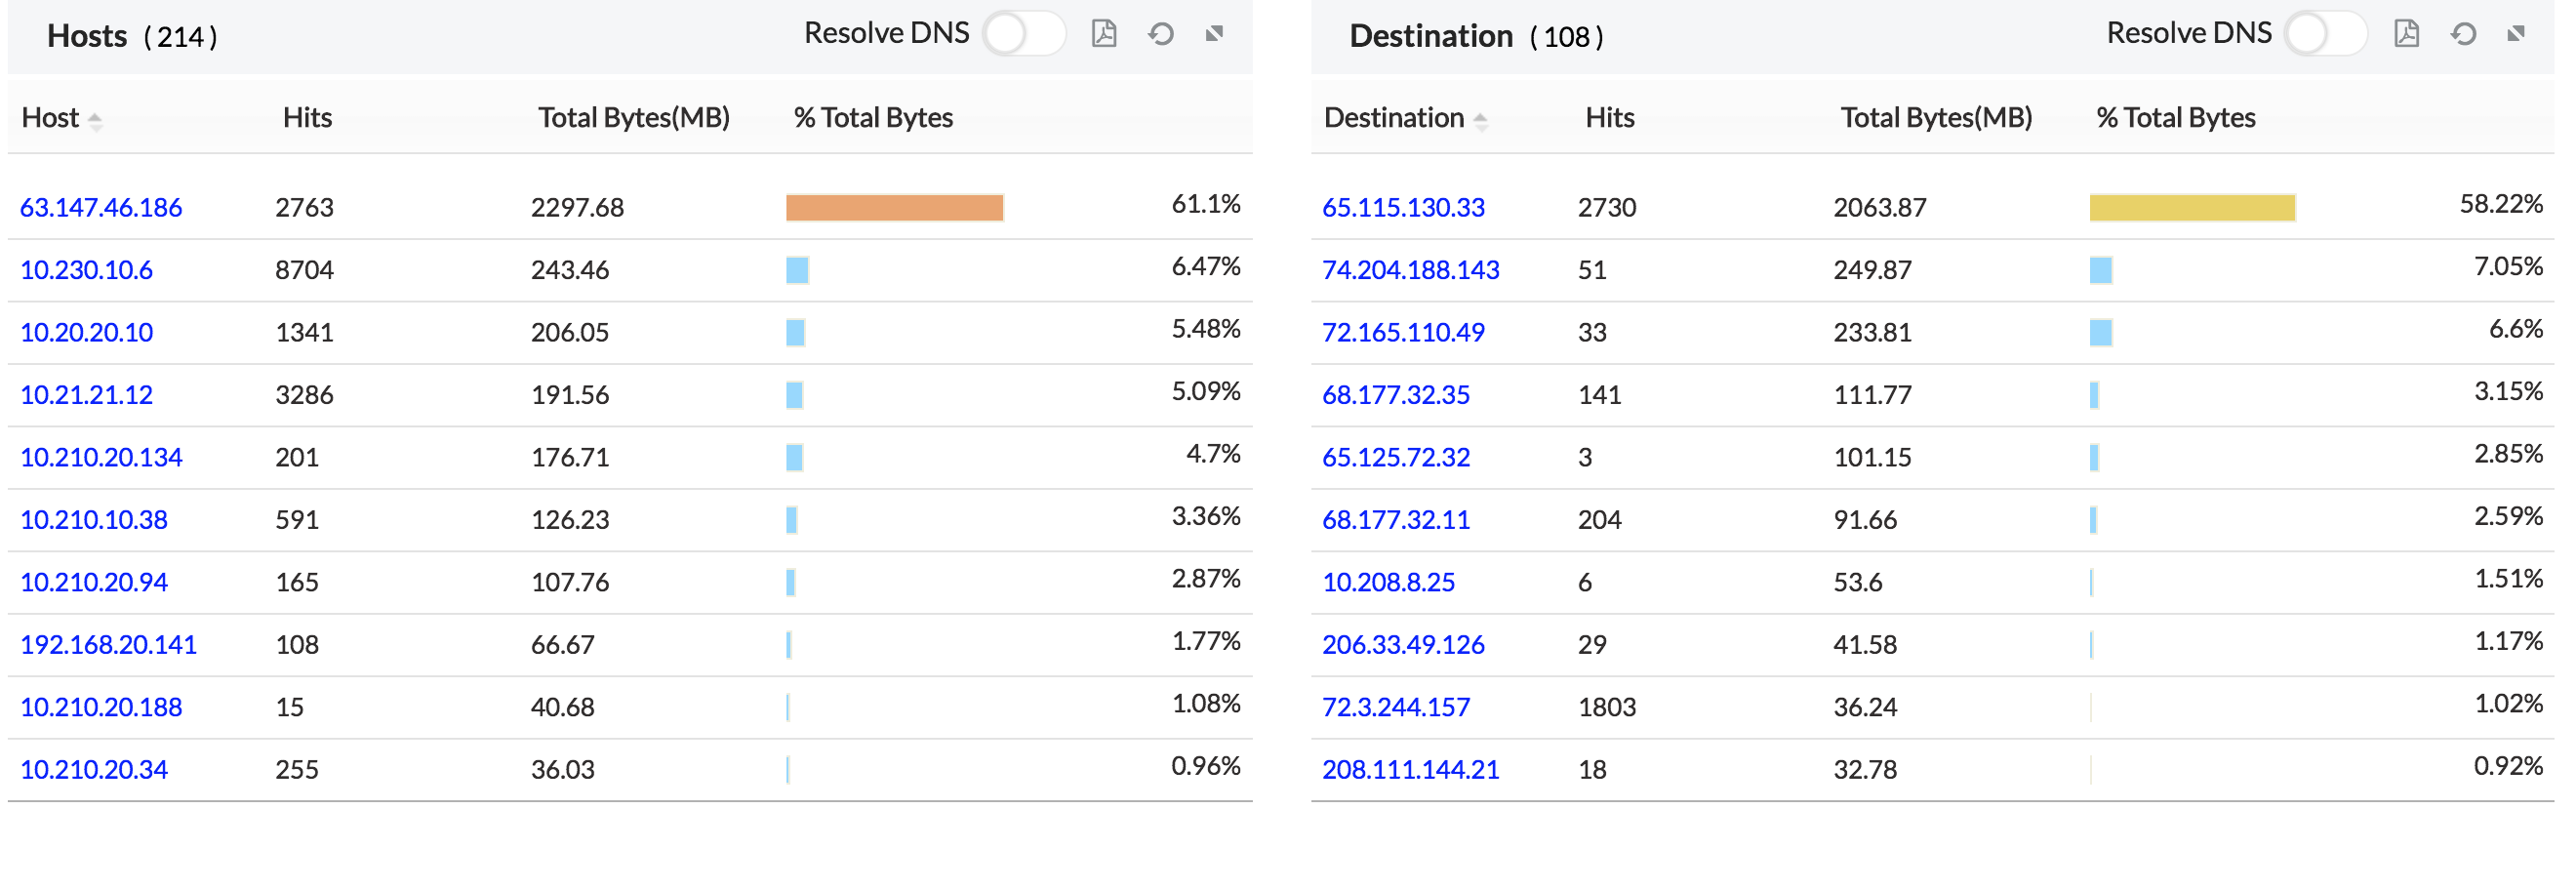
On clicking the individual host, you get a further drill down on the individual host.
On clicking the individual destination, you get a further drill down on the individual destination.
On clicking the individual protocol group, you get a further drill down on the individual protocol group.
On clicking the individual external site, you get a further drill down on the individual external site.
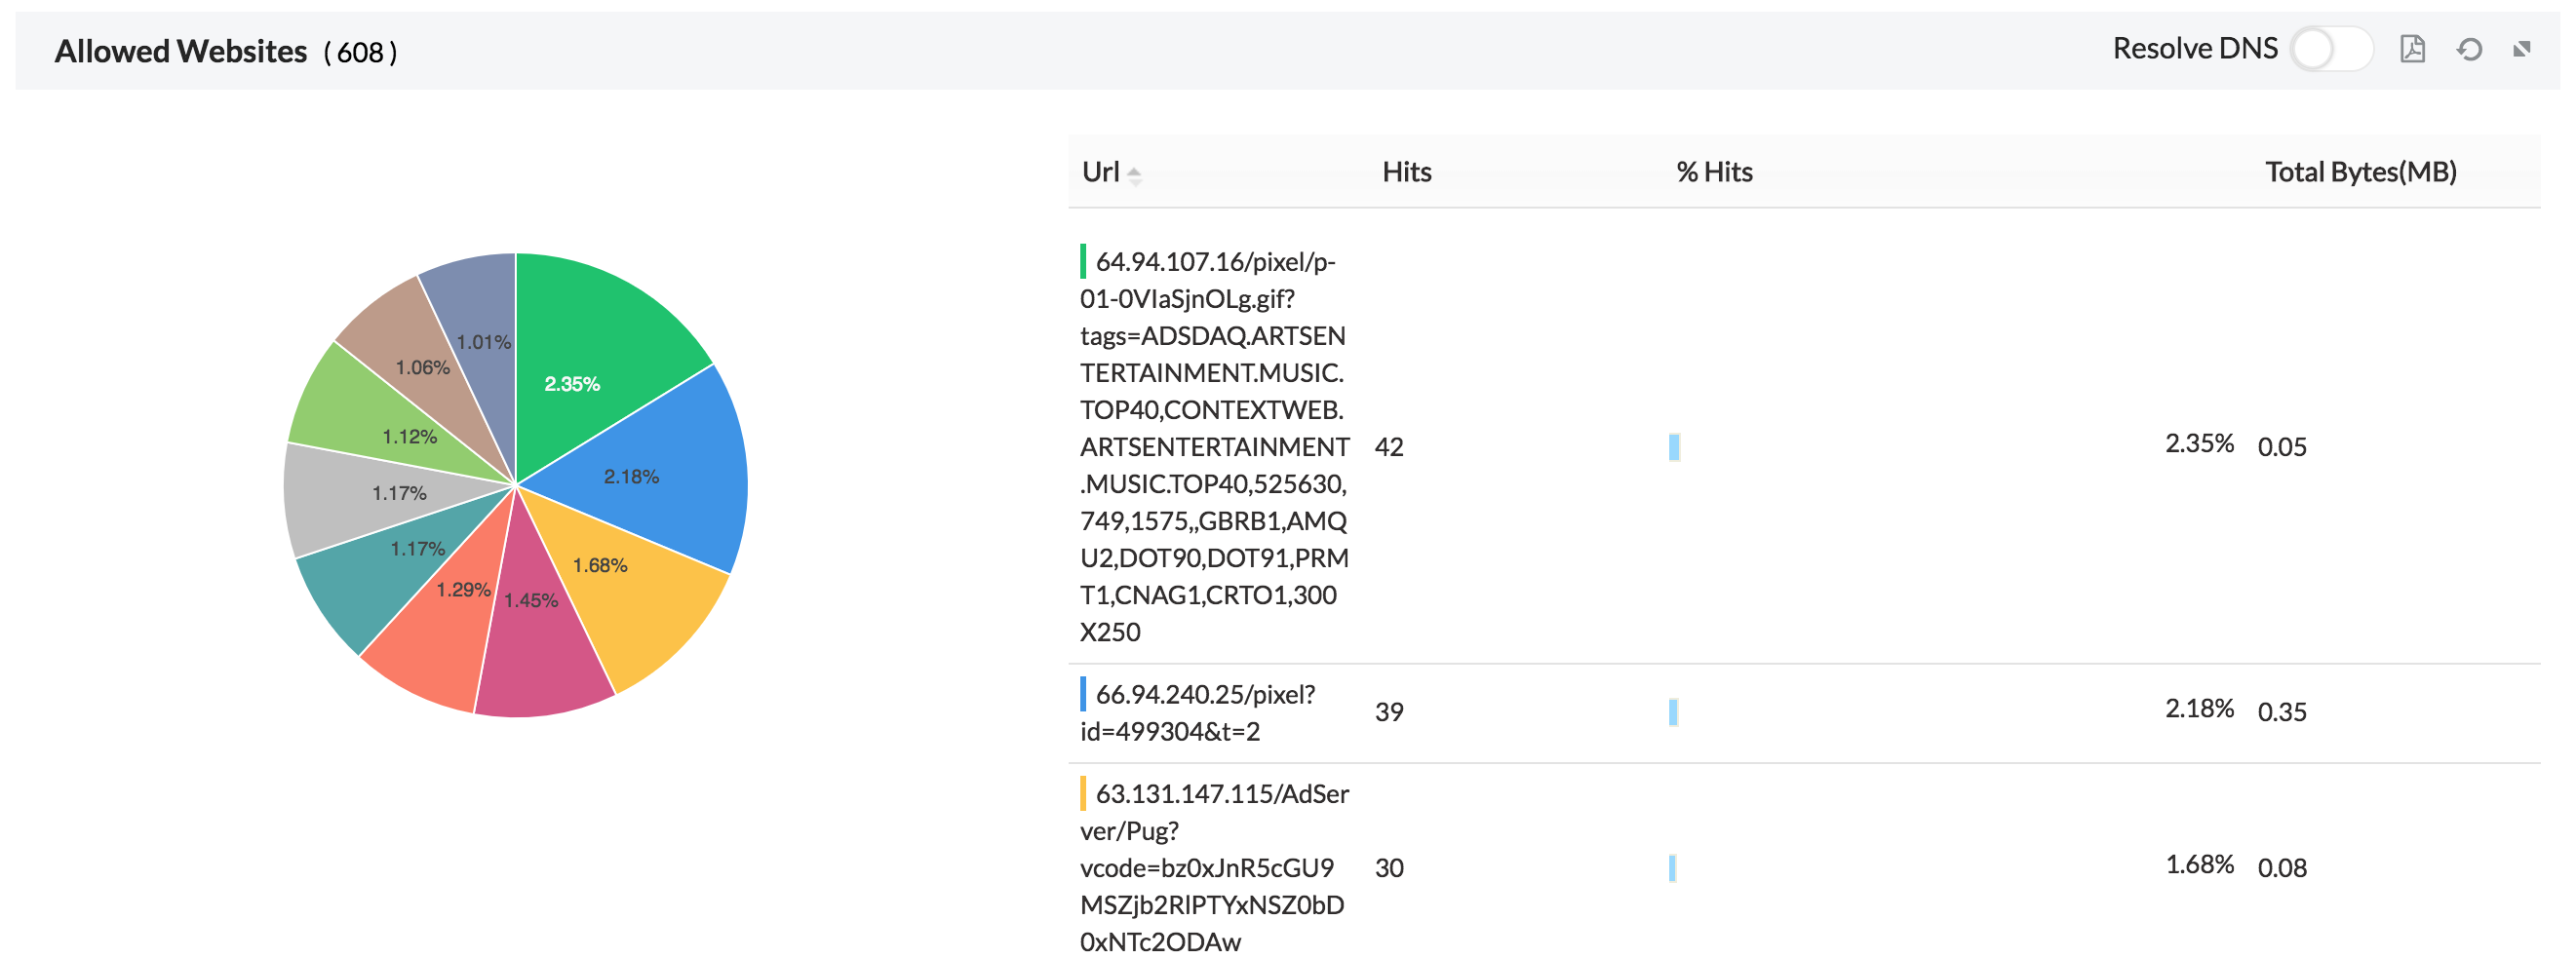
4. Sites- Gives the list and traffic of allowed sites accessed and denied sites attempted.
5. Apps- The applications which run via the devices are shown in the graph. We also show the application based on category.
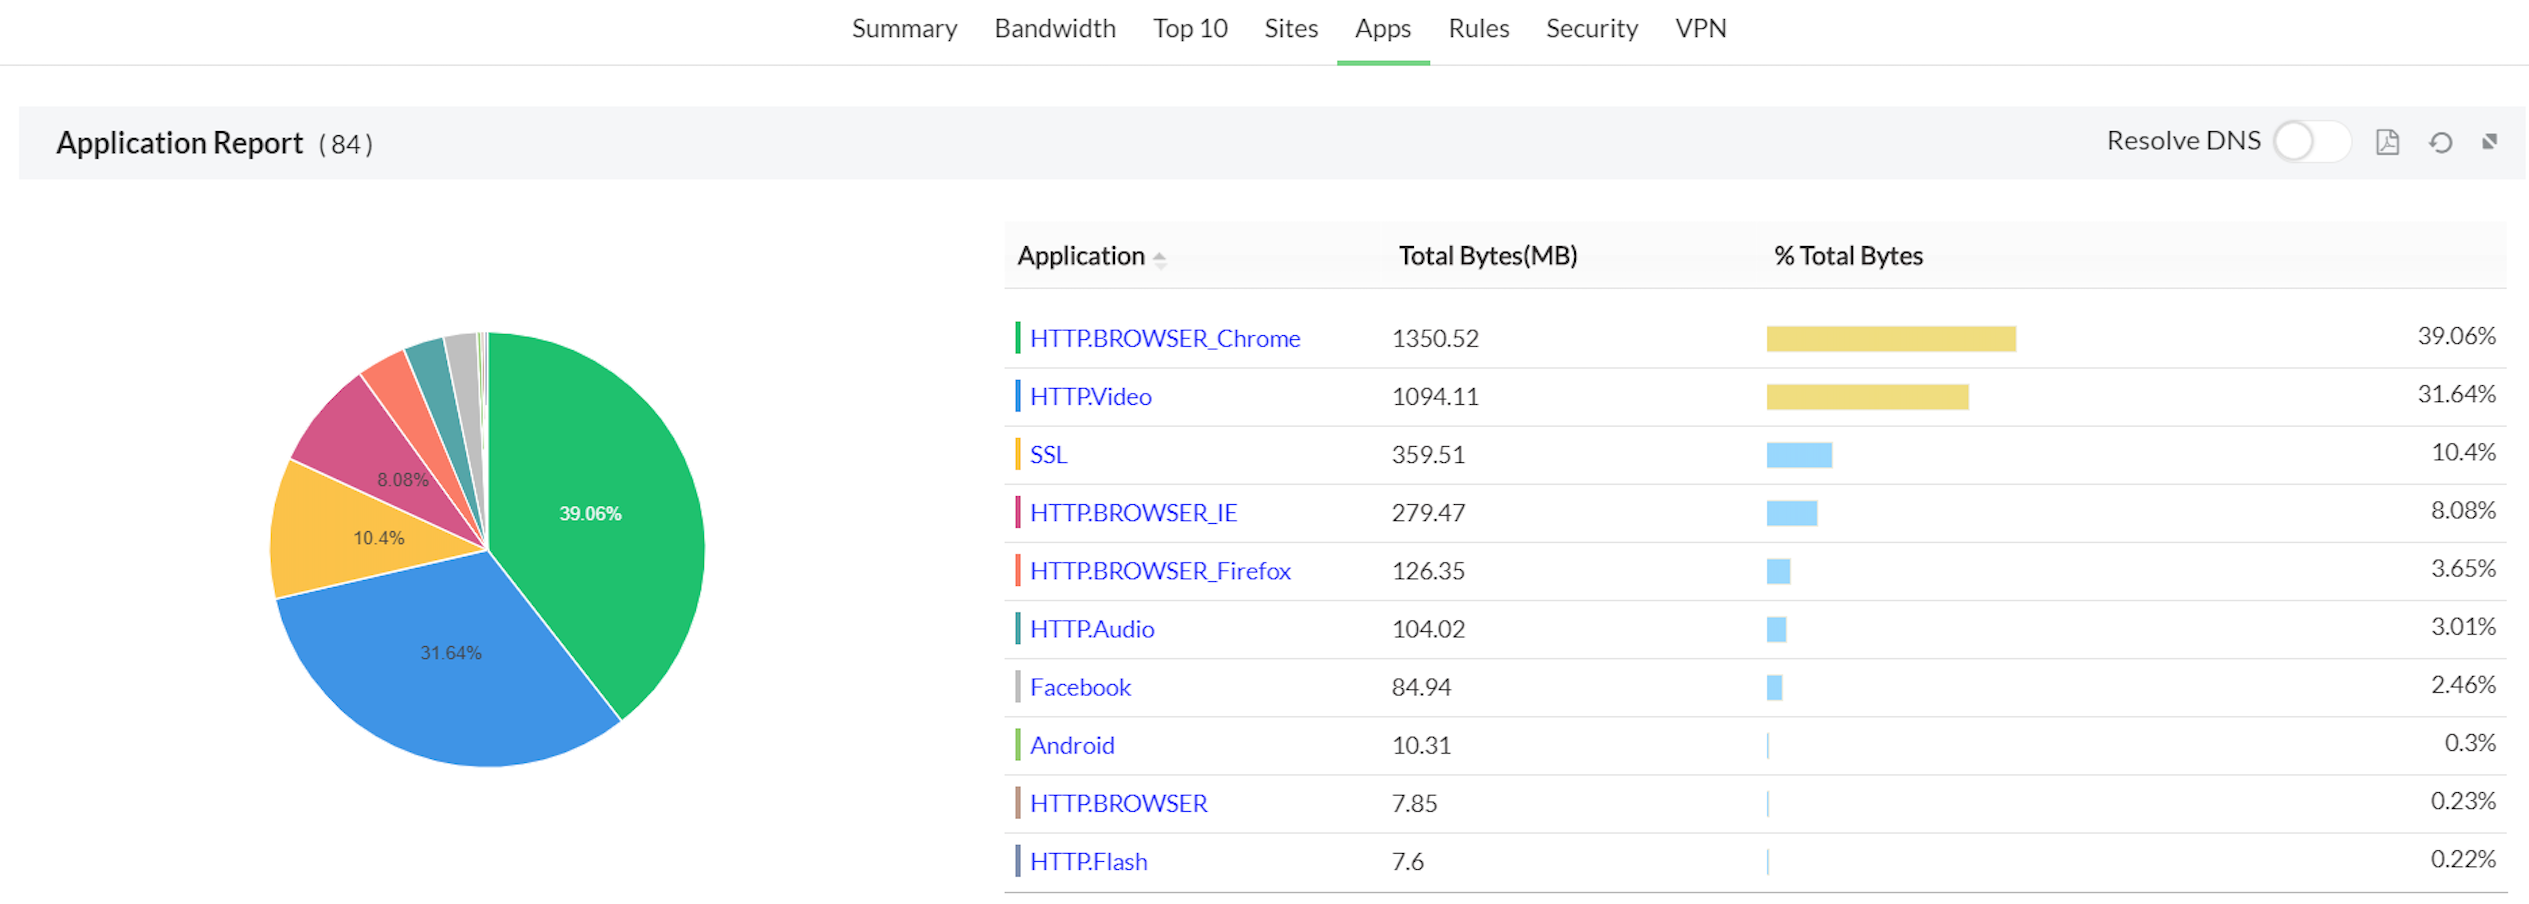
On clicking on the individual application we get a drill down on the following
On clicking on the individual application category we get a drill down on the following
Refer the Firewall Analyzer Supported Devices page for the list of devices for which Application Report is supported.
6. Rules- Gives the usage trend of Firewall rules, top allowed rules and top denied rules triggered.
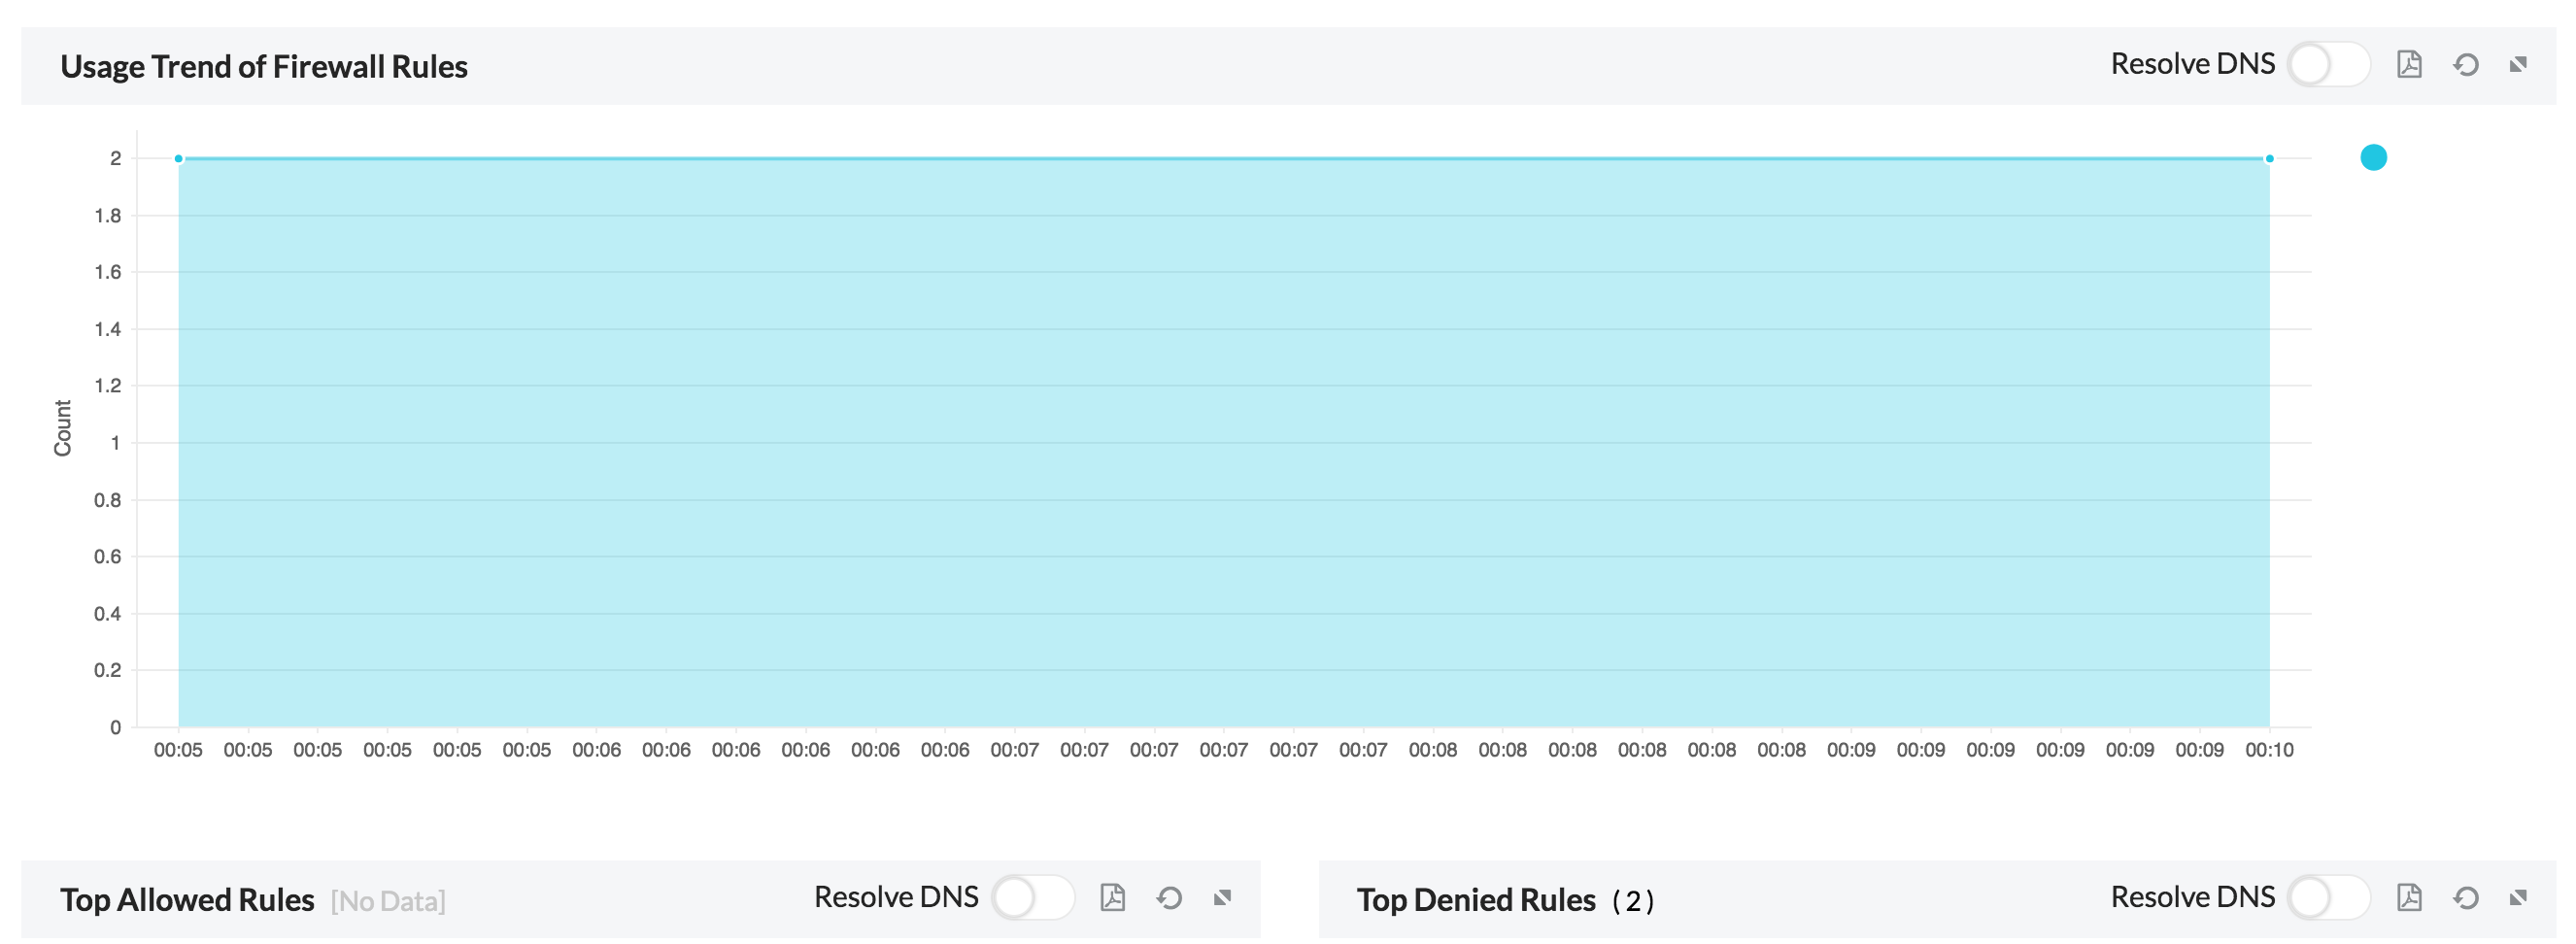
On clicking on the individual top allowed and denied rules, we get a drill down on the following:
7. Security- Gives an overview of security stats, top attacks, top virus attacks, top denied host IP, top denied destination IP and denied user logon.
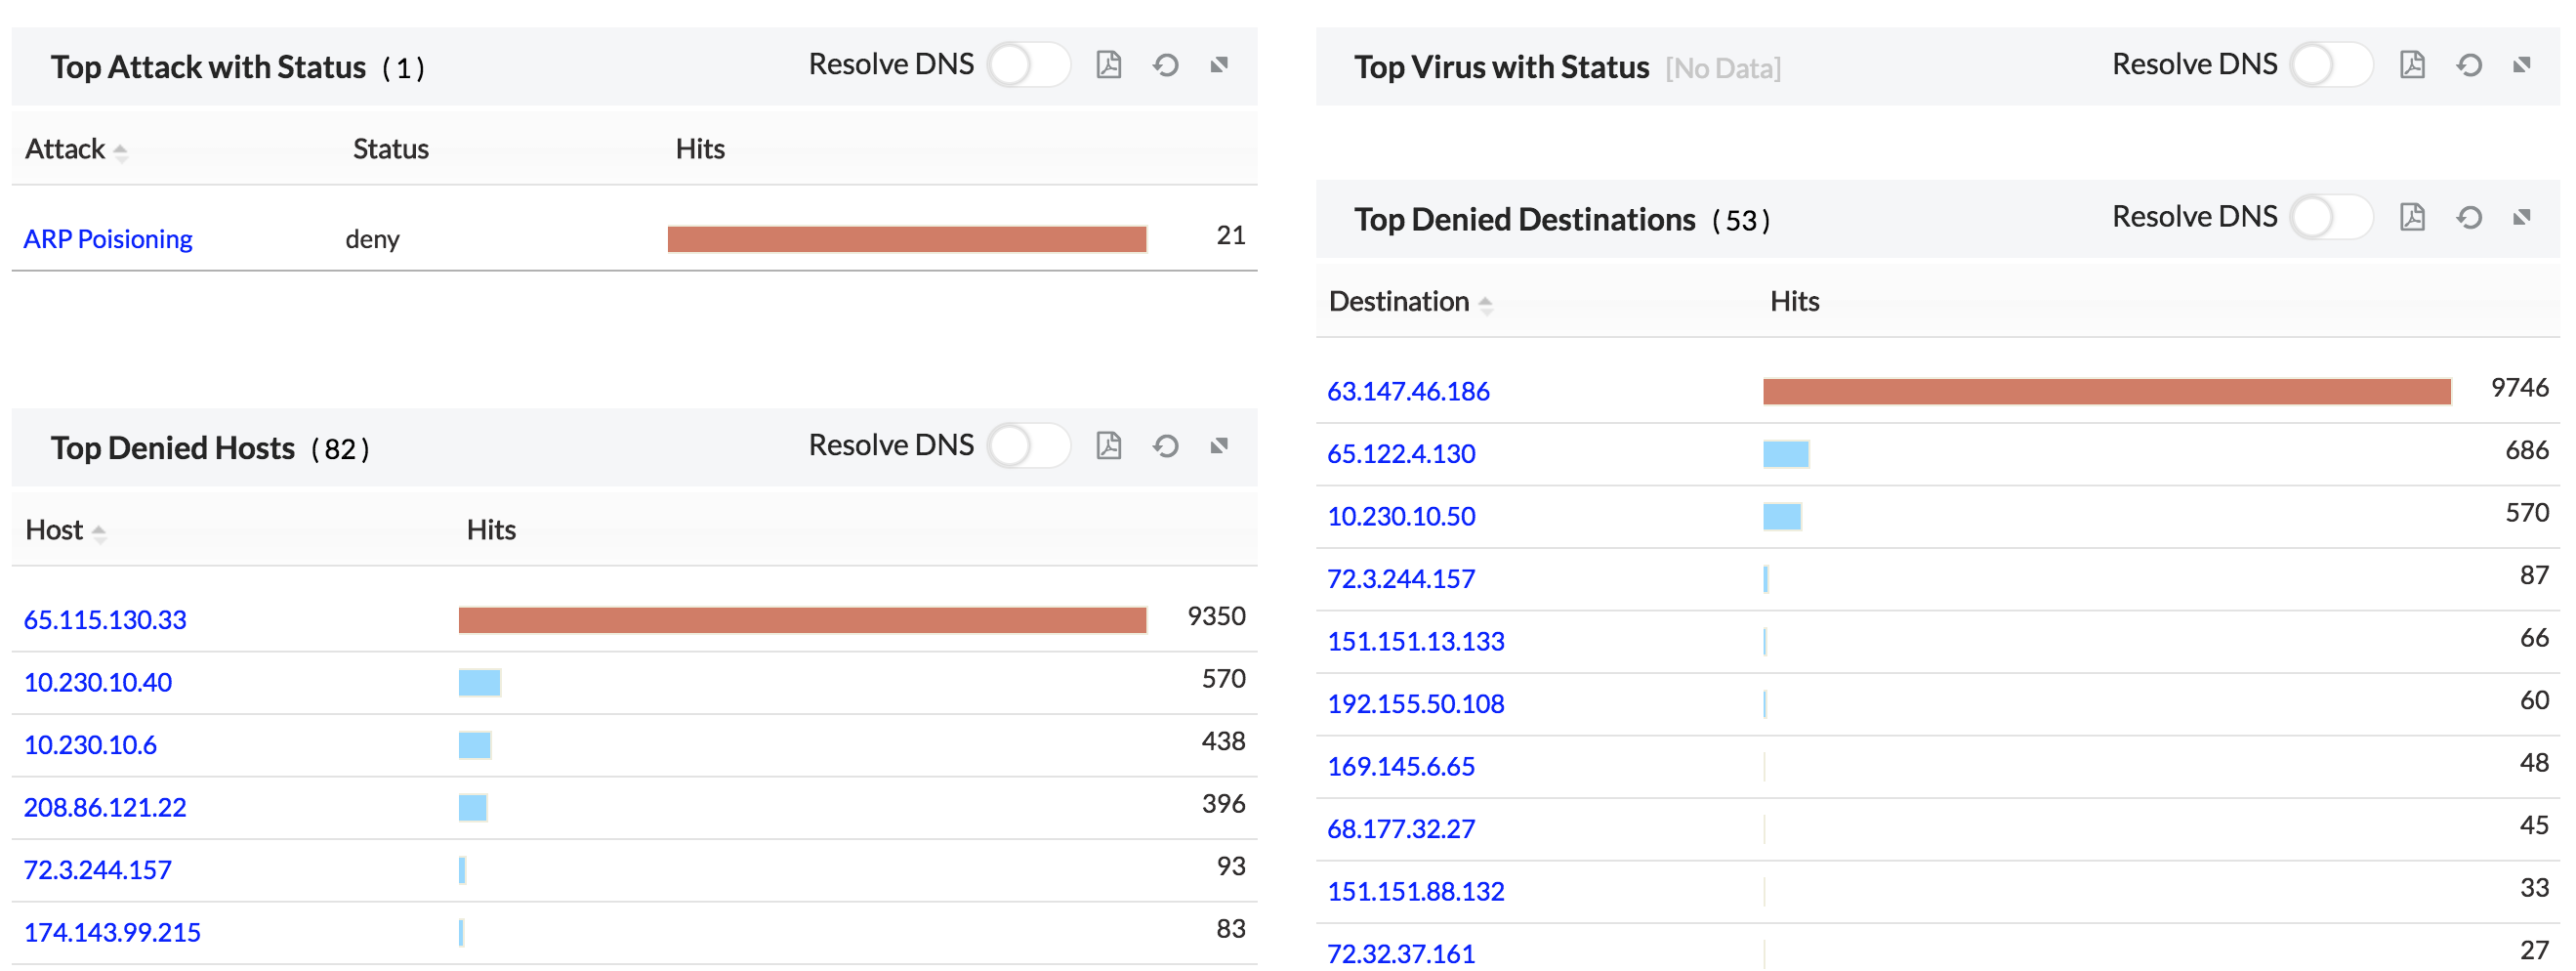
On clicking on the individual Attack and Virus we get a drill down on the following
| Host | The Host IP of the attack/virus |
| Destination | The destination IP of the attack/virus |
| Protocol | The protocol used to attack |
| Severity | The severity of the attack/virus |
| Hits | The number of hits |
| Subtype | The subtype of the attack/virus |
| Status | The Status of the attack/virus |
8.VPN- The VPNs connecting via the device.

Thank you for your feedback!