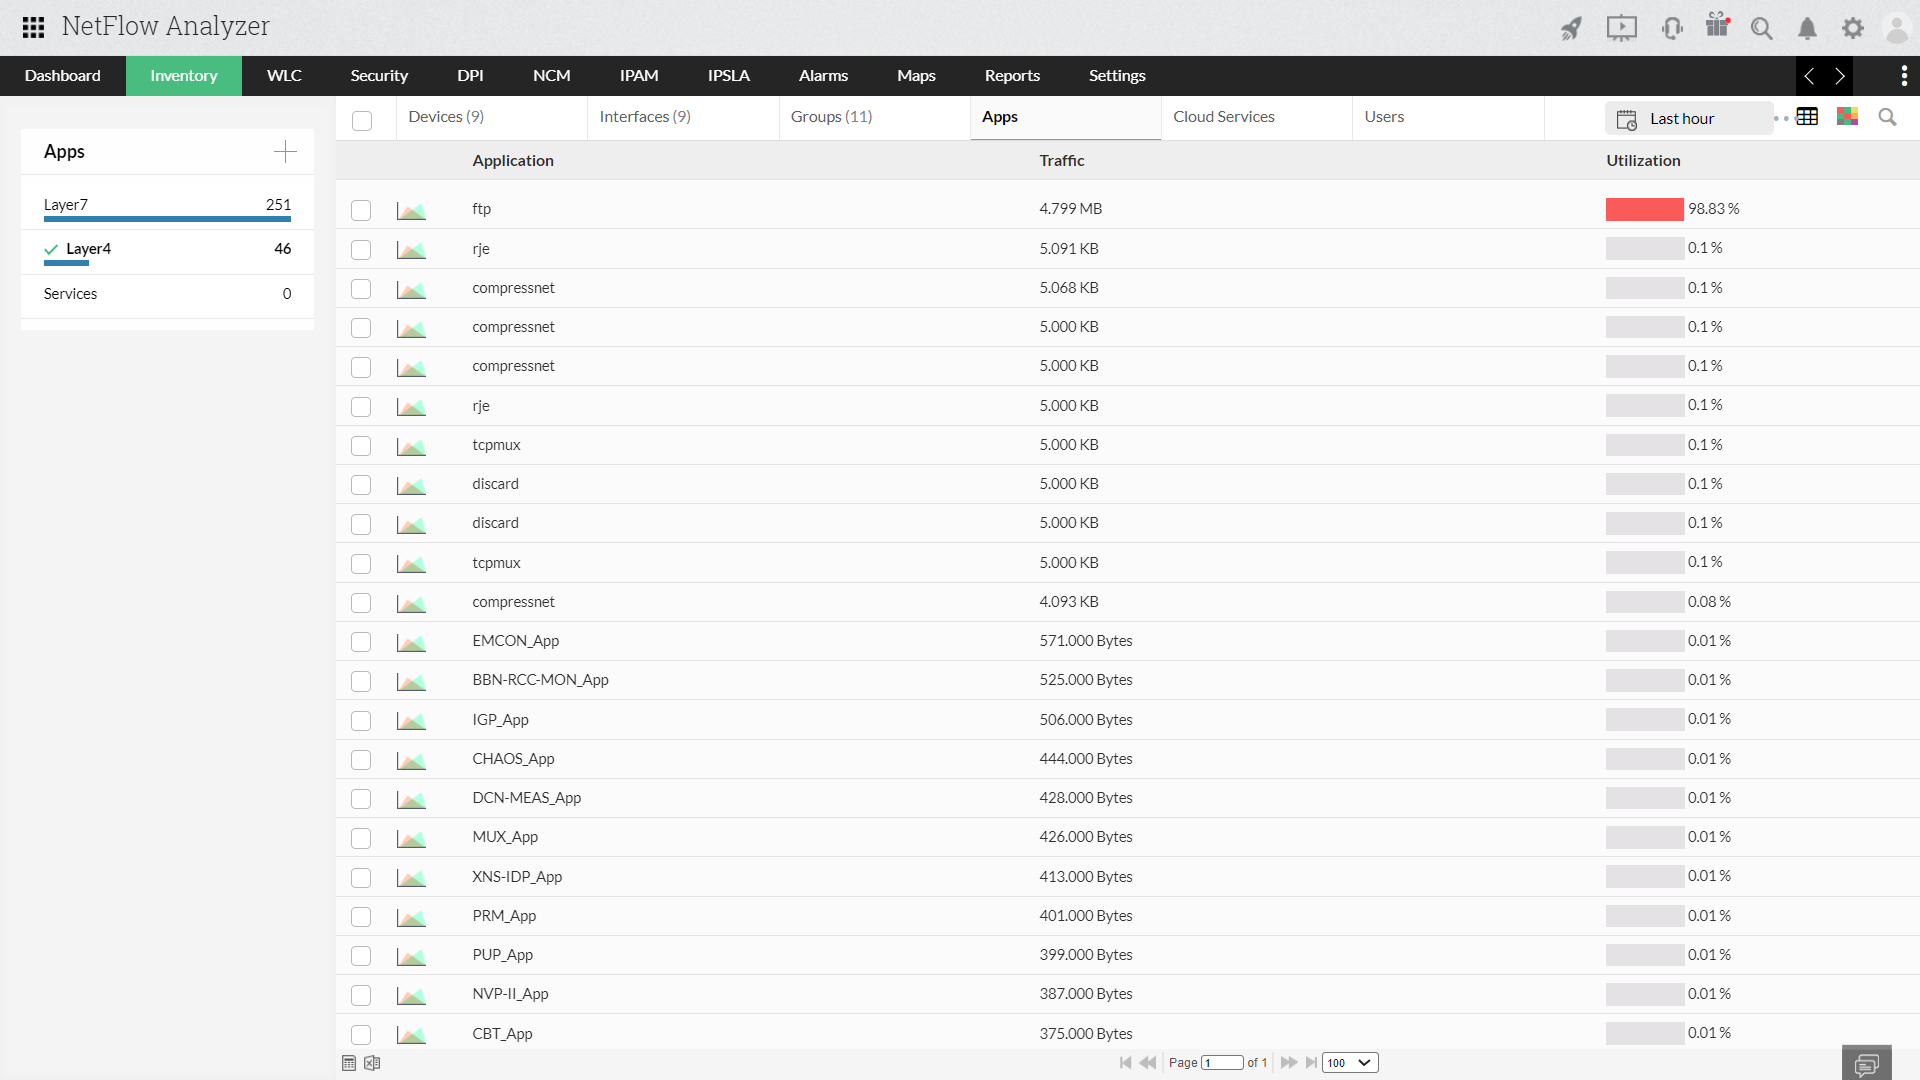
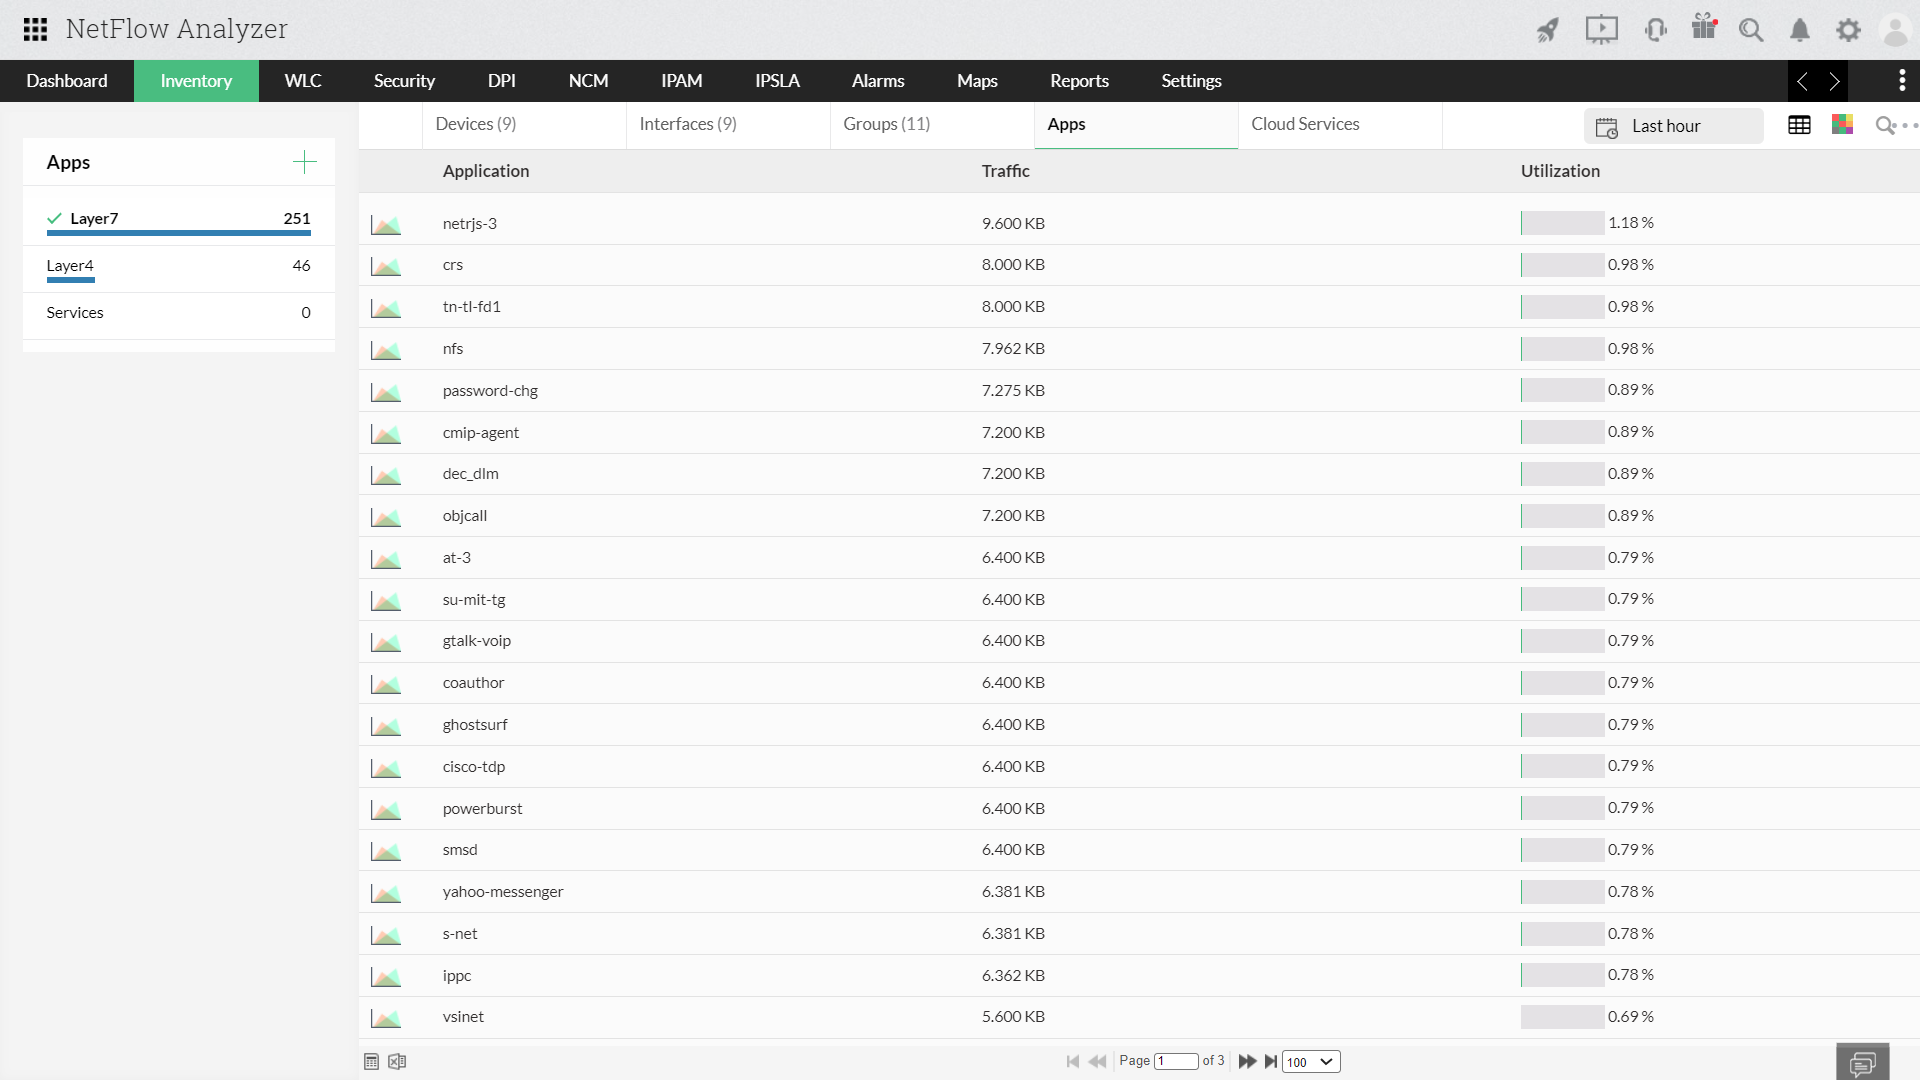
This view provides the information on Top 10 Layer 4 and Layer 7 application and its traffic utilization.
Layer 4 pplications are the application that are categorized based on the port and protocol mapping available in NetFlow Analyzer. We have around 10,000 + port and protocol mapping available based on IANA standards in NetFlow Analyzer to get the application details.
You can customize the Widget to view the information for different time periods like Last 30 mins, Hourly, 6 Hours, 24 Hours, Today and Yesterday by clicking on the edit icon on the right top of the Widget.

Layer 7 application have the NBAR based application information that can be exported by Cisco Devices. If the device is configured to export NBAR information we show this information.
You can customize the Widget to view the information for different time periods like Last 30 mins, Hourly, 6 Hours, 24 Hours, Today and Yesterday by clicking on the edit icon on the right top of the Widget.

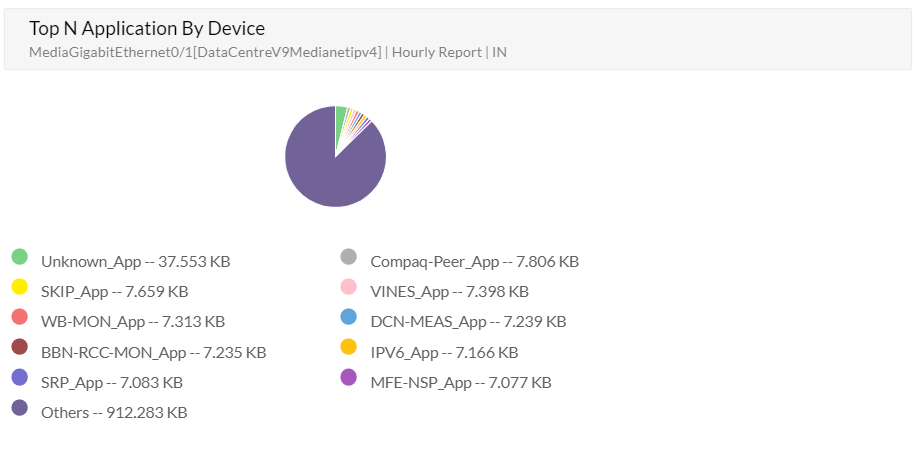
The table gives a glance about the top 10 Application and its utilization based on the Devices.
You can customize the Widget to view the information based on Interfaces, Interface group or IP groups for different time periods like Last 30 mins, Hourly, 6 Hours, 24 Hours, Today and Yesterday for IN and OUT direction by selecting the Flow Type option by clicking on the edit icon on the right top of the Widget.

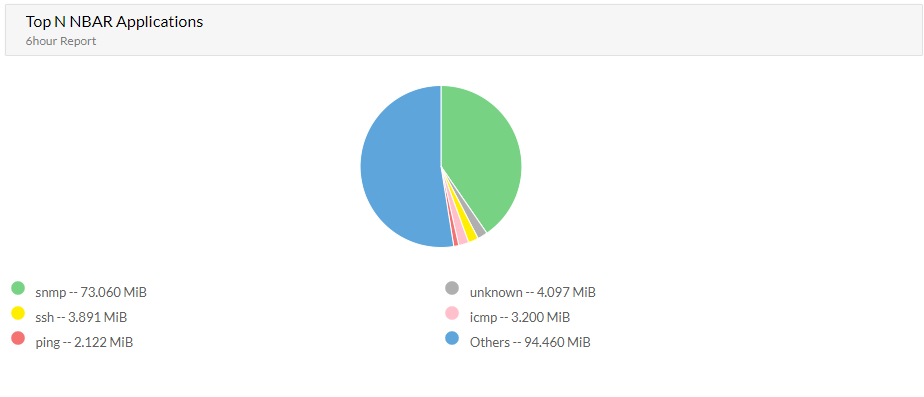
The table gives a glance of the top Applications and its utilization based on the Volume consumption.
You can customize the Widget to view the information based on the Device, Interfaces, Interface group or IP groups for different time periods like Last 30 mins, Hourly, 6 Hours, 24 Hours, Today and Yesterday for IN and OUT direction by selecting the Flow Type option by clicking on the edit icon on the right top of the Widget.

Thank you for your feedback!