Network Packet Sensor: The latest agent for eliminating all your bandwidth woes

Analyzing network traffic can be challenging when you need to pinpoint an actual problem. There are two widely used standards to analyze network traffic in detail: flow analysis and packet capture. The predominantly used flow analysis, such as NetFlow, sFlow, or any other flow-based methods, gives a very effective and broad view of what's happening across the network, including any abnormalities in network traffic. With this method, you won't require much storage space as the data is sampled. You can easily analyze network traffic abnormalities by drilling down into individual conversations and troubleshoot issues without allocating more resources, time, or memory.

Packet capture works on the concept of mirroring of the data packets and is useful for deep packet inspection, measuring response times of applications, and monitoring server and network and user behavior. This technique is also useful for extensive analysis of certain areas where specific information is wanted. Despite its effectiveness, it is not necessary in all cases. To analyze and manage traffic, you can choose a technique that combines the benefits of both these approaches.

Get in-depth visibility into your network traffic with the Network Packet Sensor

The Network Packet Sensor, a new addition to our comprehensive bandwidth monitoring tool NetFlow Analyzer, uses both flow analysis and packet capture methods. This agent will provide you with in-depth insights about which element is at fault, whether its the network, server, or application.

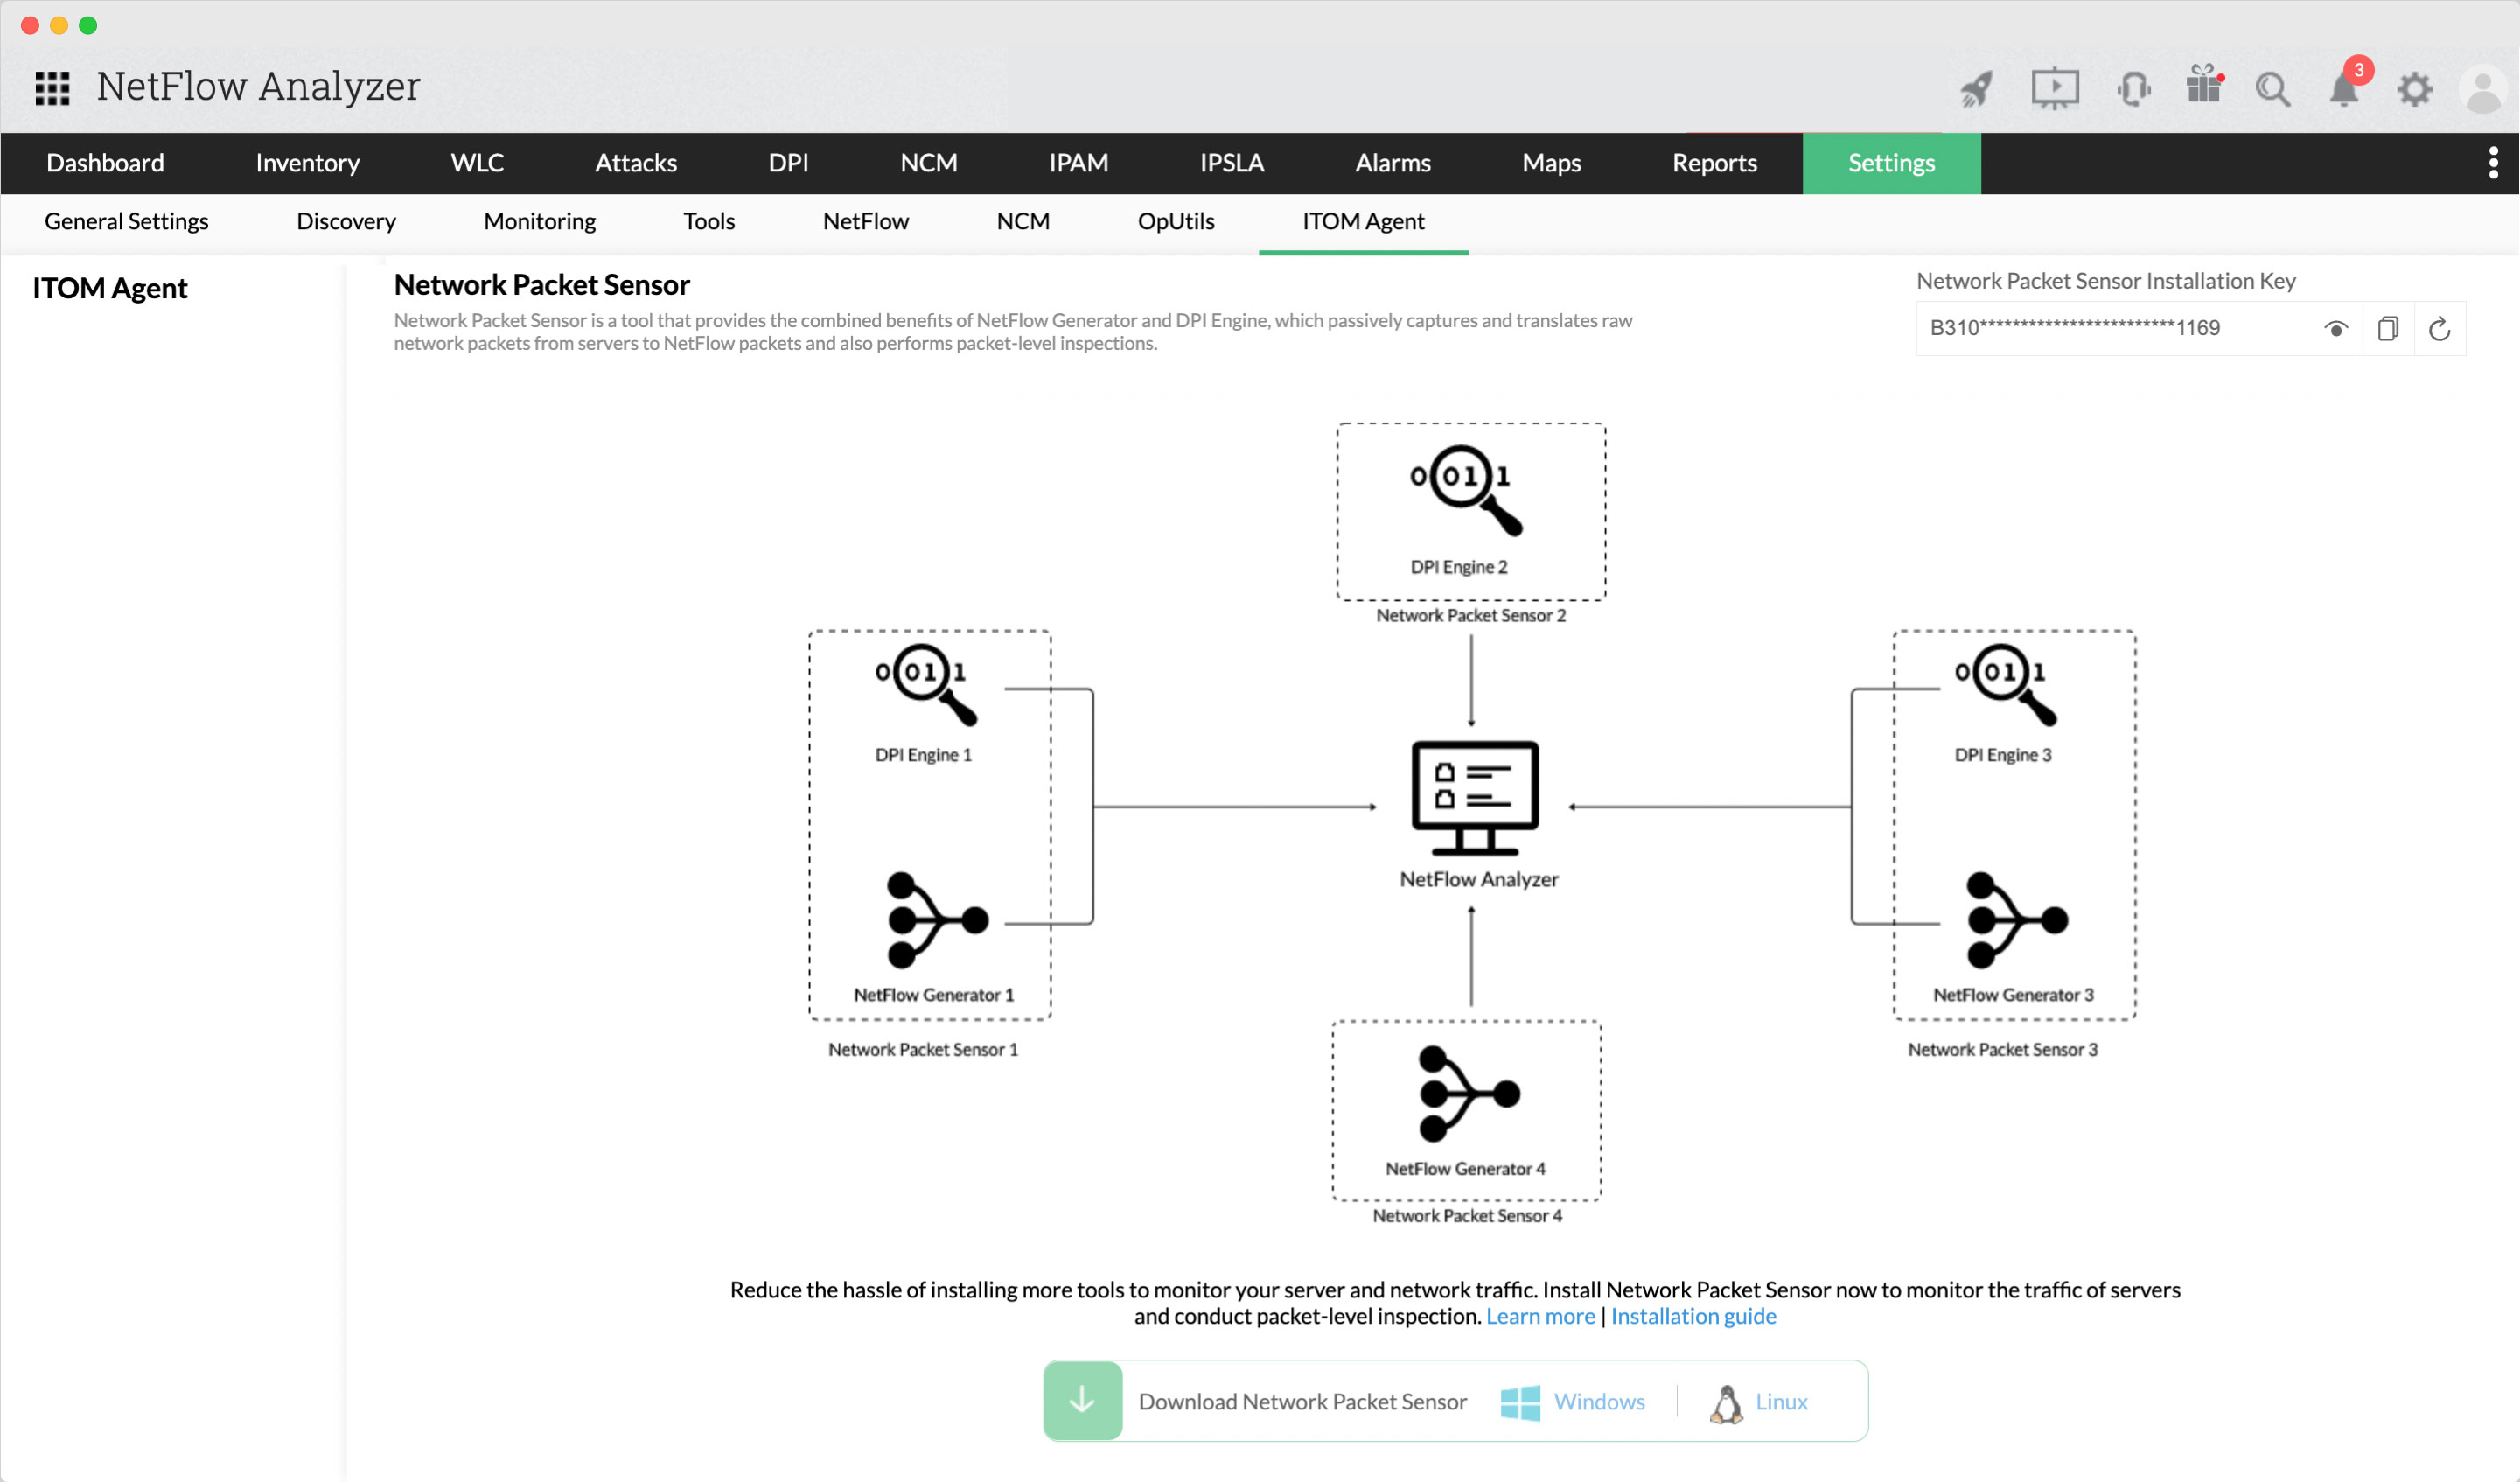
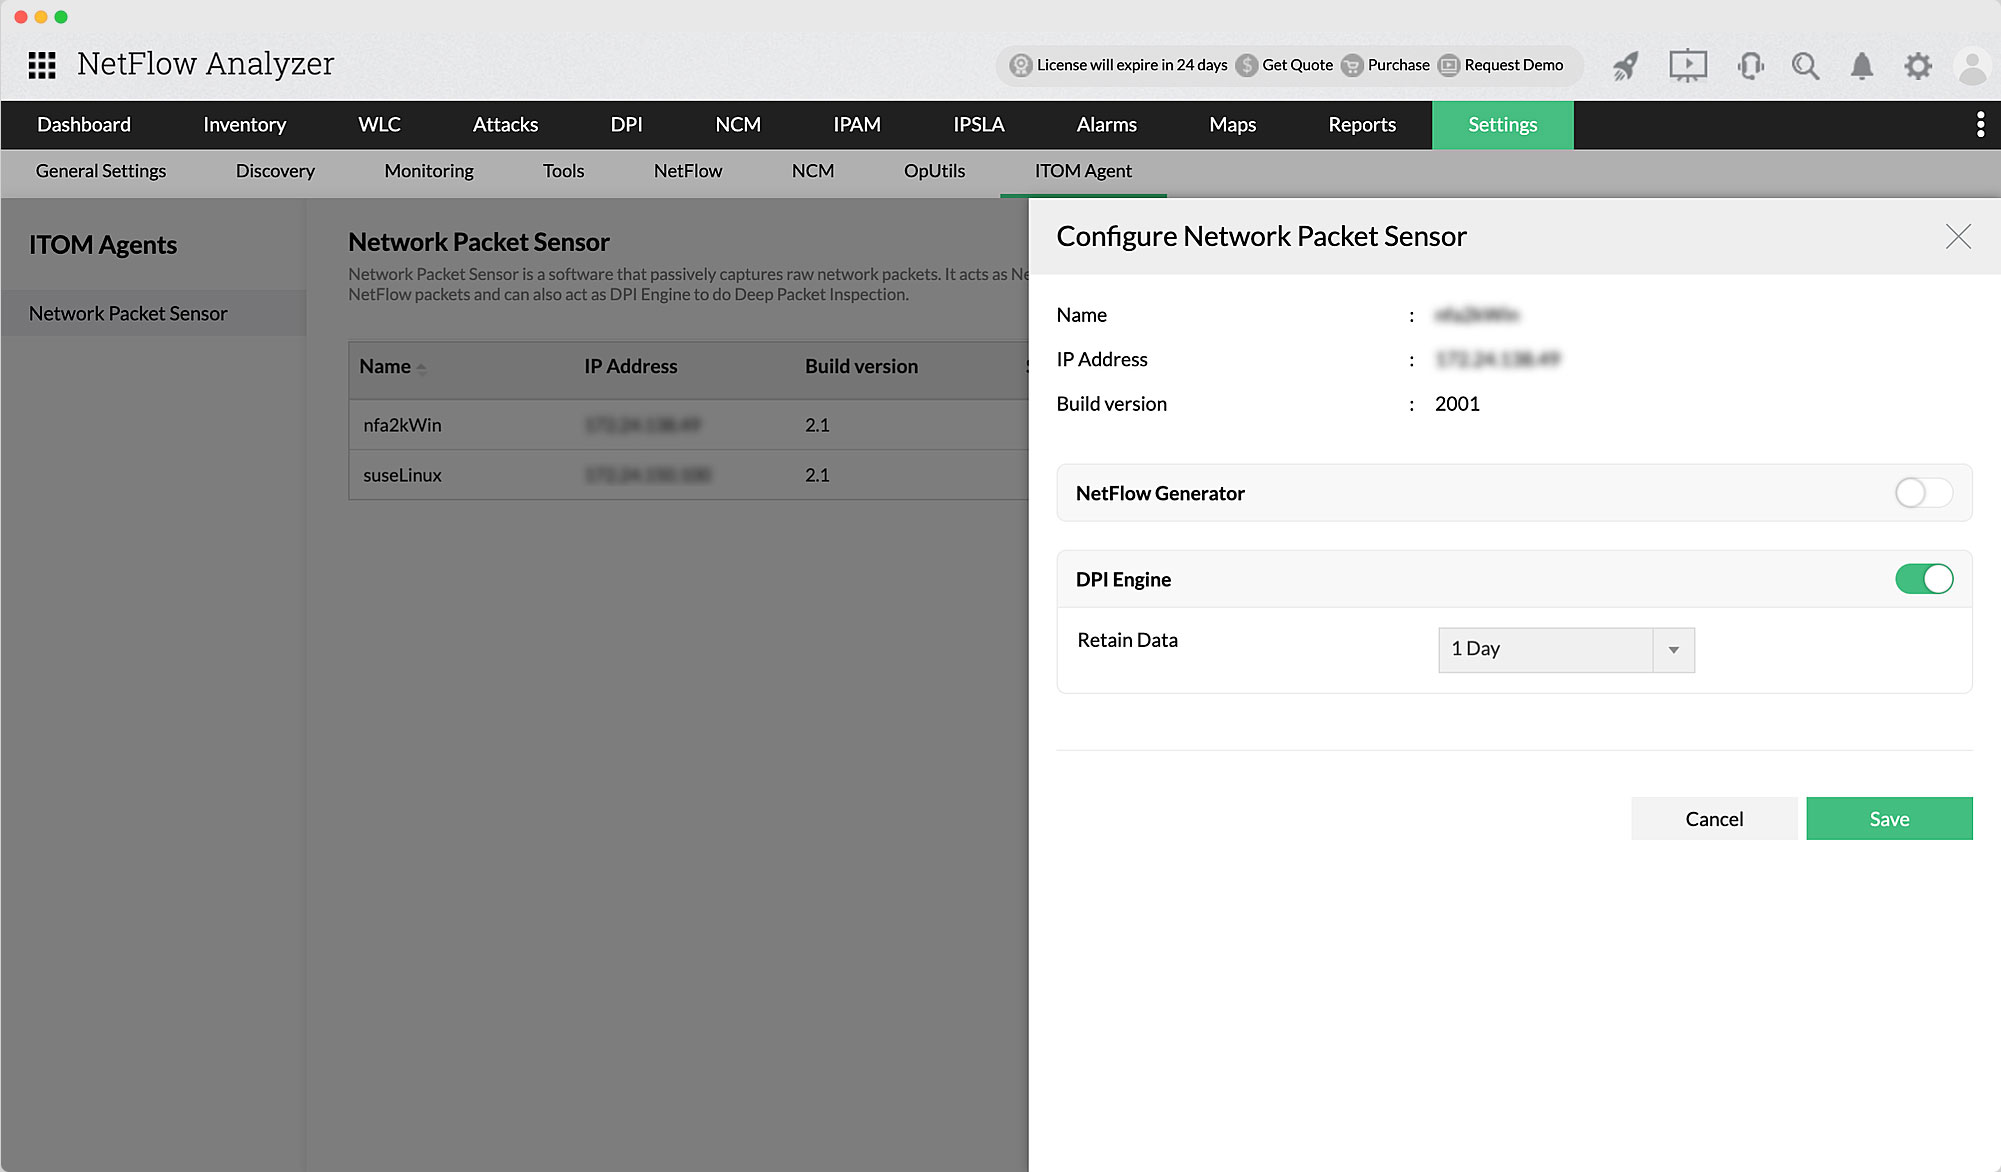
The Network Packet Sensor combines the functions of NetFlow Generator and deep packet inspection (DPI). The Network Packet Sensor can either be configured as a NetFlow Generator, a deep packet inspection engine, or both depending on your requirements.

How will the Network Packet Sensor make your traffic monitoring process easier?

Server traffic and bandwidth usage monitoring

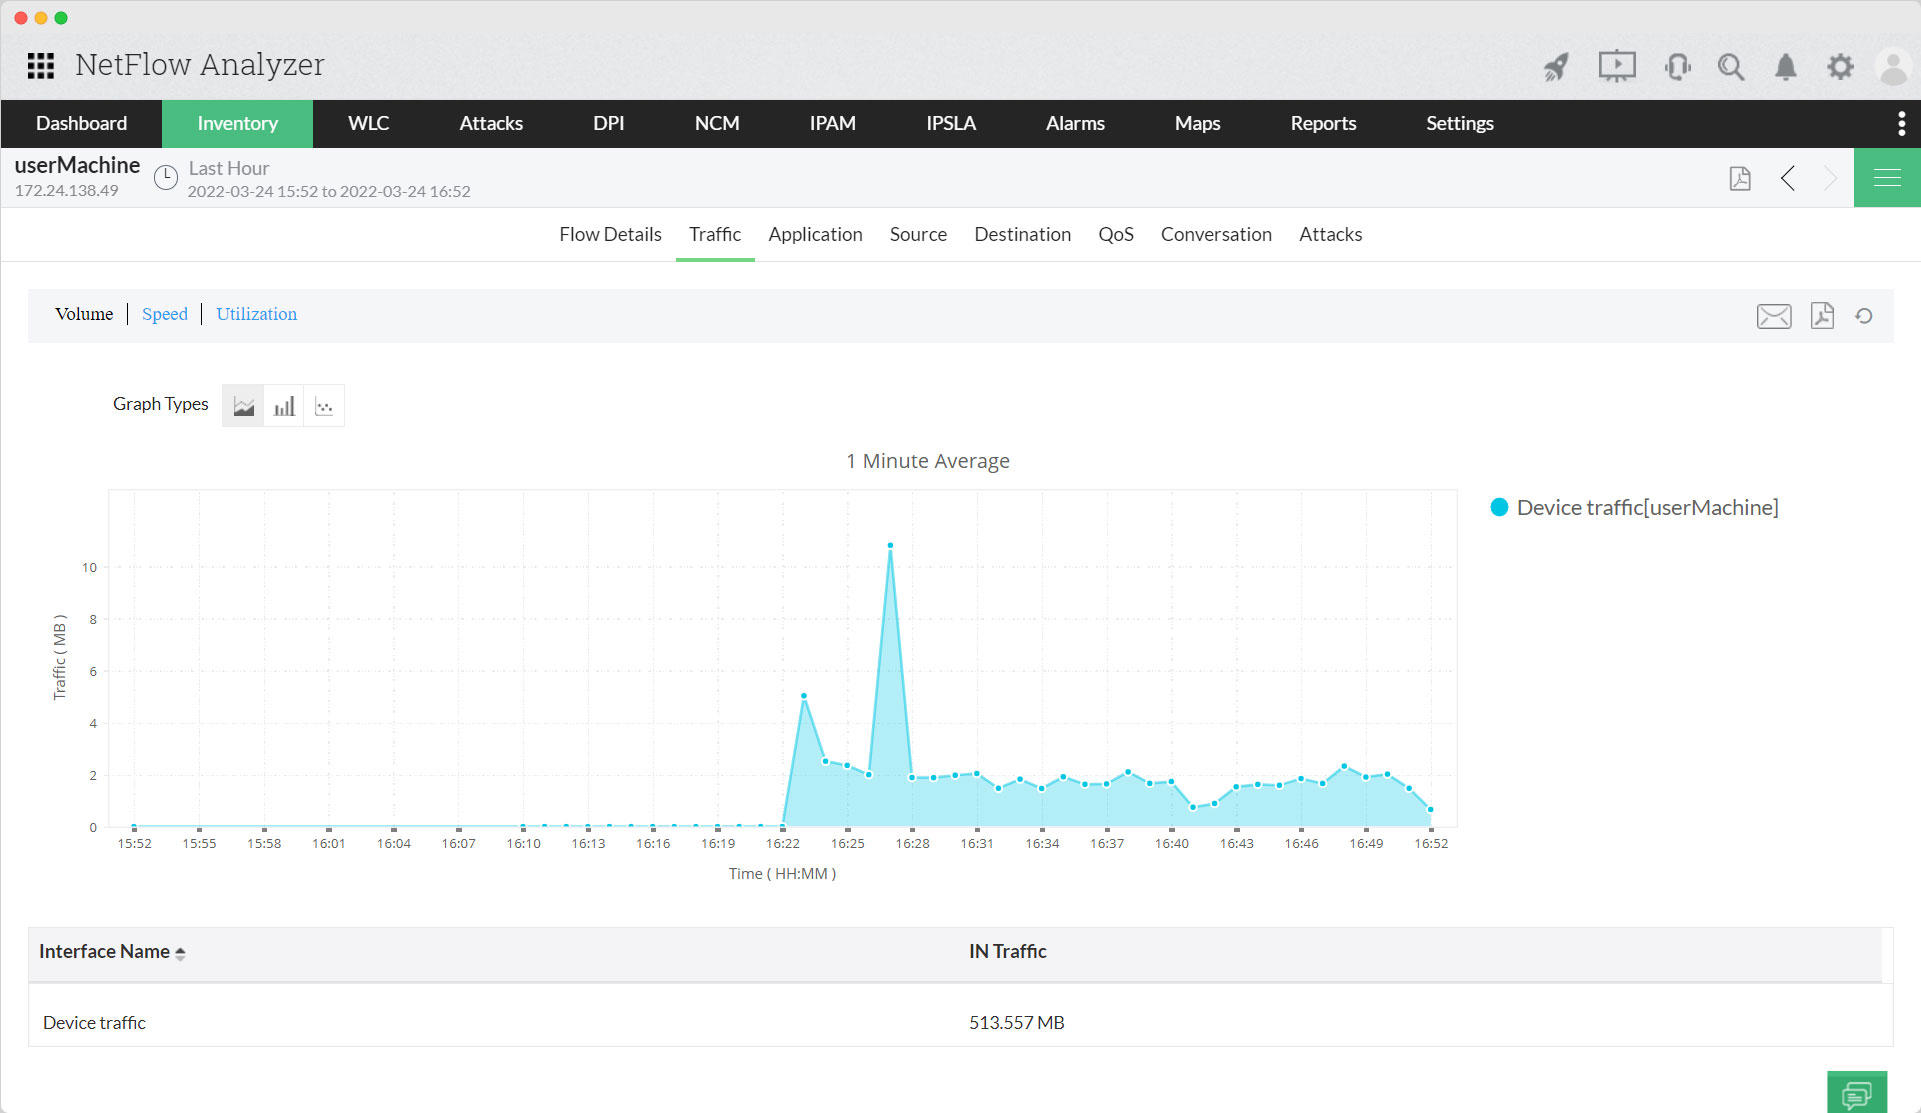
With the Network Packet Sensor, you can carry out server traffic monitoring and see the bandwidth consumption of applications, source IPs, destination IPs, conversations, etc.

Visibility into conversations

Since the tool is also flow-based, you will know the who, when, and what of your bandwidth utilization

Insights into top talkers

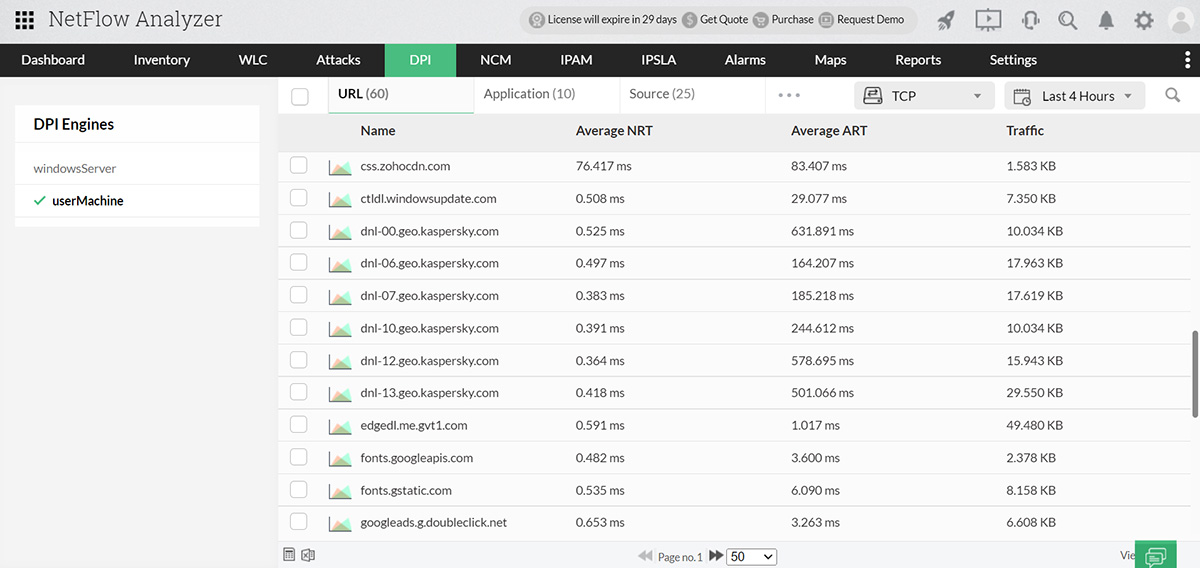
Troubleshooting is easier with deep packet inspection. It provides an overview dashboard that displays the top N applications, top N URLs, and top N conversations.

Comprehensive tool

You won't need separate tools to monitor the traffic of your non-flow network devices with NetFlow Generator configured. You can save on costs by seamlessly monitoring any device without changing your old non-flow-based devices.

NetFlow Generator

NetFlow Generator is a tool for NetFlow Analyzer that allows you to capture raw network packets hitting the network interface card (NIC) of the agent and translates them into NetFlow packets. The Network Packet Sensor is a unified agent of both NetFlow Generator and DPI that helps you carry out server traffic monitoring and network traffic monitoring.

Use case

1Your users complain that one of your homegrown applications is taking too long to respond to a request, while other apps seem to work fine. When you check if the routers or switch has caused a disruption, you find that they are also handling the traffic well. The reason could be because the server is overloaded with too many requests, causing a delay in transmitting and receiving the data packets.

2Server traffic monitoring helps you check traffic patterns by collecting information on how many data packets have been processed by the device. You will know the bandwidth consumed by the server with respect to utilization, volume, speed, and packets.

3With NetFlow Analyzer's NetFlow Generator, you can see server traffic with respect to the source, destination, applications, and conversations. Therefore, you will be able to figure out if the server has reached its bandwidth capacity or if the problem is not with the server. This will, in turn, help you reduce error and failure rates and maintain high levels of productivity.

4With network traffic monitoring, you can check how stable the network is. NetFlow Generator helps you monitor network traffic by giving you real-time data on its availability along with when the data was transmitted or received by the device. You can monitor the WAN traffic with respect to latency, jitter, availability, and round trip time.

5Knowing the server traffic and network traffic will help you confirm if the problem is not on the server side, but the network side, and that the bandwidth allocated by your ISP is not enough.

Server traffic patterns

Key benefits of NetFlow Generator:

  • With threshold-based alerts, you can easily discover any unusual behavior from your servers.
  • Easily prevent outages or downtime when with in-depth visibility into application traffic, conversations, attacks, etc.
  • Generate and configure bandwidth usage reports to learn about traffic trends.

DPI

The Network Packet Sensor's DPI feature is a mechanism where the mirrored packets will get captured and analyzed by the Network Packet Sensor (when configured as a DPI Engine) and the resultant data will get transferred to NetFlow Analyzer.

While, the previous version of DPI was offered with the Vectorwise version of the HighPerf add-on, this new version of DPI has been reintroduced with our homegrown CStore version of the HighPerf database add-on.

Some notable differences that the new version of DPI has are:

  • You can install up to ten Network Packet Sensors (when configured as DPI Engines) for one NetFlow Analyzer license.
  • Unlike the older version of DPI that was built into NetFlow Analyzer, this DPI is available as an agent that you can configure whenever required.
 

Working of DPI

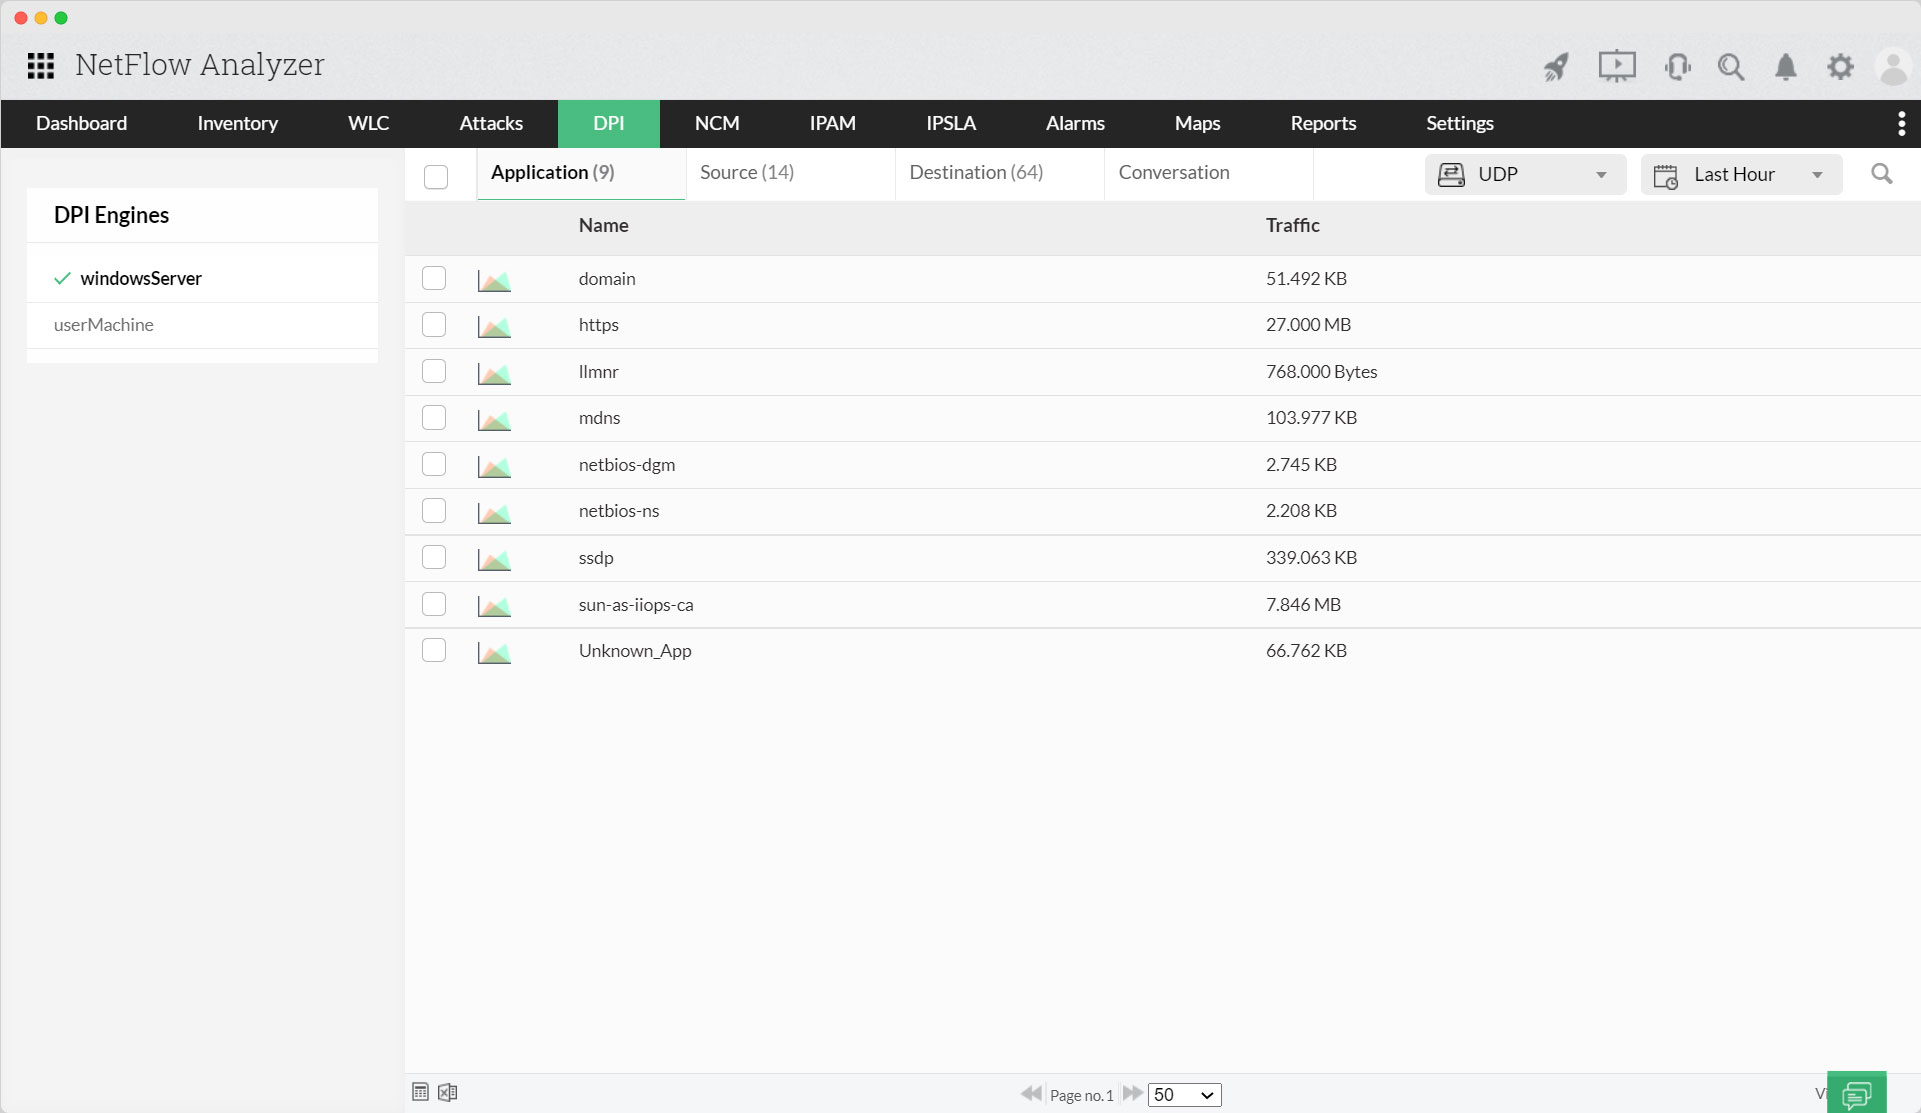
  • Data will be sniffed by the Ethernet card and the agent will show the average application response time and network response time for URLs, applications, and conversations for every minute
  • For TCP, the agent will display all three data types, e.g., application response time, network response time, and volume, for URLs, applications, conversations, etc.
  • For UDP, the agent will display only the average volume of traffic only for applications, source IPs, and destination IPs.

With DPI, you can:

  • Monitor the application response time, which can help you determine whether the problem is with the bandwidth or with the application itself. You can then discover the root cause of the problem, reduce the mean time to know (MTTK), and see how it has affected the overall user experience.
  • Network response time will help you measure the time it takes for the packets to reach the destination. The higher the response time, the higher the bandwidth bottlenecks. Therefore, monitoring this parameter will help you curb network latency issues.

Steps to configure the Network Packet Sensor

  • As a prerequisite, you will enable SSL and HTTPS in NetFlow Analyzer before installing the Network Packet Sensor
  • When installing Network Packet Sensor, you will configure an agent type: either NetFlow Generator or DPI.
  • The Network Packet Sensor will now start running as the configured agent(s).

Get an end-to-end view of your network traffic with NetFlow Analyzer

NetFlow Analyzer is a holistic network traffic analyzer tool that collects, stores, and analyzes flow data to present you the traffic patterns for every device, and interfaces of your network. You can drill down to Layer 4 and Layer 7 application traffic, and prioritize the application traffic by applying QoS policies.

To further simplify your network bandwidth monitoring, you can utilize reports to get insights based on your specific requirements. You can also expand NetFlow Analyzer's capabilities with add-ons like Network Configuration Manager and IP Address Manager.

To learn more about how NetFlow Analyzer works well for your organization's network infrastructure, contact our experts today!