
What is AWS CloudWatch?
AWS CloudWatch is a comprehensive monitoring and observability service provided by AWS. It enables users to collect and visualize metrics, logs, and events; set alarms; and automate actions based on predefined conditions. CloudWatch provides deep insights into the health, performance, and operational statuses of AWS resources and applications, empowering users to optimize resource utilization and troubleshoot issues proactively.
Capabilities offered by AWS CloudWatch
Amazon CloudWatch primarily collects data from three main sources: metrics, logs, and events.
1. Metrics are numerical values that measure the performance and health of your resources. AWS CloudWatch collects a variety of predefined metrics for AWS services, such as CPU utilization, disk reads and writes, network traffic, and Lambda function execution times. You can also define custom metrics for your applications.
2. Logs, on the other hand, are text files that contain information about events that happen in your system. AWS CloudWatch can ingest logs from your applications, AWS resources, API calls recorded by AWS CloudTrail, and even on-premises systems.
3. CloudWatch itself doesn't directly collect events as a separate data source. However, there are capabilities within the AWS ecosystem that handle events.
- Amazon CloudWatch Events: This is a dedicated service for managing events across AWS resources. It can ingest events from various sources and route them to different targets, including Amazon CloudWatch Logs, for storage and analysis.
- AWS Lambda performance events: AWS Lambda uses the term performance events for monitoring data related to function executions. These events include details like CPU utilization, memory usage, and network traffic. They are ingested into CloudWatch Logs for analysis.
With the help of insights from this data, CloudWatch offers these five core capabilities:
1. Metric collection and visualization
AWS CloudWatch gathers a wide variety of metrics from your AWS resources, including CPU utilization, network traffic, memory usage, and application performance indicators. These metrics are then displayed on customizable dashboards, allowing you to track resource health and identify potential issues.
2. Log aggregation and analysis
AWS CloudWatch streamlines log management by ingesting logs from Amazon Elastic Compute Cloud (EC2) instances, Lambda functions, and other sources. It offers powerful filtering and searching capabilities to pinpoint specific events within your logs, facilitating troubleshooting and debugging.
3. Event monitoring
Amazon CloudWatch keeps you informed about significant events occurring within your AWS environment. These include system state changes, API calls, and security alerts. You can receive real-time notifications to ensure you're promptly alerted to critical events requiring immediate attention.
4. Alerts and notifications
AWS CloudWatch lets you define custom alarms based on specific metrics or log patterns. It can trigger notifications via email, SMS, or Amazon Simple Notification Service topics whenever an alarm threshold is breached, enabling proactive incident response.
5. Customizable dashboards
AWS CloudWatch lets you create intuitive dashboards that combine metrics, logs, and events from various sources. Such a consolidated view empowers you to monitor the health and performance of your entire AWS infrastructure from a single pane of glass.
How does AWS CloudWatch work?
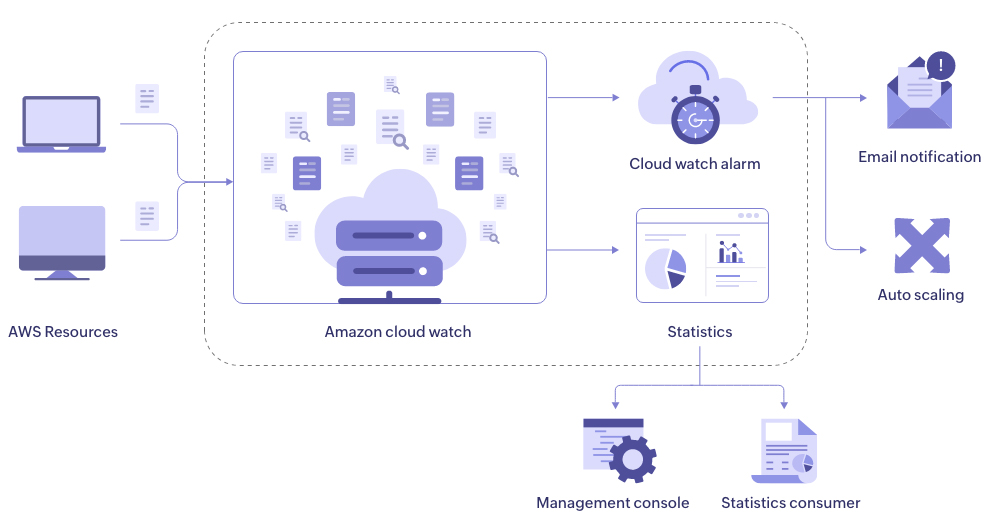
Amazon CloudWatch operates seamlessly within the AWS ecosystem. Here's a simplified breakdown of its workflow:
Data collection: AWS CloudWatch agents are deployed in your resources to collect metrics, logs, and events. Alternatively, you can integrate CloudWatch with various AWS services, like Simple Storage Service, DynamoDB, and CloudTrail, for it to ingest data directly.
Data processing: The collected data is sent to AWS CloudWatch for processing and storage.
Data visualization: AWS CloudWatch provides intuitive dashboards and visualizations for real-time monitoring of your AWS resources.
Alarms and notifications: Amazon CloudWatch enables you to define custom alarms based on specific metrics or log patterns. When a threshold is breached, AWS CloudWatch triggers notifications to keep you informed.
CloudWatch vs. CloudTrail
While both AWS CloudWatch and AWS CloudTrail are monitoring services offered by AWS, they serve different purposes.
AWS CloudWatch is primarily focused on monitoring and managing the operational health of AWS resources and applications by collecting and analyzing metrics and log data.
AWS CloudTrail, on the other hand, is a service that provides visibility into user activity and API usage within an AWS account. It records API calls made in your account and delivers log files containing information about those calls.
Best practices for AWS CloudWatch
To maximize the benefits of AWS CloudWatch, here are some key best practices to consider:
Define custom metrics
In addition to monitoring built-in metrics provided by AWS CloudWatch, defining custom metrics specific to your applications and workloads can provide valuable insights into performance and behavior. Use Amazon CloudWatch's custom metrics to monitor application-specific metrics and key performance indicators (KPIs) that are relevant to your business objectives. Examples include application response times, successful transaction rates, or custom error code rates. Use the AWS SDK or CloudWatch APIs to publish these custom metrics for monitoring.
Set meaningful alarms
When configuring alarms in AWS CloudWatch, ensure that the thresholds are set appropriately to trigger actionable alerts without generating excessive noise. Fine-tune alarm configurations based on the criticality of resources and the desired response times. To achieve this, it is important to choose a metric that directly reflects your resource's health. You can use dynamic thresholds based on historical data and define the evaluation period considering response times and metric behavior.
Use dashboards effectively
Design intuitive dashboards that display relevant metrics and KPIs for different stakeholders within your organization. Leverage features such as widgets, annotations, and time series graphs to create informative visualizations that facilitate decision-making and troubleshooting. Organize dashboards logically to group related metrics together based on the resource type or function. Customize dashboards to meet the specific monitoring needs of your teams.
Implement automated remediation
In order to automate remediation actions in response to predefined events, it is necessary to integrate AWS CloudWatch events with Lambda functions. This helps you mitigate issues before they impact business operations, reducing manual intervention. Define automated response workflows to handle common incidents, such as scaling instances or restarting services, based on predefined conditions. For instance, create a Lambda function that scales an EC2 autoscaling group if the CPU utilization exceeds the threshold for an extended period.
Optimize log retention and storage
Manage log retention and storage settings in CloudWatch Logs to balance cost and compliance requirements effectively. Define appropriate retention periods for log groups based on regulation requirements, business needs, and data retention policies. Leverage life cycle policies in CloudWatch Logs to automatically archive or delete logs after a specified time, optimizing storage costs.
Monitor resource utilization
Monitor resource utilization metrics, such as CPU utilization, memory usage, disk space, and network traffic, to identify performance bottlenecks, optimize resource allocation, and ensure the efficient use of AWS resources. Set up AWS CloudWatch alarms to notify you when resource usage approaches predefined thresholds, allowing you to scale resources or investigate potential bottlenecks before they impact performance.
Implement tagging strategies
Use Amazon CloudWatch's resource tagging to categorize and organize your AWS resources effectively. Leverage tags to group related resources, track cost allocation, and apply consistent monitoring and alerting policies across your environment.
Regularly review and optimize configurations
Regularly review your AWS CloudWatch configurations, including alarms, dashboards, and log retention settings, to ensure they align with your evolving business requirements and performance goals. Optimize configurations based on feedback from stakeholders, changes in workload patterns, and emerging best practices to maintain the effectiveness and efficiency of your monitoring environment.
Benefits of AWS CloudWatch
-
Enhanced visibility and control
Amazon CloudWatch helps you gain a comprehensive view of your AWS environment. By collecting and visualizing metrics, logs, and events from various resources, you gain real-time insights into the health and performance of your infrastructure.
-
Streamlined troubleshooting
AWS CloudWatch simplifies troubleshooting by offering log management and log search capabilities. It ingests logs from sources like EC2 instances and Lambda functions, allowing for the efficient identification of specific events within the logs. This streamlines troubleshooting processes, enabling you to diagnose and resolve issues swiftly.
-
Improved incident response
AWS CloudWatch lets you define custom alarms based on specific metrics or log patterns. These alarms act as early warning systems, triggering notifications whenever a predefined threshold is breached. This helps you address potential problems before they escalate into critical situations.
-
Optimized resource utilization
Amazon CloudWatch provides valuable insights into resource utilization by collecting metrics like CPU utilization, memory usage, and network traffic. By analyzing these metrics, you can identify underutilized resources and optimize your AWS costs by rightsizing instances or employing more efficient resource allocation strategies.
-
An improved security posture
AWS CloudWatch monitors security-related events and logs that can help you detect suspicious activity and potential security breaches.
Challenges associated with AWS CloudWatch
Here's a glimpse at some potential hurdles you might encounter when using AWS CloudWatch:
Limited visibility into non-AWS resources: AWS CloudWatch primarily focuses on monitoring native AWS resources. If your infrastructure incorporates on-premises resources or uses services from other cloud providers, CloudWatch's visibility might be limited.
Difficult log management: While AWS CloudWatch offers log monitoring and analysis capabilities, organizations may face challenges in managing and correlating log data across multiple AWS services and resources.
Potential alert fatigue: Overreliance on alarms in AWS CloudWatch can lead to alert fatigue, where the sheer volume of notifications desensitizes users to their importance. It's essential to prioritize and configure alarms effectively to ensure they notify you only about critical events requiring immediate attention.
Log360 Cloud's AWS monitoring
While AWS CloudWatch offers powerful cloud monitoring capabilities, it does present certain challenges, as discussed earlier. This is where Log360 Cloud, a unified cloud SIEM solution, steps in to bridge the gaps.
Unified monitoring for hybrid environments: Log360 Cloud offers unified monitoring capabilities encompassing your on-premises infrastructure, cloud resources from various providers (including AWS), and applications. This centralized view ensures complete visibility into your entire IT landscape.
Enhanced log management: Log360 Cloud goes beyond the basic log management features of CloudWatch. It provides powerful log aggregation, parsing, and correlation capabilities. It can ingest logs from diverse sources, including AWS services, applications, and network devices. Log360 Cloud parses these logs and correlates events across different sources, enabling you to identify the root causes and troubleshoot issues efficiently.
Cloud compliance: Log360 Cloud has a built-in compliance management feature to help you meet compliance requirements for regulations such as the PCI DSS, FISMA, the GLBA, SOX, HIPAA, and ISO/IEC 27001. The solution also offers audit-ready compliance reports and dedicated compliance dashboards.
Beyond basic log management and compliance, Log360 Cloud also offers advanced threat detection, investigation, and response capabilities that facilitate swift threat hunting and resolution.
Try Log360 Cloud's AWS monitoring capabilities for free
Sign up