Cost Category report
AWS Cost Categories enable you to group and categorize AWS costs based on various dimensions, such as accounts, services, tags, charge types, or usage types. CloudSpend syncs cost categories from AWS and allows you to set budgets and schedule reports accordingly. Similar to Business Units, the Cost Category report helps you analyze spending patterns and make informed decisions.
CloudSpend uses the following entities to map your cost categories and provide valuable insights into your spending patterns, identify cost drivers, and make data-driven decisions.
- Report name: <Cost Category Name> (<Cost Category Value>)
- Tag key: <Cost Category Name>
- Tag value: <Cost Category Value>
This report allows you to drill down into specific sections such as Accounts Splitup, Cost by Component, Trend, Cost by Service, Cost by Resource, Cost by Region, Cost by Instance Type, and Cost by Data Transfer.
Why use the Cost Category report?
Gain a comprehensive view of your cloud costs with CloudSpend's Cost Category report. Here are some of the key benefits of the Cost Category report:
- Enhanced financial visibility: Gain a comprehensive understanding of where your budget is being spent across different categories and segments.
- Simplified cost allocation: Allocate costs accurately across different departments, projects, or business units.
- Improved decision-making: Make informed decisions based on detailed insights into cost usage, trends, and distribution.
- Customizable views: Tailor your cost reports to focus on the data most relevant to your business needs.
Interpreting the Cost Category report
By leveraging CloudSpend's Cost Category report, you can effectively manage your AWS costs, optimize resource utilization, and make data-driven decisions to improve your cloud operations.
Follow the steps below to view the Cost Category report:
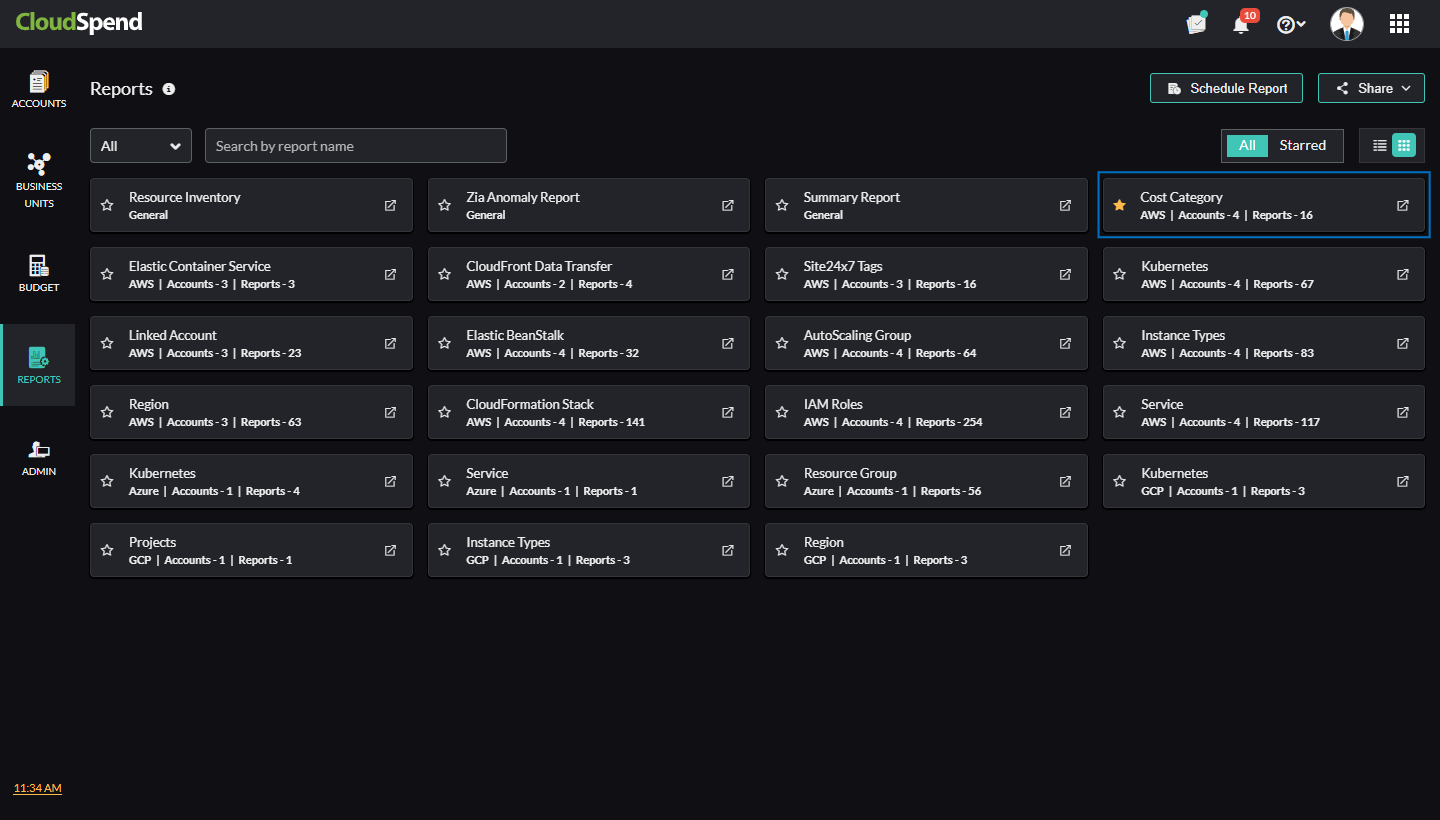
- Log in to CloudSpend and go to Reports.
- Select Cost Category.
- On the AWS Cost Category page, select the applicable account to view the cost details, trends, and usage. To schedule a report, click Schedule Report or click the Schedule Report icon next to the applicable account. You can schedule a report to be generated in CSV or PDF format.
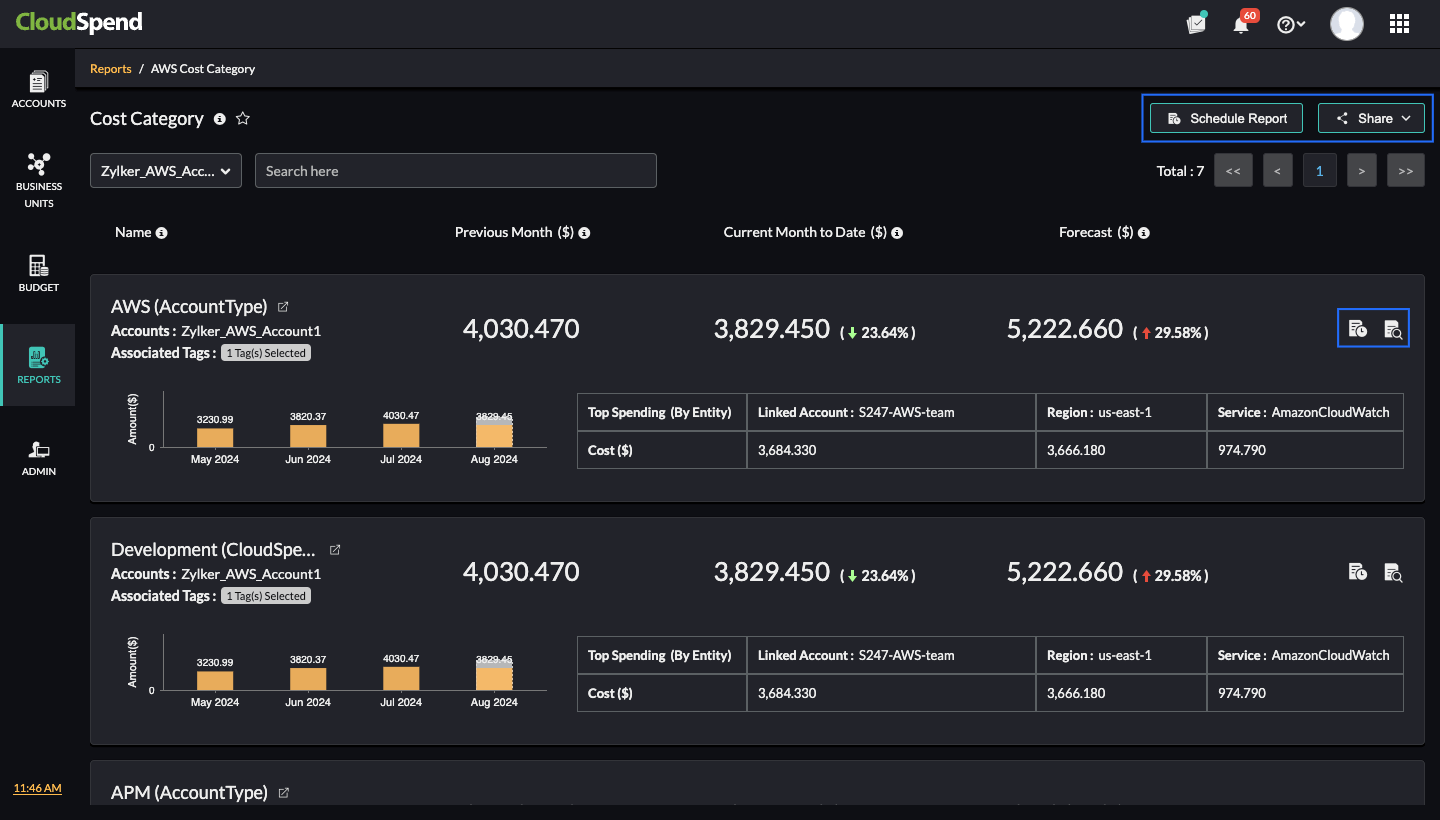
You can also click the Resource Explorer icon next to each account to go to its respective Resource Explorer page. To share the report with your team immediately, click Share to share it as a PDF.
Once you select the applicable account, the Spend Analysis page of that particular account appears.
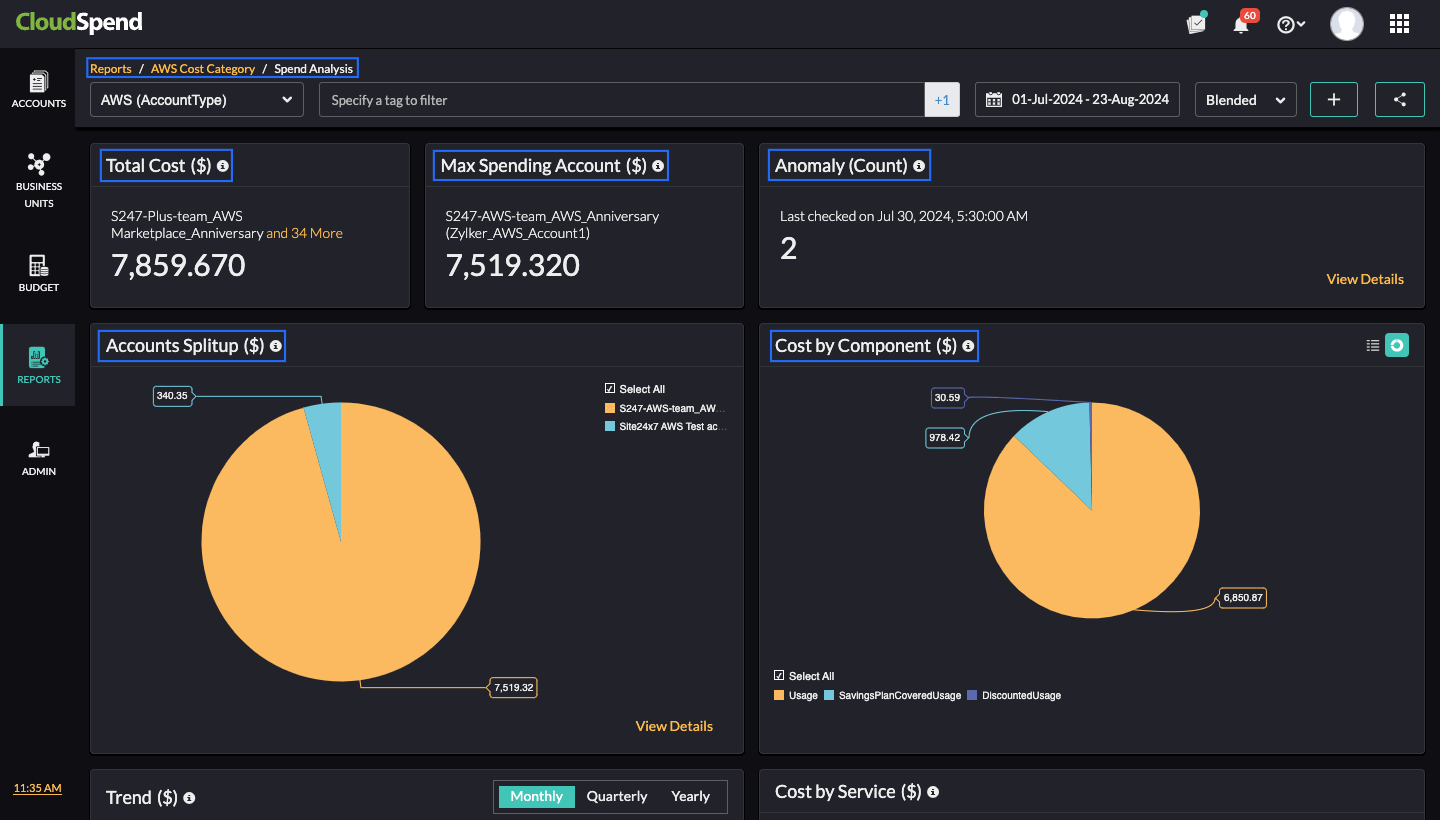
It allows you to filter and view cost data based on selected tags and cost type (Blended, Unblended, Amortized, and Recurring) and set a custom date range, giving you a clear picture of cost allocation across different parts of your organization. You can view the following details along with the Total Cost and Max Spending Account.
Anomaly (Count)
This section displays the anomalies that occurred for the blended/actual cost. Click View Details to get a comprehensive view of each anomaly detected for the cost account.
Account Splitup($)
This section breaks down the total cost by individual AWS accounts within your organization. Click View Details to view the Resource Explorer page. The Resource Explorer page allows you to identify which accounts are consuming the most resources, helping you allocate budgets effectively and identify any anomalies in spending. You can drill down into the cost details by Accounts, Region, Service, and Tags on a Daily, Monthly, Quarterly, and Yearly basis.
Cost by Component($)
View the total cost accrued according to each component in your CloudSpend account in this section. This helps you understand how components of your infrastructure contribute to overall costs, enabling better resource allocation and cost optimization strategies.
Trend($)
This section displays cost trends over a selected period, allowing you to visualize how your spending has evolved on a Daily, Monthly, Quarterly, and Yearly basis. It enables you to spot spending patterns, identify seasonal trends, and forecast future costs, allowing for more accurate budgeting and financial planning.
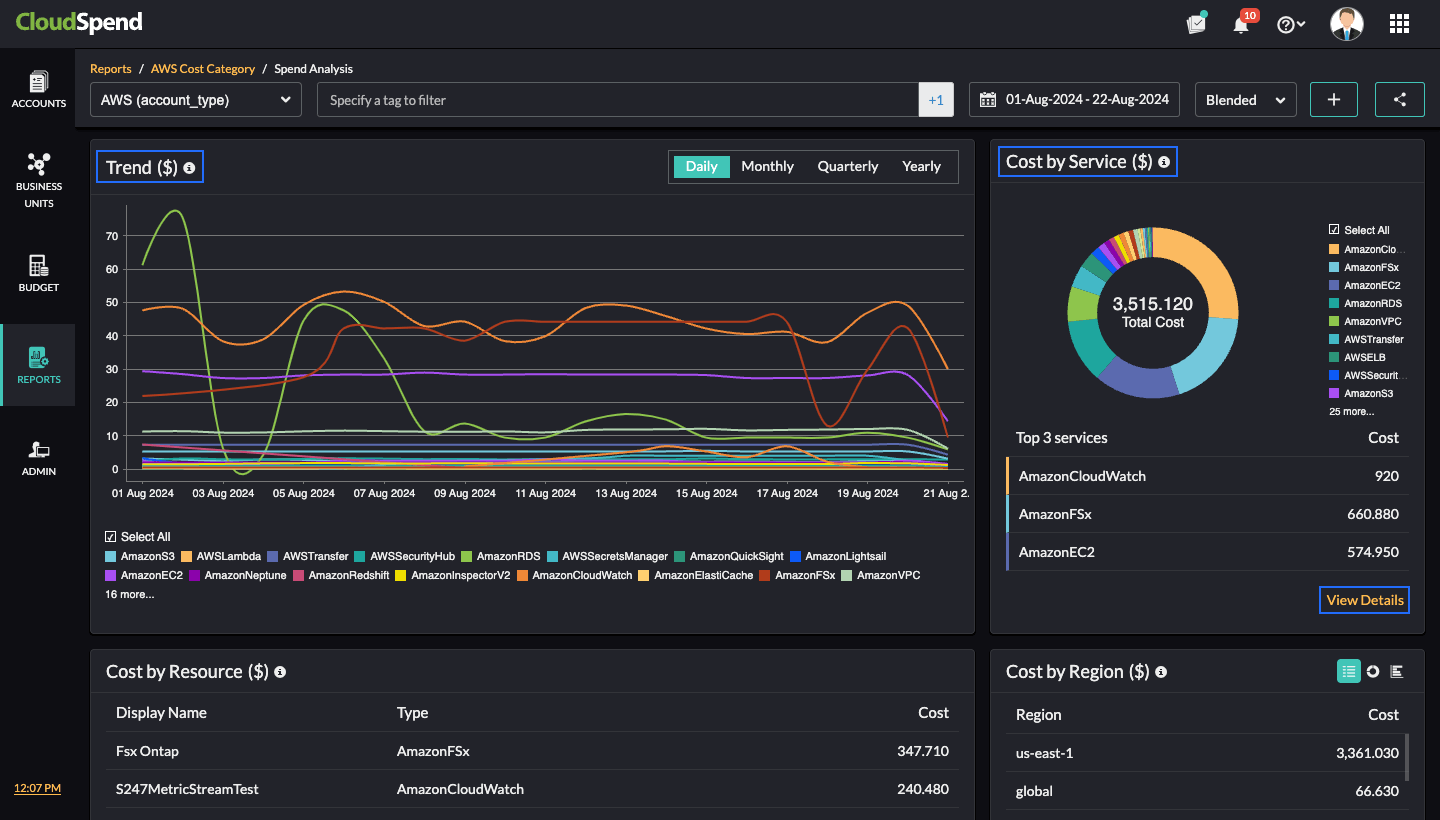
Cost by Service($)
Obtain a detailed break-down of costs from this section by AWS services, such as EC2, S3, or RDS. This helps you identify the top three services driving your AWS costs, allowing you to optimize usage and consider alternative services wherever possible to reduce expenses.
Click View Details to view the Resource Explorer page. You can analyze resource-level costs by drilling down into data for Accounts, Regions, Services, and Tags on a daily, monthly, quarterly, or yearly basis.
Cost by Resource($)
The Cost by Resource($) section provides insights into costs associated with the top five resources. This detailed view helps you track the cost of individual resources, enabling you to manage and optimize resource utilization effectively.
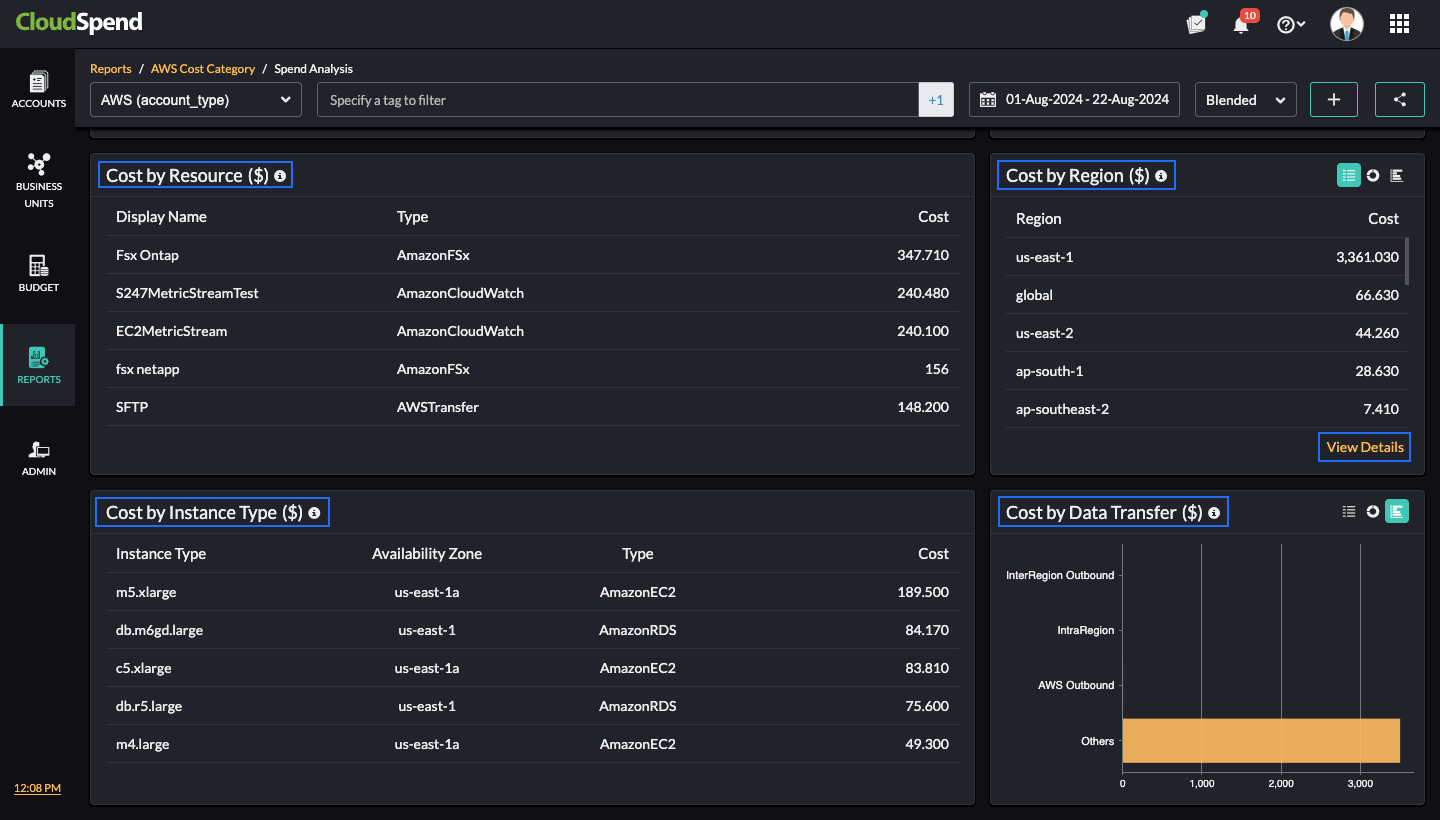
Cost by Region($)
Obtain critical insights about costs by AWS regions, showing where your resources are being consumed geographically. Click View Details to view the Resource Explorer page. You can analyze resource-level costs by drilling down into data for Accounts, Regions, Services, and Tags on a daily, monthly, quarterly, or yearly basis.
Cost by Instance Type($)
This section shows costs associated with different instance types, their availability zone, type, and cost. It enables you to evaluate whether you are using the right instance types for your workloads, potentially uncovering opportunities for cost savings by switching to more cost-effective instance types.
Cost by Data Transfer($)
The Cost by Data Transfer($) section provides the details of costs related to data transfer, both within AWS and externally. Data transfer costs can be a significant portion of your AWS bill. This section helps you understand where these costs are coming from, enabling you to optimize data flow and reduce unnecessary expenses.