Cluster analysis
Clustering is a method used in data analysis to group similar data points together based on certain factors or similarities. Each cluster contains data points that are more similar to each other than to those in other clusters. Analytics Plus uses the K-means, K-modes, and K-prototype algorithms to group data points.
Business use cases
Customer Segmentation: Customers can be grouped based on different factors like demographics, regions, and preferences. Grouping helps businesses tailor and strategize marketing efforts that improve sales and retention.
Inventory Management: Efficient inventory management facilitates a streamlined supply chain. Clustering can identify seasonal trends related to product purchases and items that are highly in demand and help manage stocks better.
Points to note
- A minimum of 5 data points are required for clustering.
- Cluster analysis is supported for scatter plots, bar charts, and bubble charts.
- Cluster analysis is not supported for Forecast, Trend line, and Anomaly analysis.
Applying cluster analysis
To conduct a cluster analysis, follow the steps below.
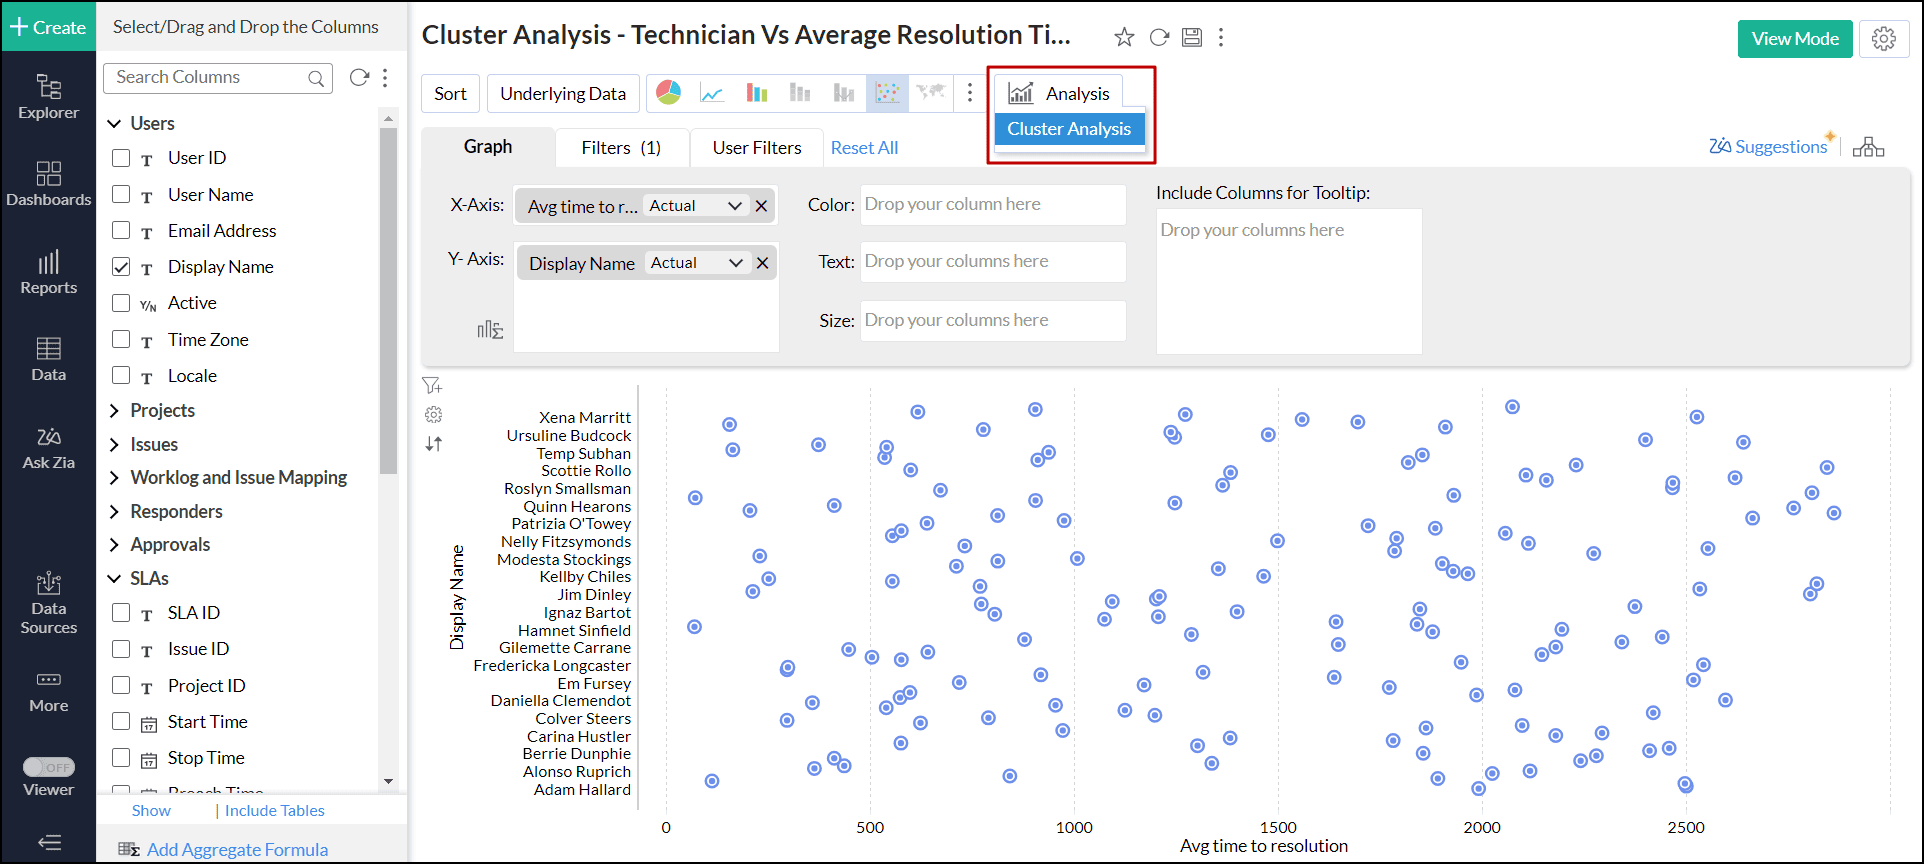
- Click the Analysis icon on the tool bar and select Cluster Analysis from the drop-down menu.
- In the Cluster Analysis dialog that opens, click Add Clusters.
- The algorithm model is auto selected based on the columns used in the report.
- Factors are the columns based on which the data points are grouped. The columns are listed based on the model selected; all the Numerical Columns available in the data will be listed for K-mean, Categorical columns for K-modes, and both numerical and categorical for K-prototype.
- The Number of Clusters are determined automatically based on the number of data points. A minimum of two clusters and a maximum of 30 clusters can be specified for clustering. The number of clusters should be one less than the number of data points.
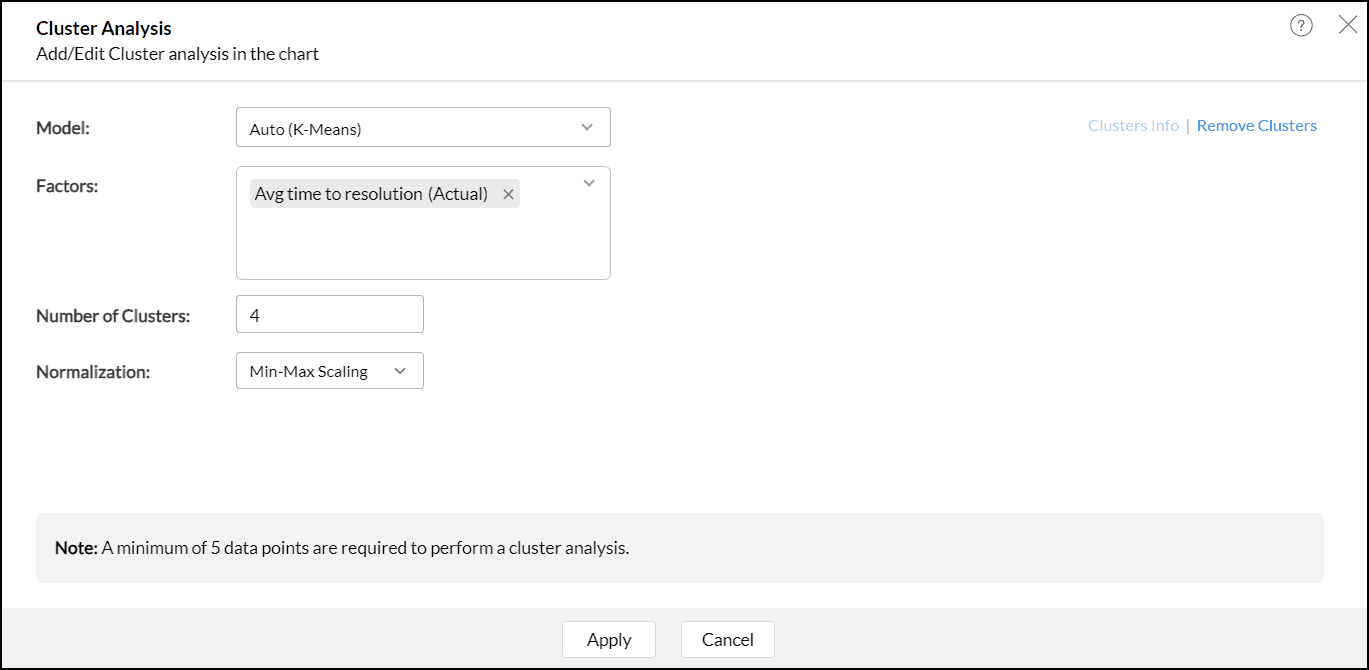
- Choose the Normalization method that should be used to transform the data before clustering. Normalization is the technique used to transform the data to have a common scale.
- Min-Max Scale: In this method, all the data points are rescaled between the ranges of 0 and 1.
- Z-Score: Z-Score represents the number of standard deviations a data point is from the mean of the dataset. This transformation is designed to center the data around a mean of 0 and standardize it so that the standard deviation is 1 for the entire dataset. In this method, all the data points are rescaled between the ranges of -1 and 1.
- For the K-prototype model, specify the Weightage to be given from numerical and categorical factors. The weightage values range from 0.2 to 2. By default, Analytics Plus gives equal weightage (1.00) to both numerical and categorical factors. Weightage value closer to 0.2 indicates numerical columns will have more weightage and value closer to 2 indicates categorical columns will have more weightage.
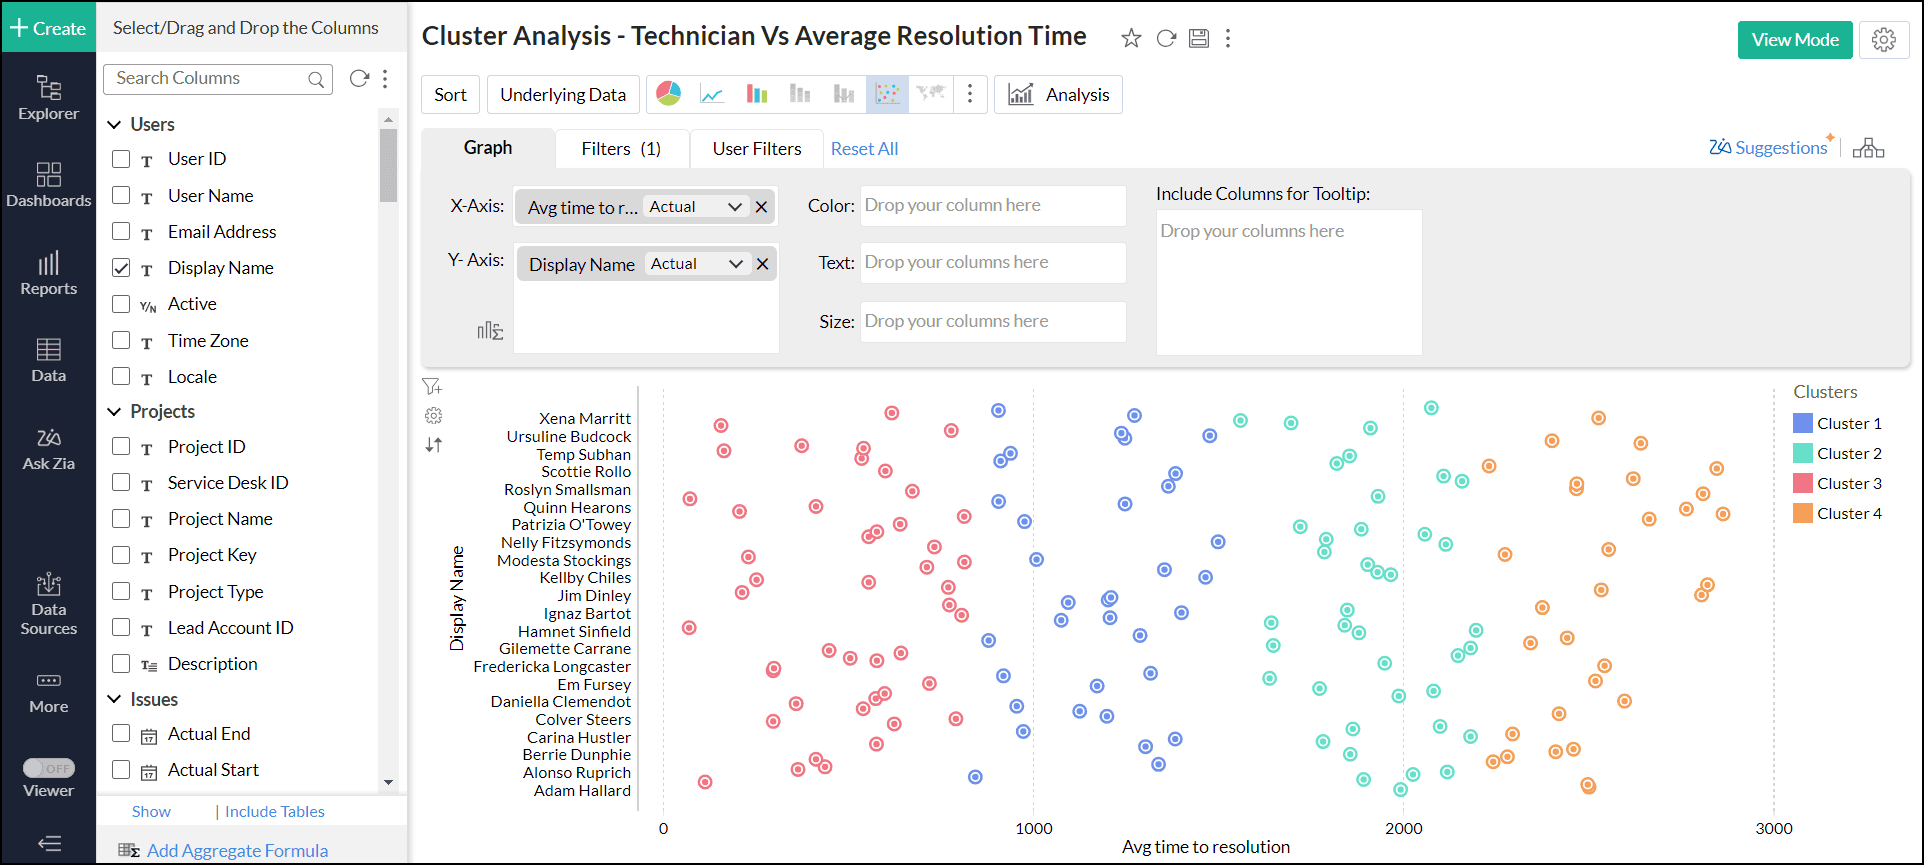
- Click Apply.
Viewing cluster information
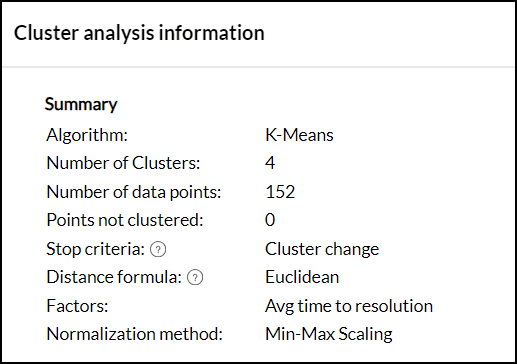
This section provides the summary and statistical information that help evaluate the quality of the clusters and how well the data points are grouped. Clusters info option will be enabled once the clustering is applied.
Summary
This section provides the following details:
- This section provides the following details, such as the algorithm used for clustering, Number of Data points, and Number of clusters in to which the data points are clustered.
- The Stop Criteria field gives the reason based on which the clustering process was terminated.
- The Distance formula that was used for clustering:
- Euclidean distance is the method used for K-means algorithm.
- Binary Dissimilarity is the method used for K-modes algorithm.
- The Factors (Columns) and the Normalization method used for clustering.
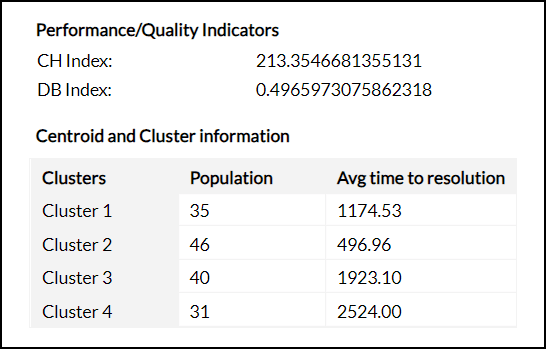
Performance/Quality Indicators
- CH Index - The Calinski-Harabasz index (CHI) is a metric used to evaluate the quality of a cluster. The CHI calculates the ratio of between-cluster variance to within-cluster variance. A higher CHI value denotes that the clusters are well grouped.
- DB Index - The Davies-Bouldin index (DBI) is another metric to assess the quality of clustering. The DBI is calculated by considering the ratio of the average similarity between each cluster and its most similar cluster, to the average dissimilarity between the clusters.
Centroid and Cluster Information
This section provides the details about the number of data points in each cluster and the centroid of the data points for each factor.
Analysis of Variance (ANOVA)
ANOVA is a statistical method that is used to calculate the difference between the means of multiple groups. ANOVA test is a statistical significance test that is used to check whether the null hypothesis can be rejected or not, during hypothesis testing.
- Within the Sum of Squares - It calculates how much the individual data points within each group differ from the mean of that group.
- Between the Sum of Squares - It calculates how much the mean values of different groups differ from the overall mean value.
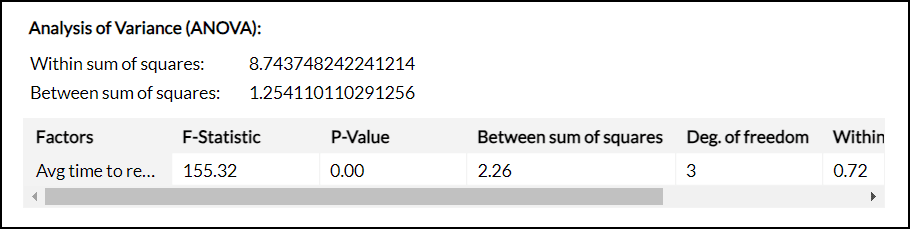
F-Statistic Value
The F-Statistic calculates the ratio of the Mean Square Between (MSB) the clusters to the Mean Square Within (MSW) the clusters. If the F-Statistic is greater than the critical value, we can conclude that the data points are well clustered.
| Factors | F-Statistic | Between the Sum of Squares | Degrees of Freedom (between clusters) | Within the Sum of Squares | Degrees of Freedom (within clusters) |
| Columns used for clustering | MSB/MSW MSB - Mean Square between clusters MSW- Mean Square within clusters. | Variability between the groups of mean value | k-1 k - number of clusters | Variability within the group of mean values | N-k N - Total number of observations k - number of clusters |