Help
Capacity Planning feature in NetFlow Analyzer helps you make informed decisions about your network bandwidth. It details on the traffic trend and bandwidth utilization pattern over a period of time. The capacity planning Report is available for all interfaces and IPgroups monitored under the NetFlow Analyzer.
The capacity planning report provides you traffic patterns based on volume, speed, utilization, and packets. The reports can be generated for any selected time period from last hour to last quarter and you can also customize the selected time period to suit your requirement. Using business hour and weekend
filters, the reports can be generated only for the required time period.
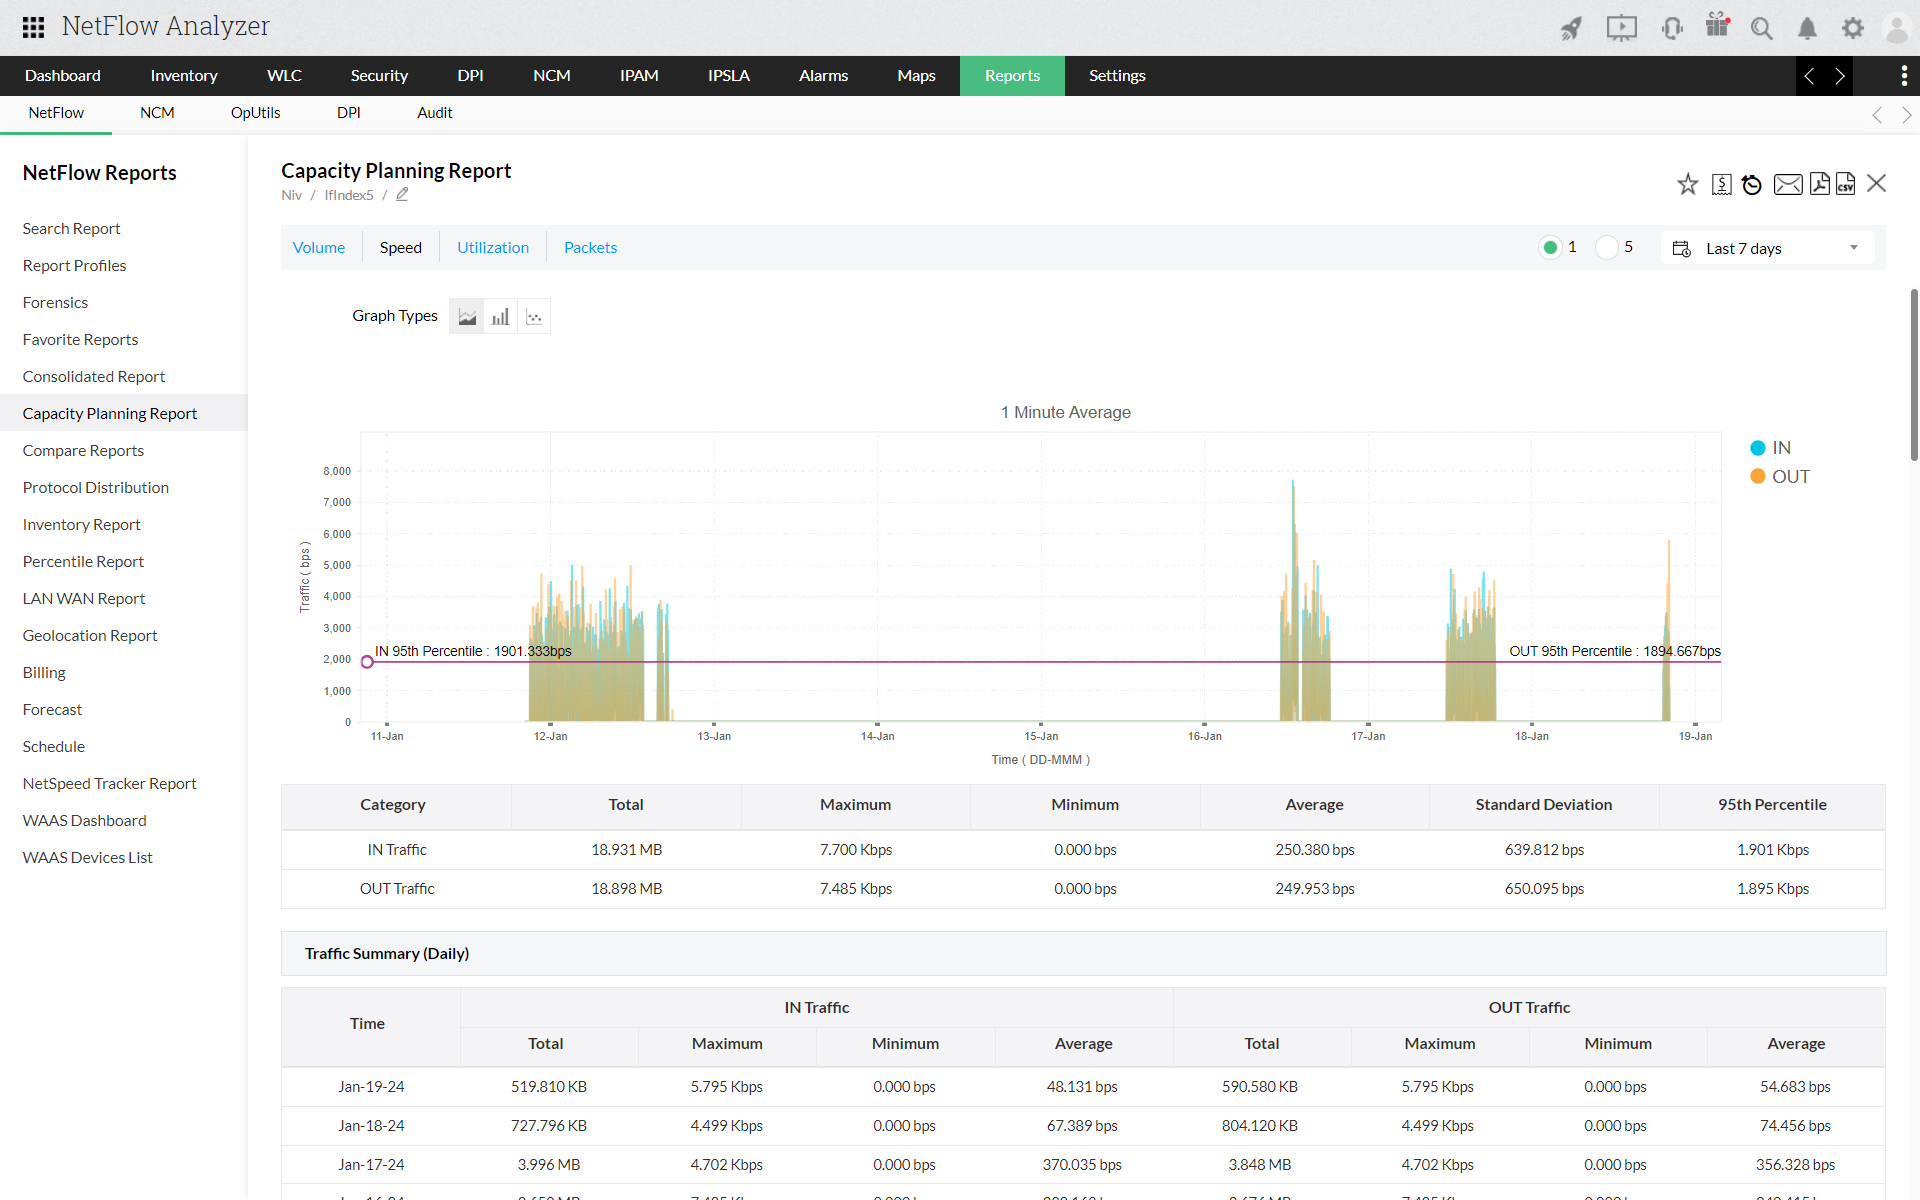
The graph gives you traffic IN and Traffic OUT on an one minute average. The report also displays the 95th percentile value for both IN and OUT traffic. The table below the graph provide Total amount of Traffic IN and OUT along with the Min, Max and Average values. It also calculates and displays Standard Deviation and 95th percentile value for the total amount of IN and OUT traffic. The graph displays the traffic deviation from the average amount of daily traffic.
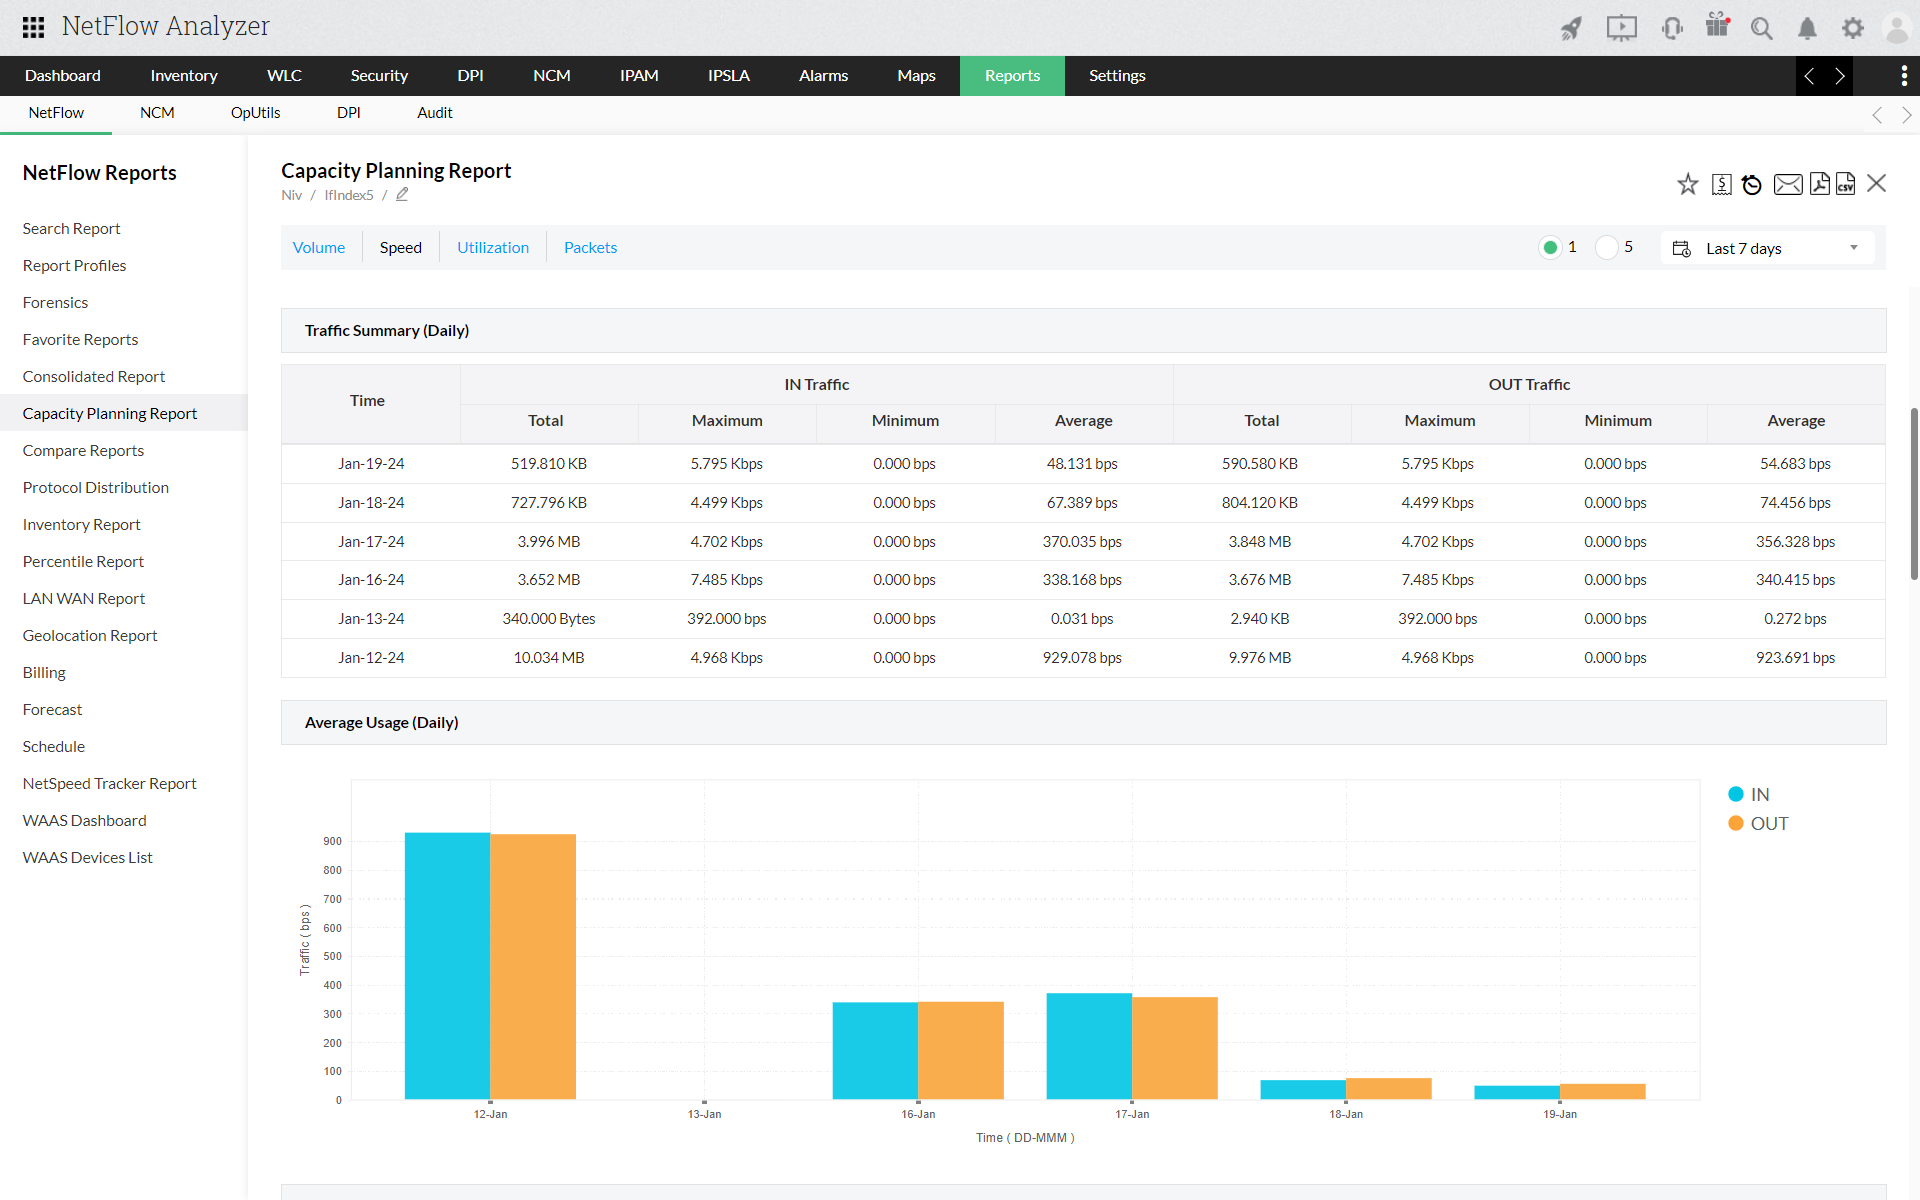
The graph displays daily average use of bandwidth for the selected time period. You can view the Traffic IN and OUT details for the selected time period.
Data Points This table provides individual data points for Traffic IN and OUT. The data points are displayed a Min, Max and Average value for a selected time period.
The pie chart displays the traffic associated each application. This is also calculated on the basis of IN and OUT traffic. The table below displays the application name, the amount of traffic and the total traffic percentage by each application.
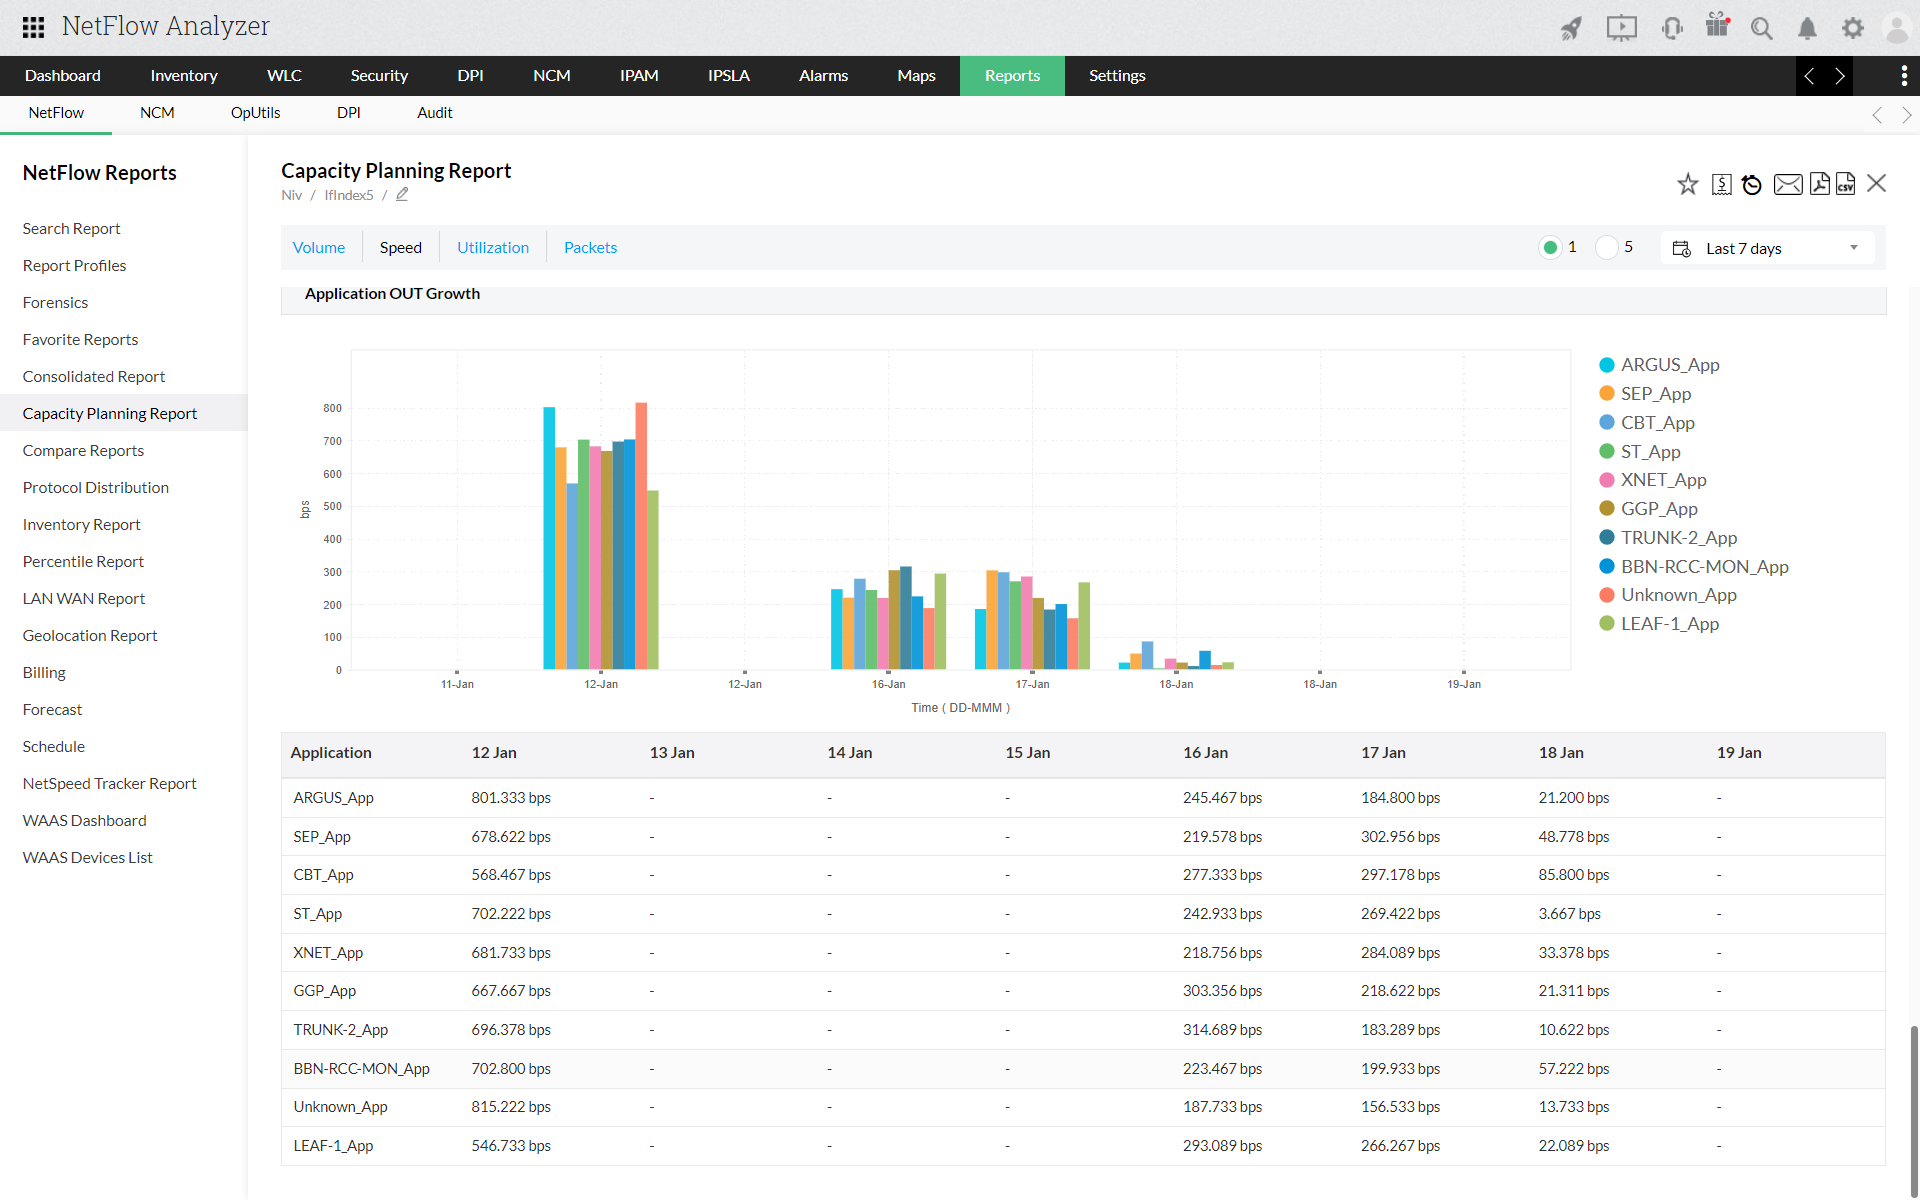
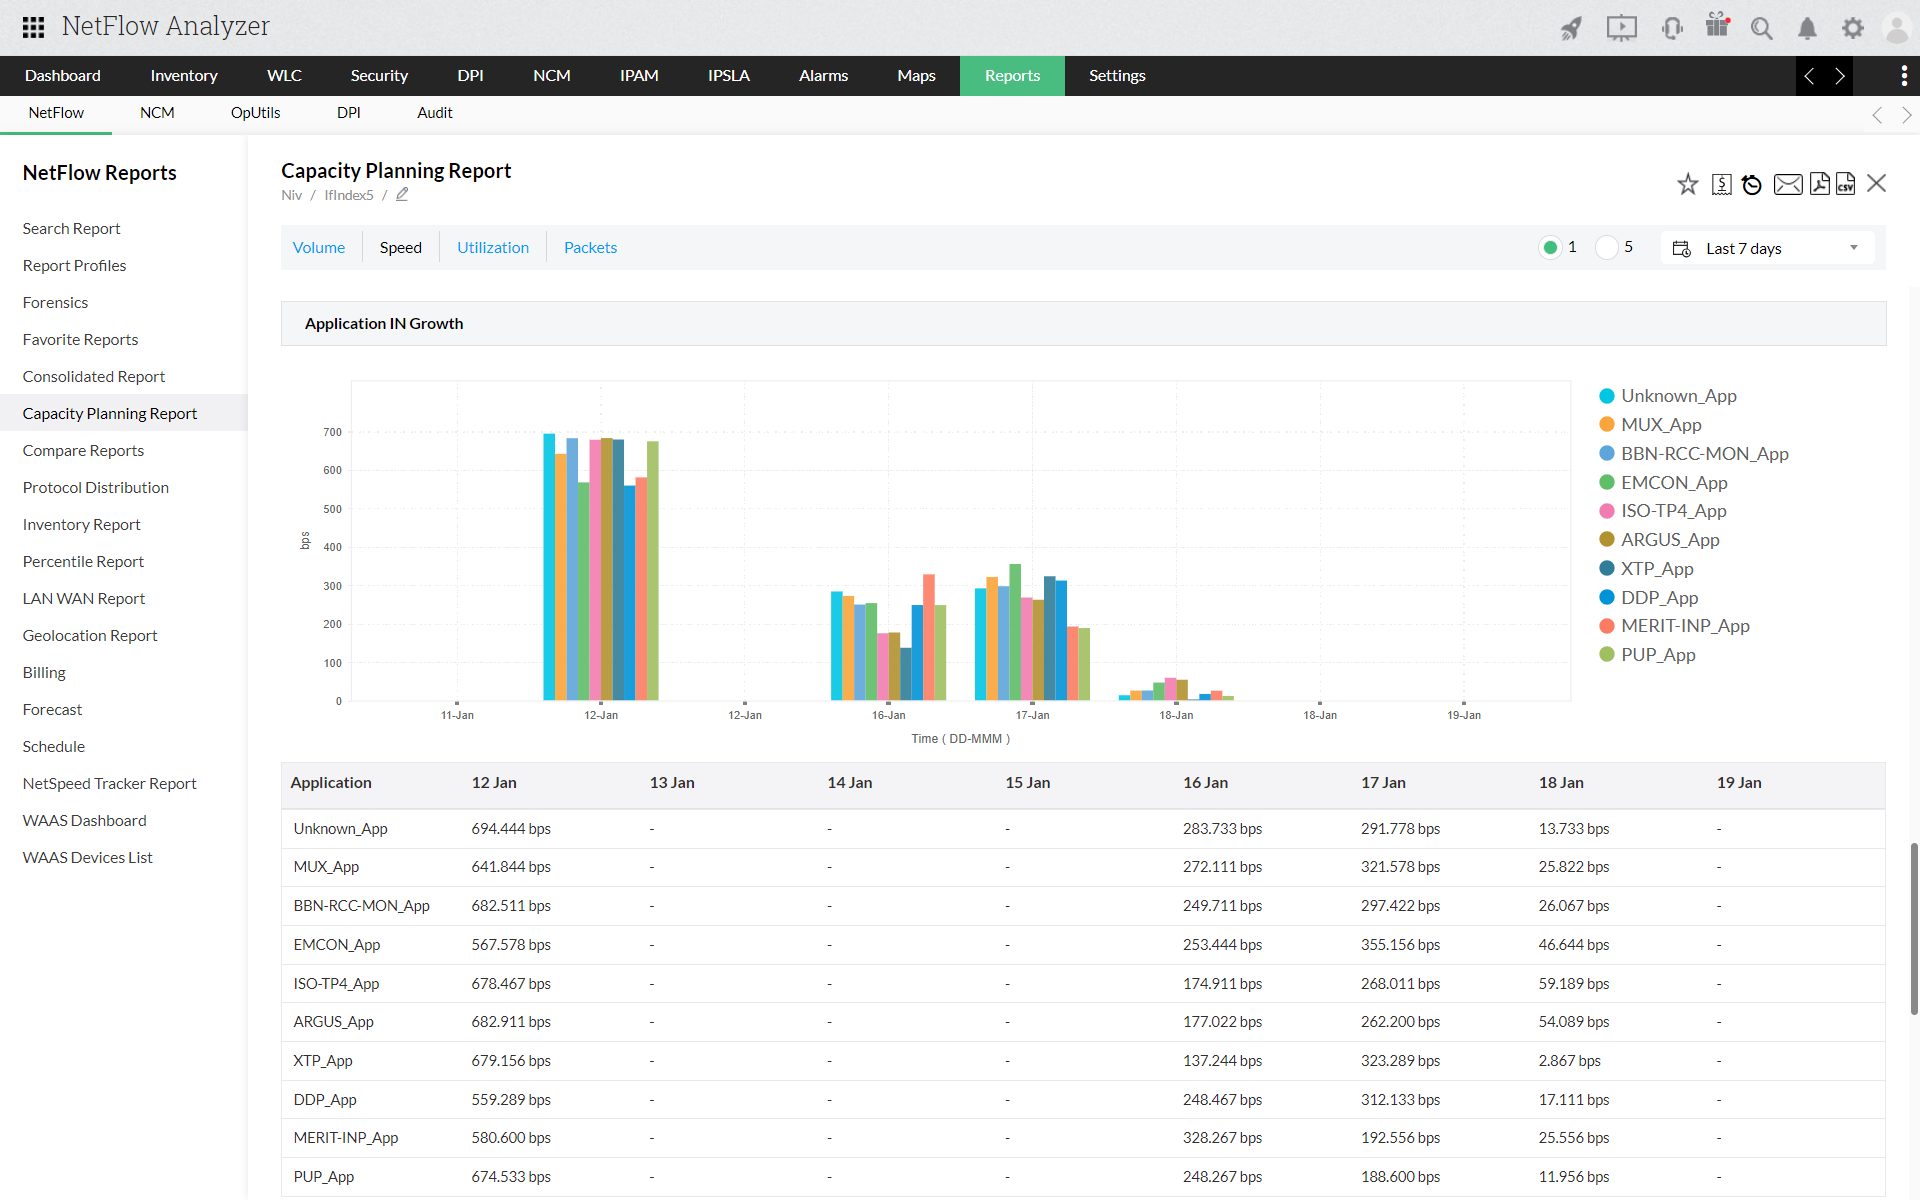
Application Growth Report helps in identifying the usage of a specific application in the network over the selected time period. It gives a graphical view shows the amount of bandwidth used by each application. This helps in prioritizing the applications to suit your enterprise's need. The table below report gives both application IN and OUT details and their usage over the selected time period.
The report has 2 views, Graph view and Table view.
Graph view show the Graphical representation for graphs and pie charts to show the information for each widget.
Table View show the detailed list output for the generated report. You can export each widget in the list view as csv or excel format by clicking on the icon  at the bottom of the view.
Thank you for your feedback!