VM monitoring for MSPs
Virtualization has brought about a paradigm shift in the networking space. Virtual machines (VMs) have proved to be a blessing, and are now in high demand as they help circumvent conventional network bottlenecks. Virtual machines help growing businesses scale their networks, cut their energy and hardware expenses, expedite disaster recovery through swift data backup, and augment IT productivity.
In spite of the upsides, virtual machines can be difficult to monitor without technical expertise. Managed service providers (MSPs) that offer network monitoring services can overcome this limitation with the help of tools that proactively monitor the virtual and traditional segments of client networks for performance, health, and availability issues.
Characteristics of an optimal virtual machine monitoring tool
With virtual machines becoming an integral part of your client's networks, it is imperative that you deploy a tool that factors in all client networking requirements and delivers high quality services.
To be effective, a VM monitoring tool should be able to:
- Uncover the root cause of performance bottlenecks
- Detect zombie VMs, which drain resources without offering any value
- Identify underutilized resources that can be reassigned for efficient provisioning
- Help efficiently manage virtual resources to avert VM sprawl
OpManager MSP Software: Your go-to solution for VM monitoring
ManageEngine OpManager MSP is a comprehensive VM monitoring tool designed to help MSPs gain complete visibility into their client's virtual environments. OpManager MSP software is compatible with every major virtualization vendor, such as Hyper-V, VMware, Citrix Xen, and Nutanix HCI. With OpManager MSP's multi-tenant software architecture, you can monitor virtual machines and servers from multiple clients concurrently for performance, health, and availability issues.
OpManager MSP's VM monitoring capabilities include:
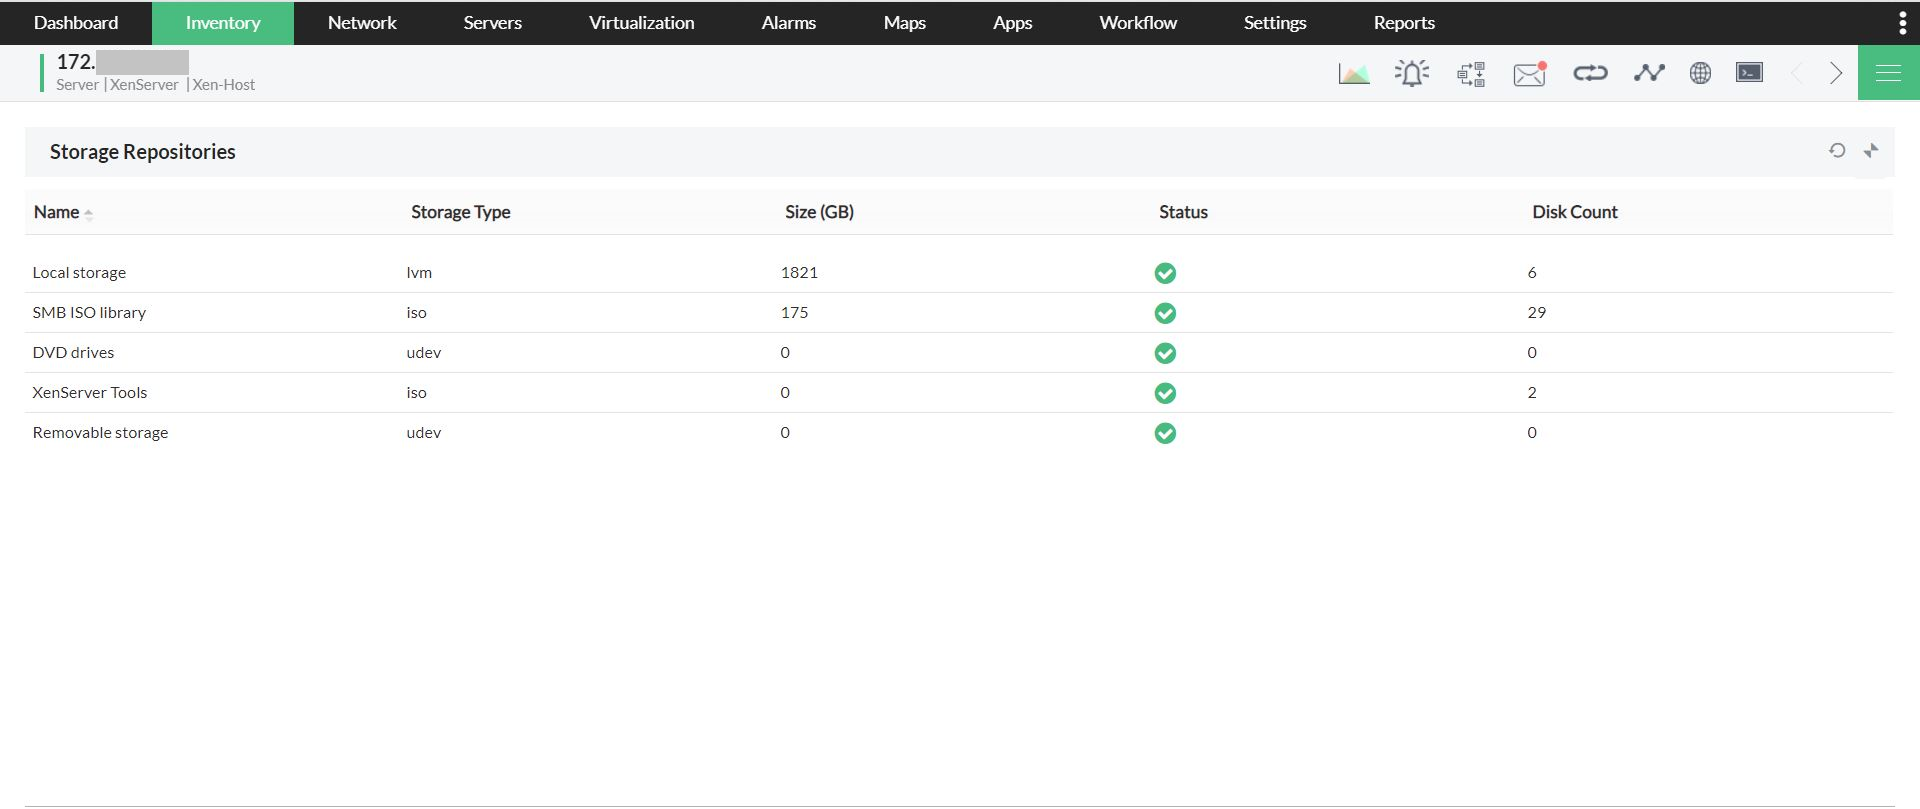
- Hassle-free discovery of virtual clusters, hosts, VMs, and data stores
- Real-time virtual machine performance monitoring
- Alarm generation and dissemination
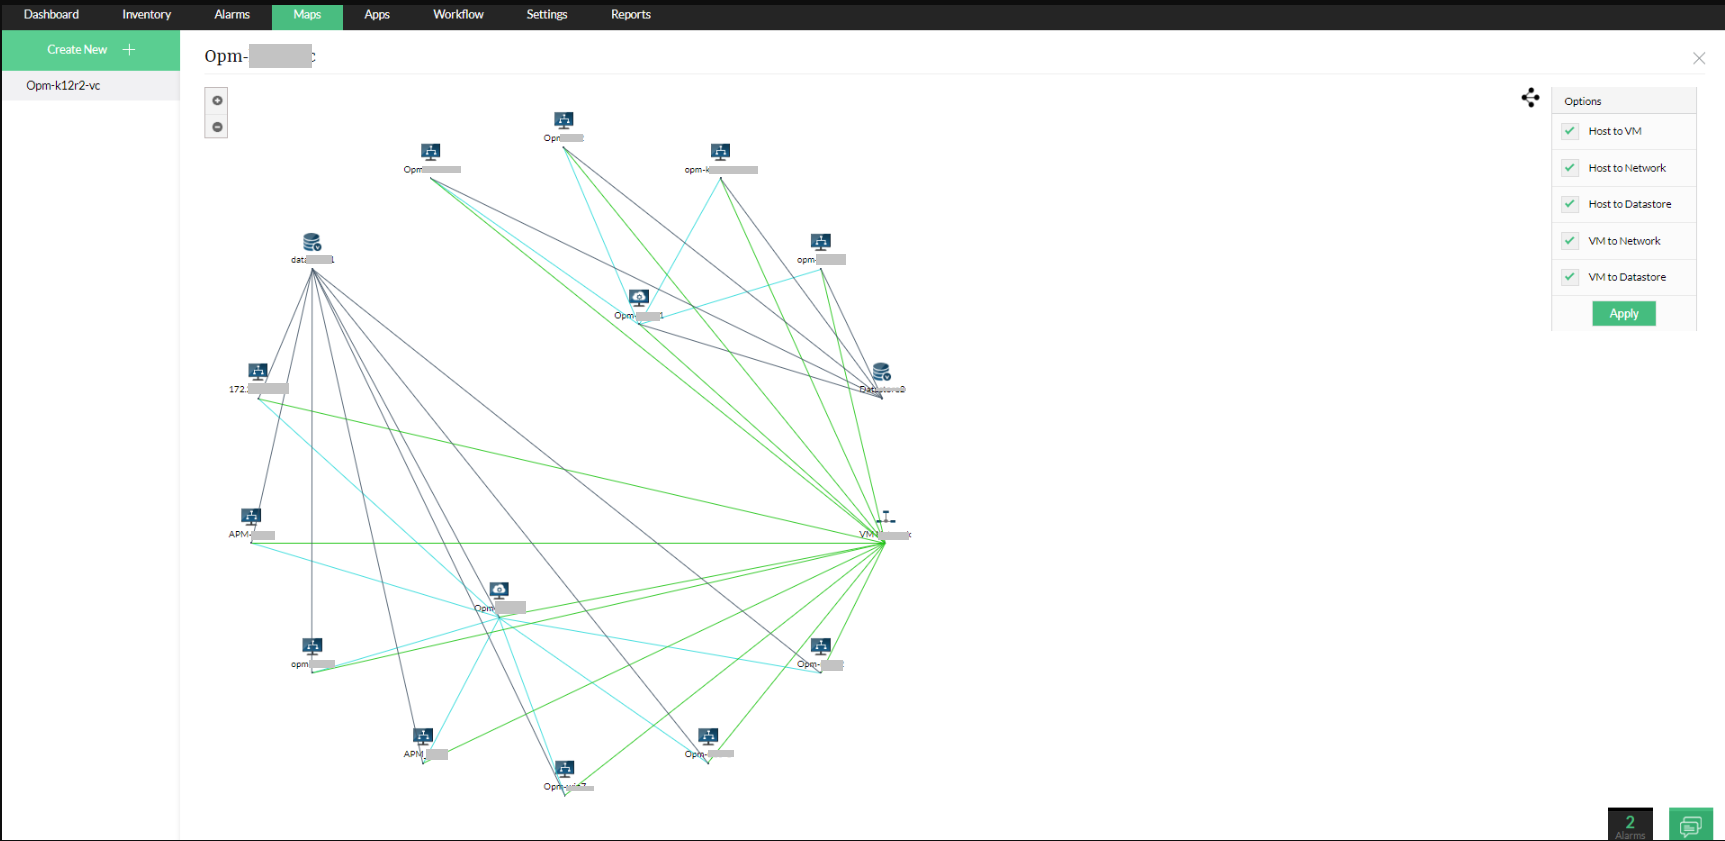
- Vivid visualizations displayed in virtual network topology maps
- Identification of underutilized resources for effective resource provisioning
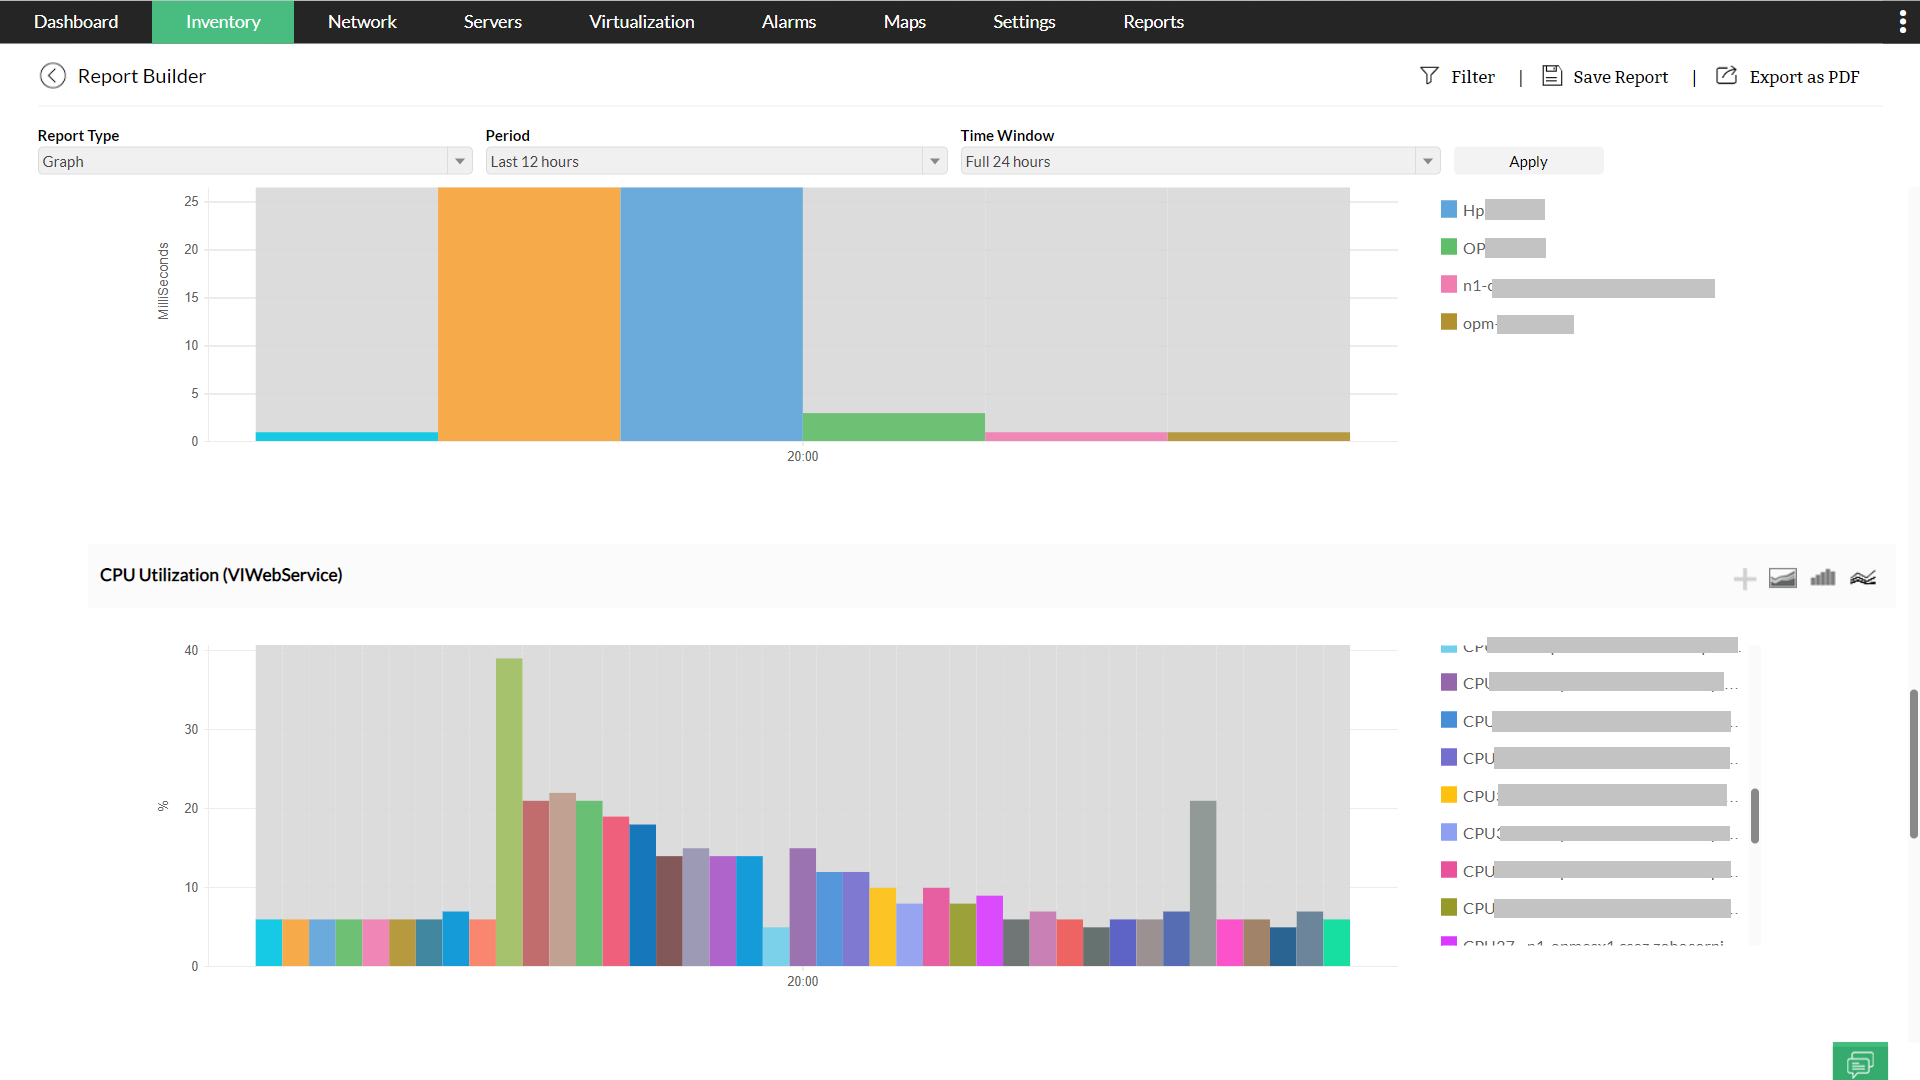
- Client-specific virtual network performance and availability reports
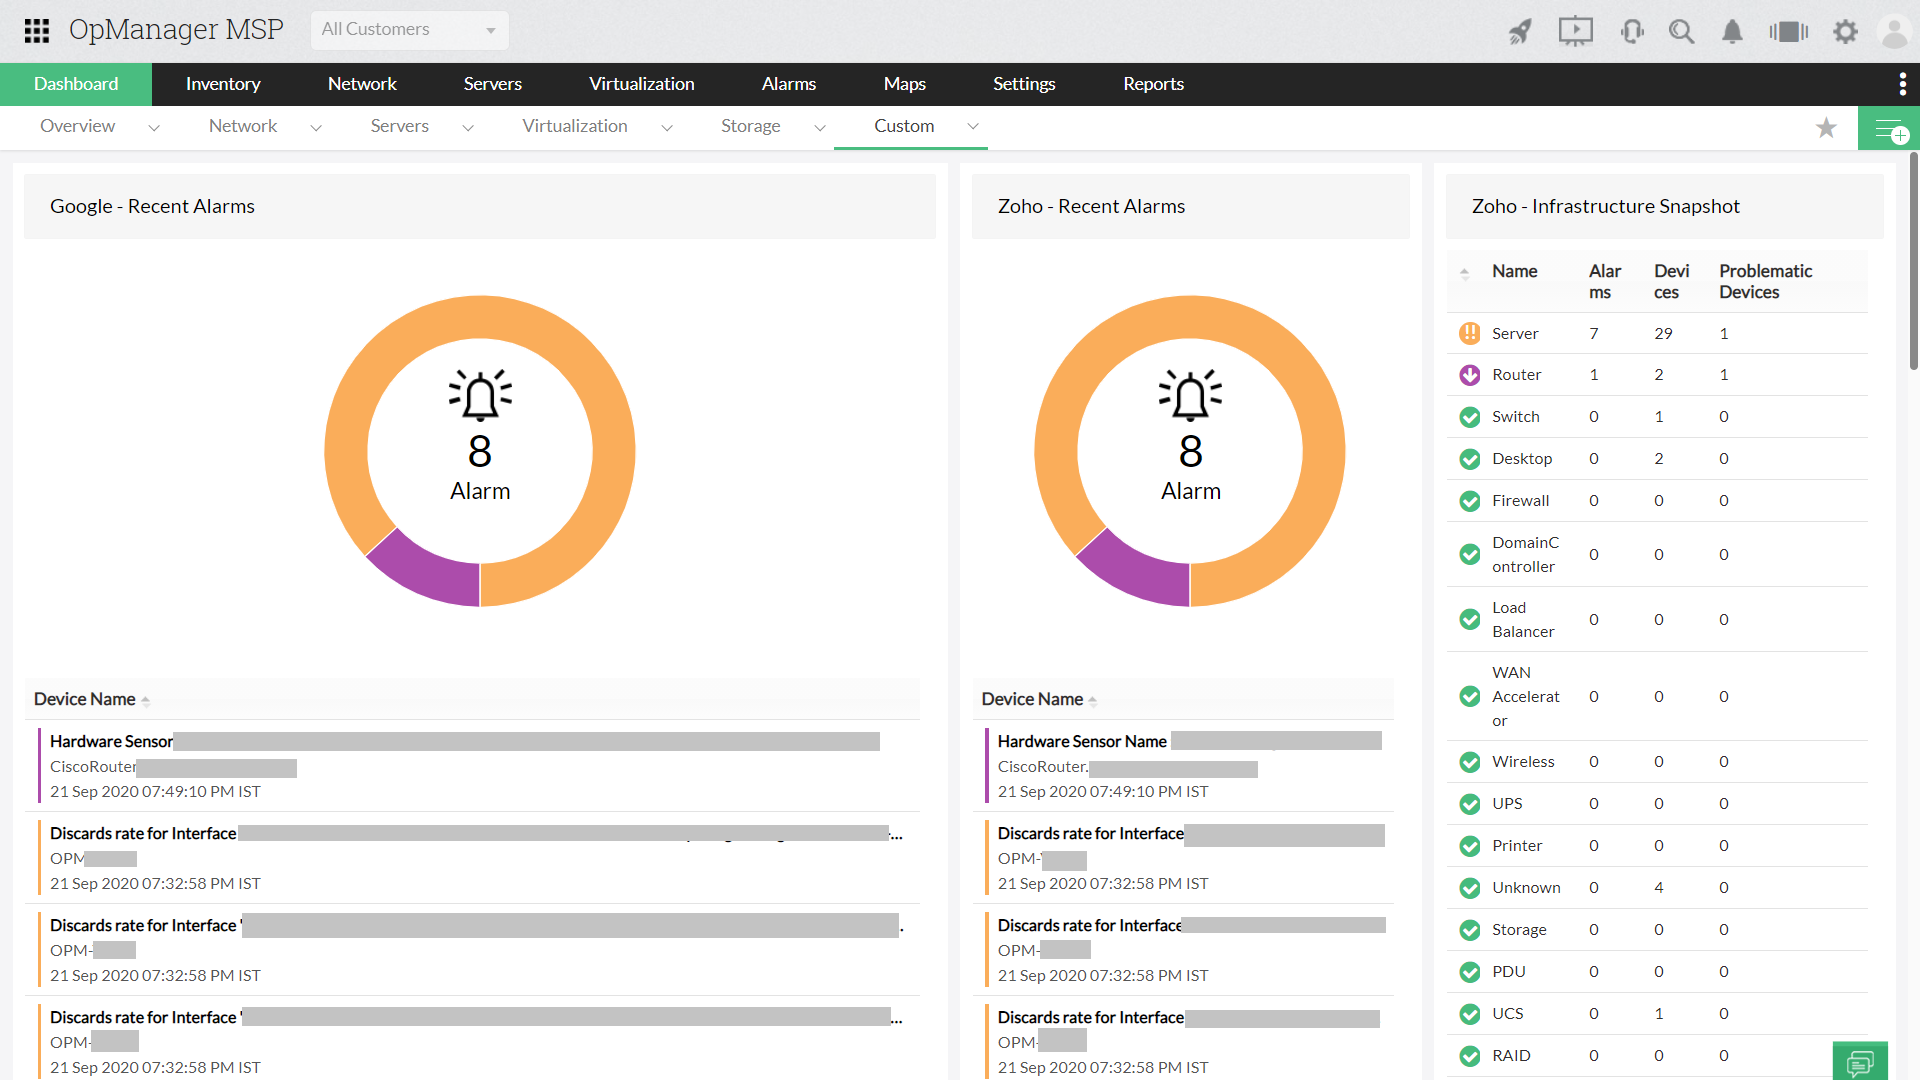
- Client-specific holistic dashboards
Seamless discovery
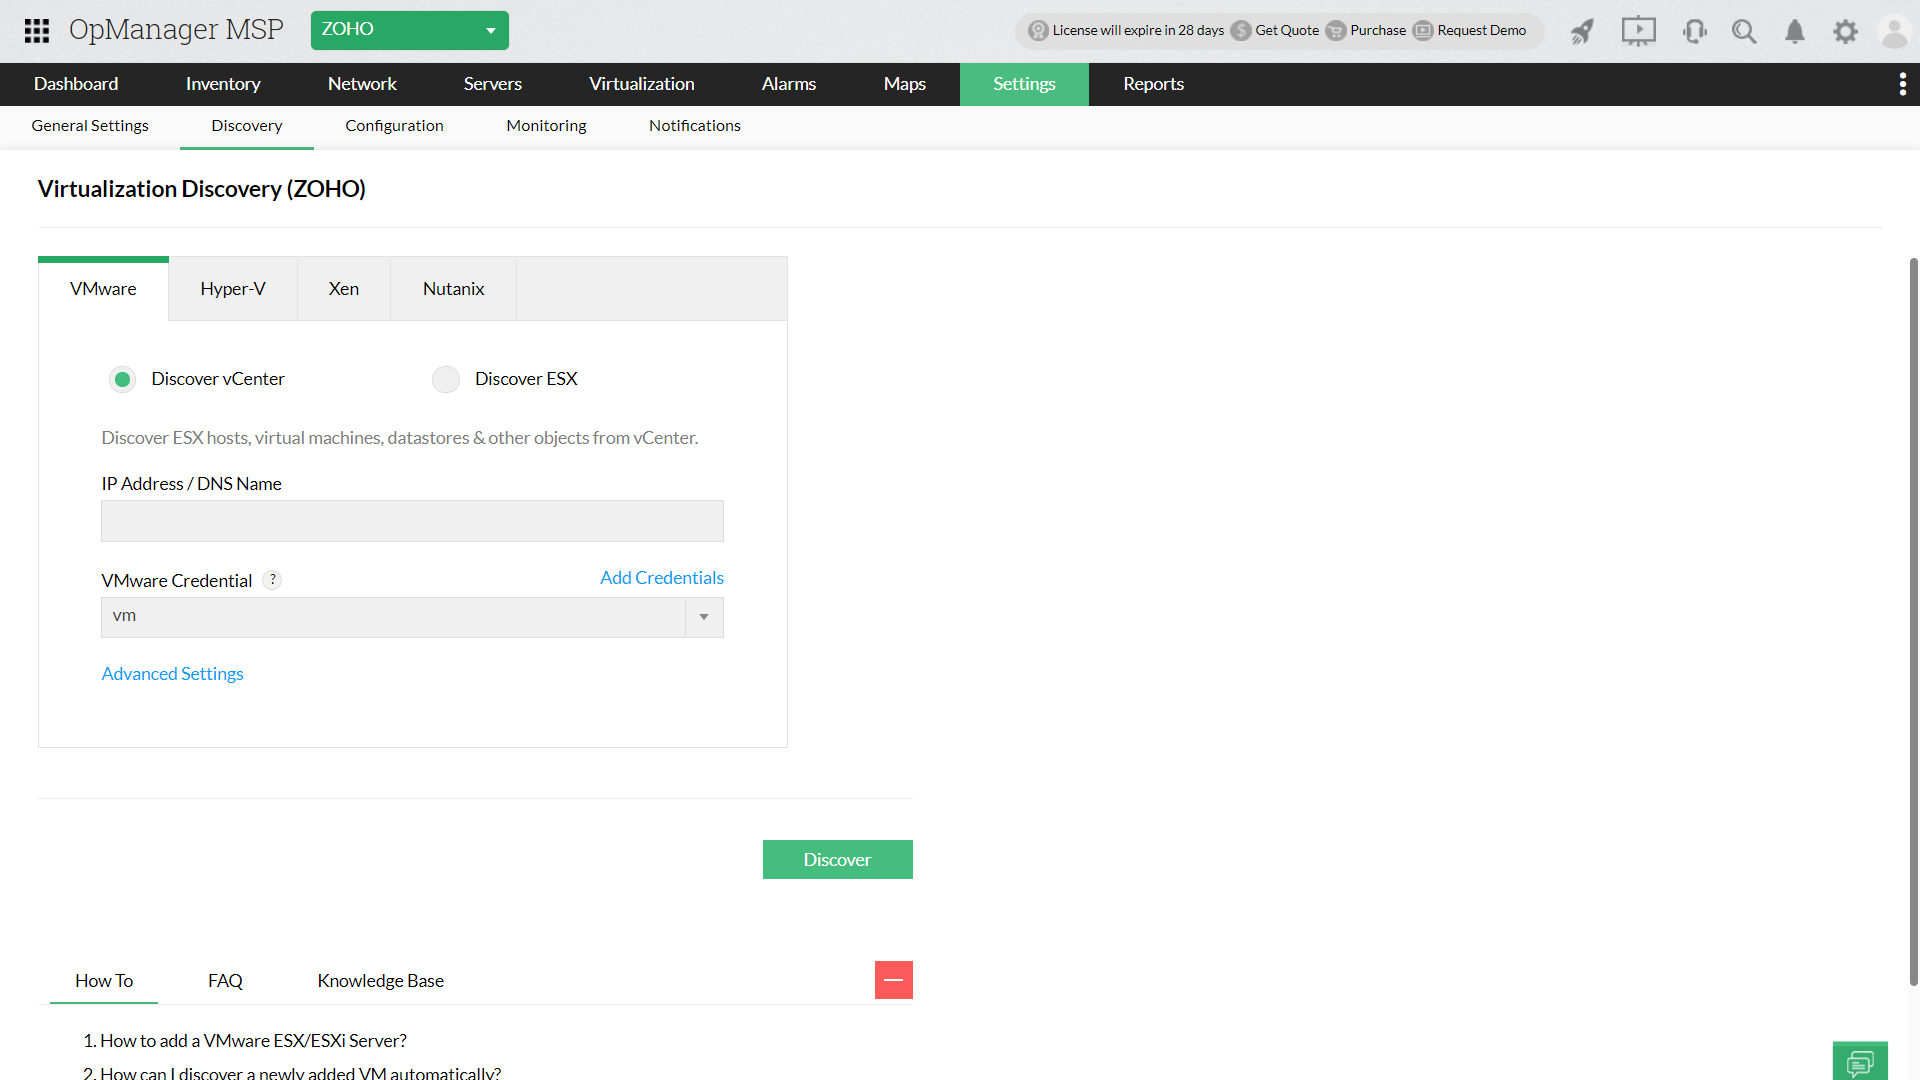
OpManager MSP software lets you remotely discover your client's VMs from its central console , eliminating the need fora local administrator to be present at the customer's site. With OpManager MSP, you can either add each VM manually into its inventory, or choose bulk discovery options to associate VMs and data stores to their corresponding hosts, such as ESXi, Hyper-V, Xen, or Nutanix.
Real-time VM performance monitoring for MSPs
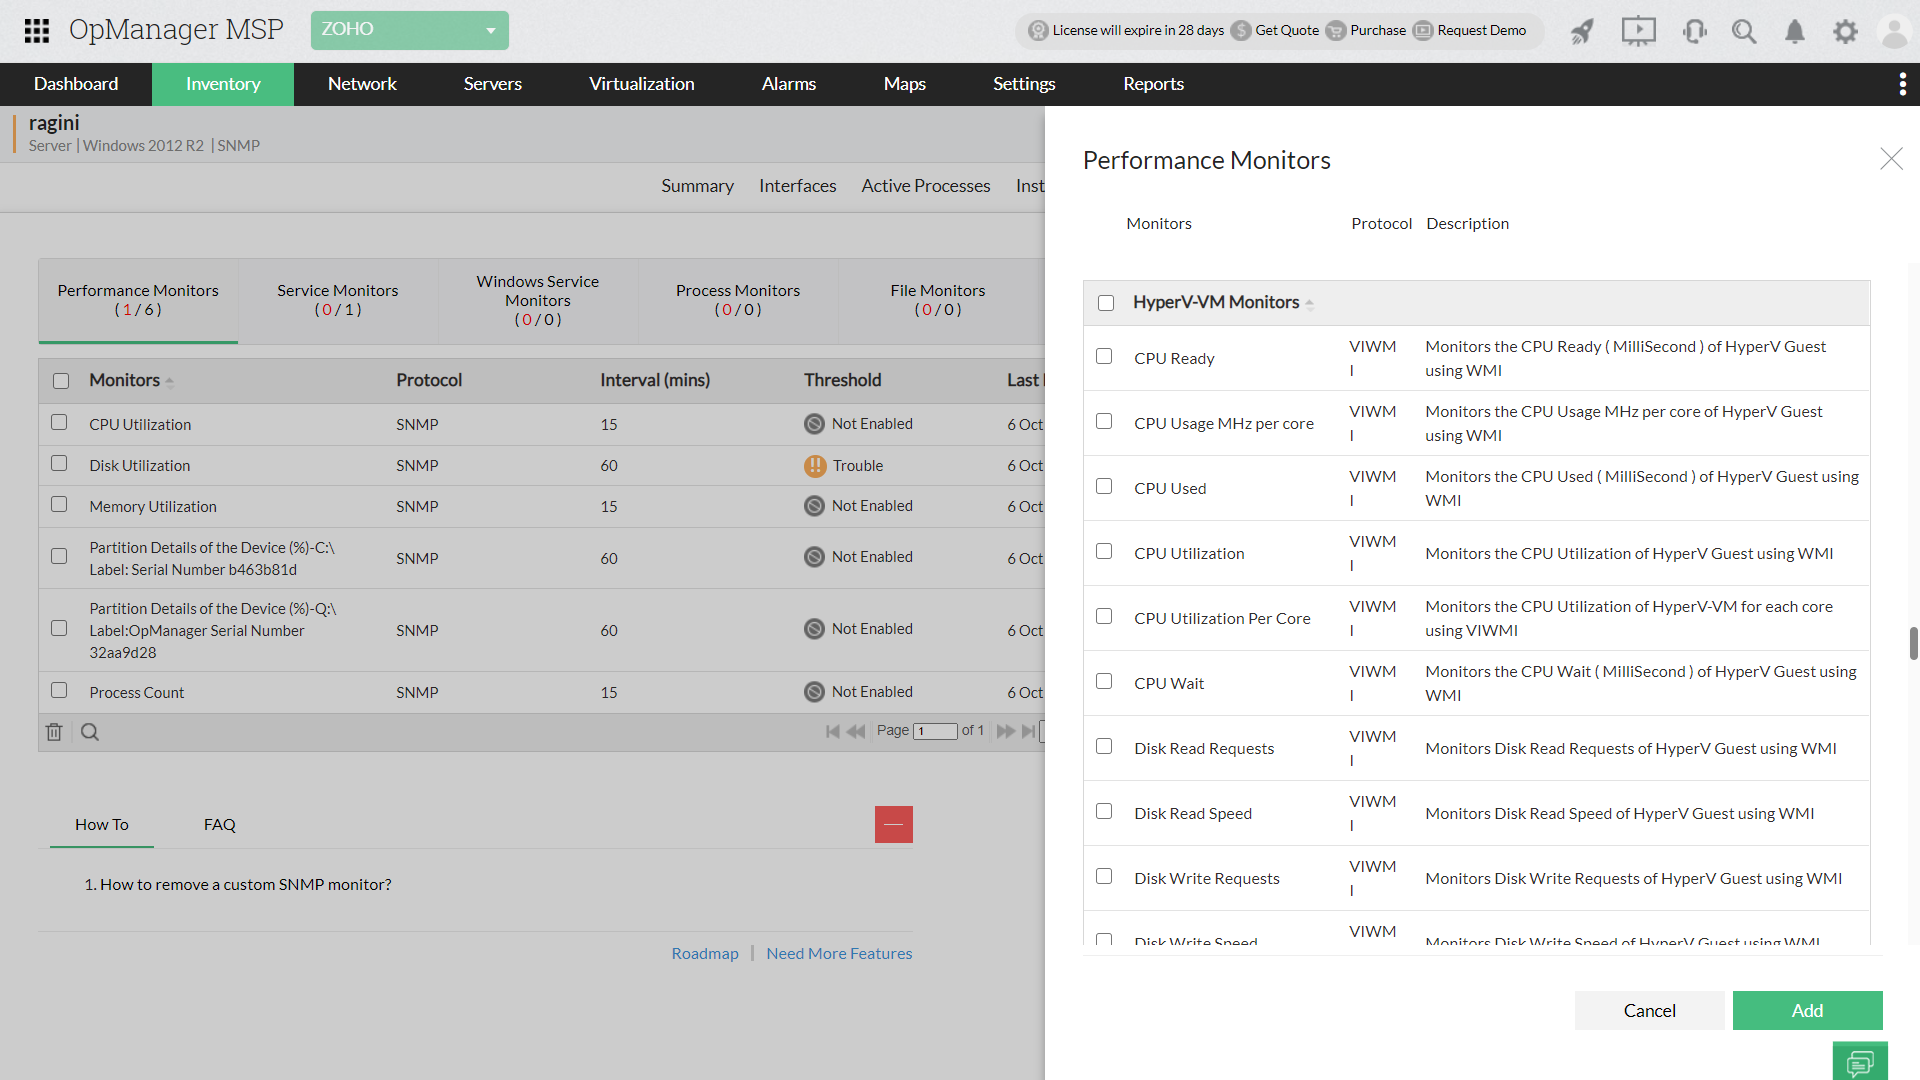
OpManager MSP lets you proactively monitor your client's VMs for performance, health and availability issues. With OpManager MSP, you can assign to VMs appropriate performance monitors from a wide range of options to track critical performance metrics. OpManager MSP uses APIs, such as VMware API, Xen API, and Prism API to fetch performance data from VMs. To obtain more visibility into performance metrics, OpManager MSP enables you to leverage SNMP/WMI/CLI protocols to retrieve additional data.
OpManager MSP software also offers manifold device templates, using which you can automate monitor association. Device templates associate a set of pre-defined performance monitors to VMs immediately after discovery. To supplement the default monitors, OpManager managed services also enables you to create custom monitors if you can get a hold the MIB files from the device vendors.
Alarm generation and dissemination
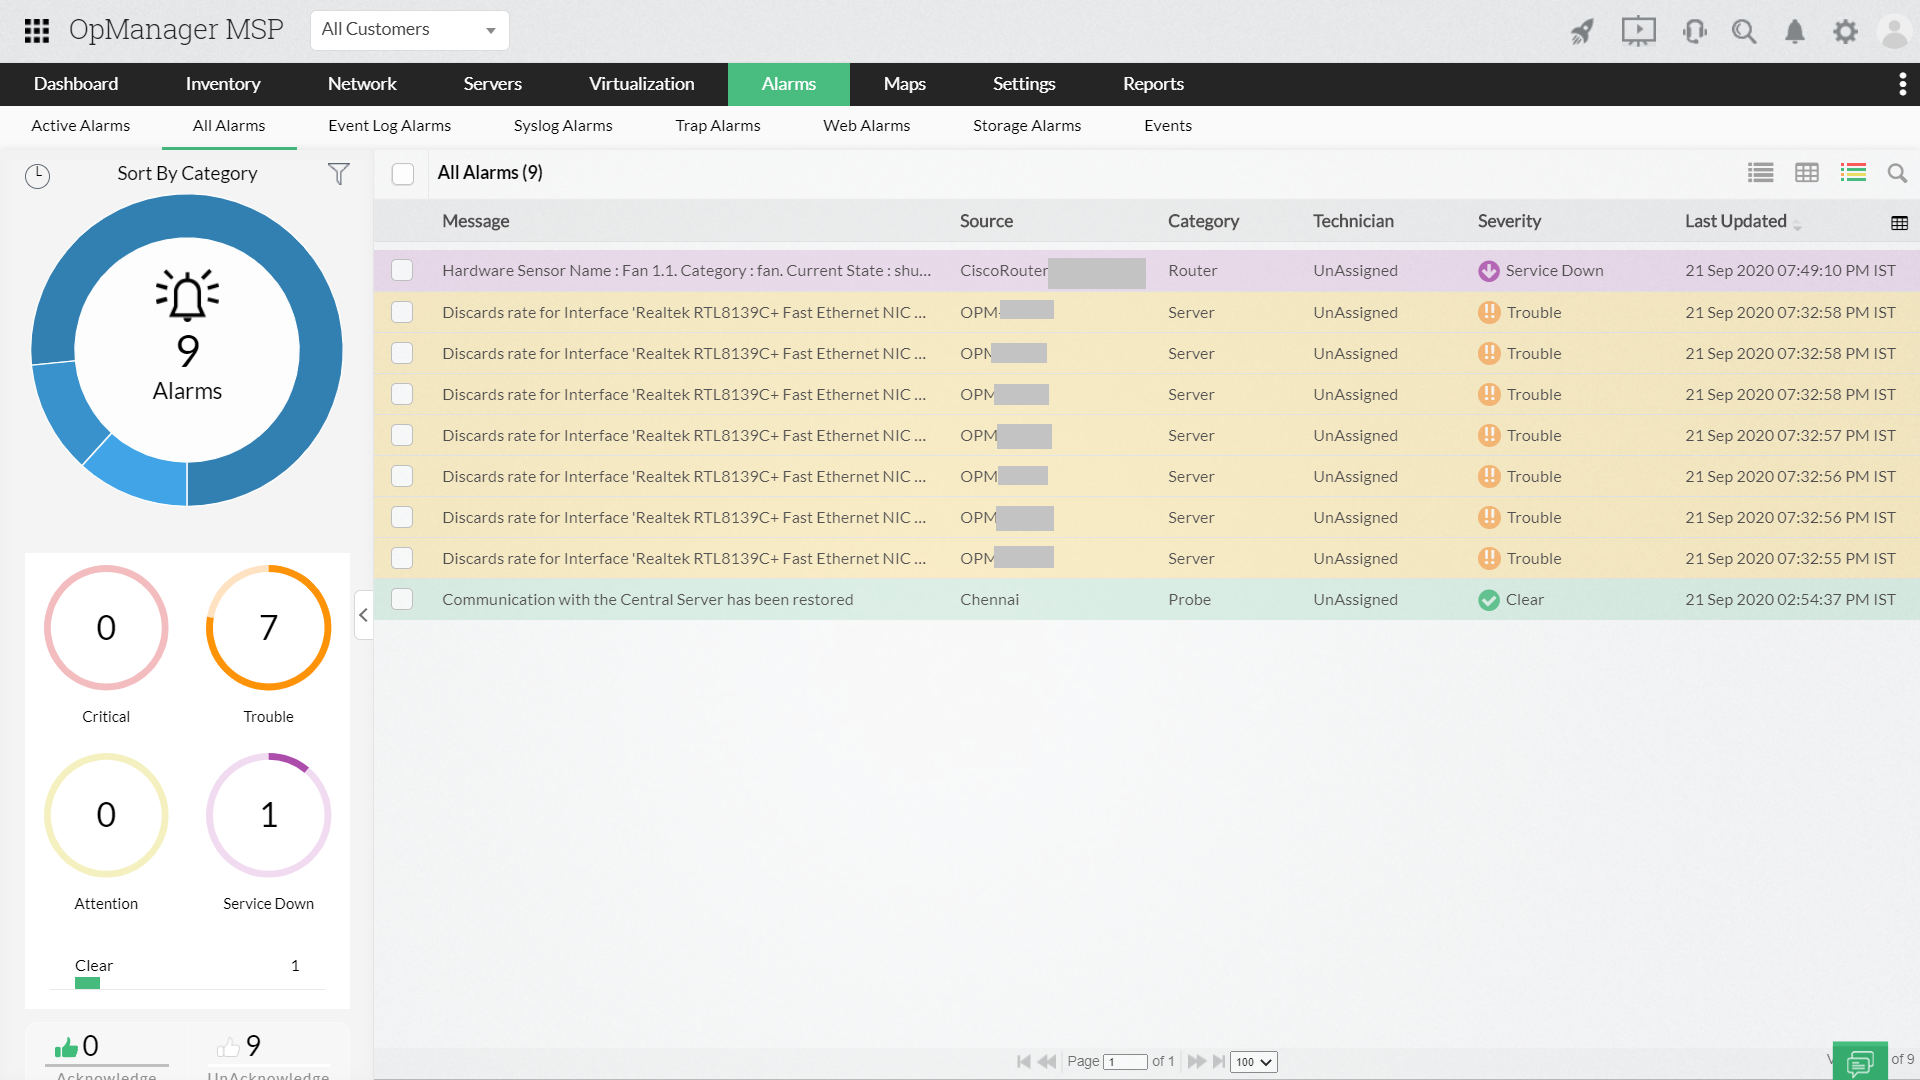
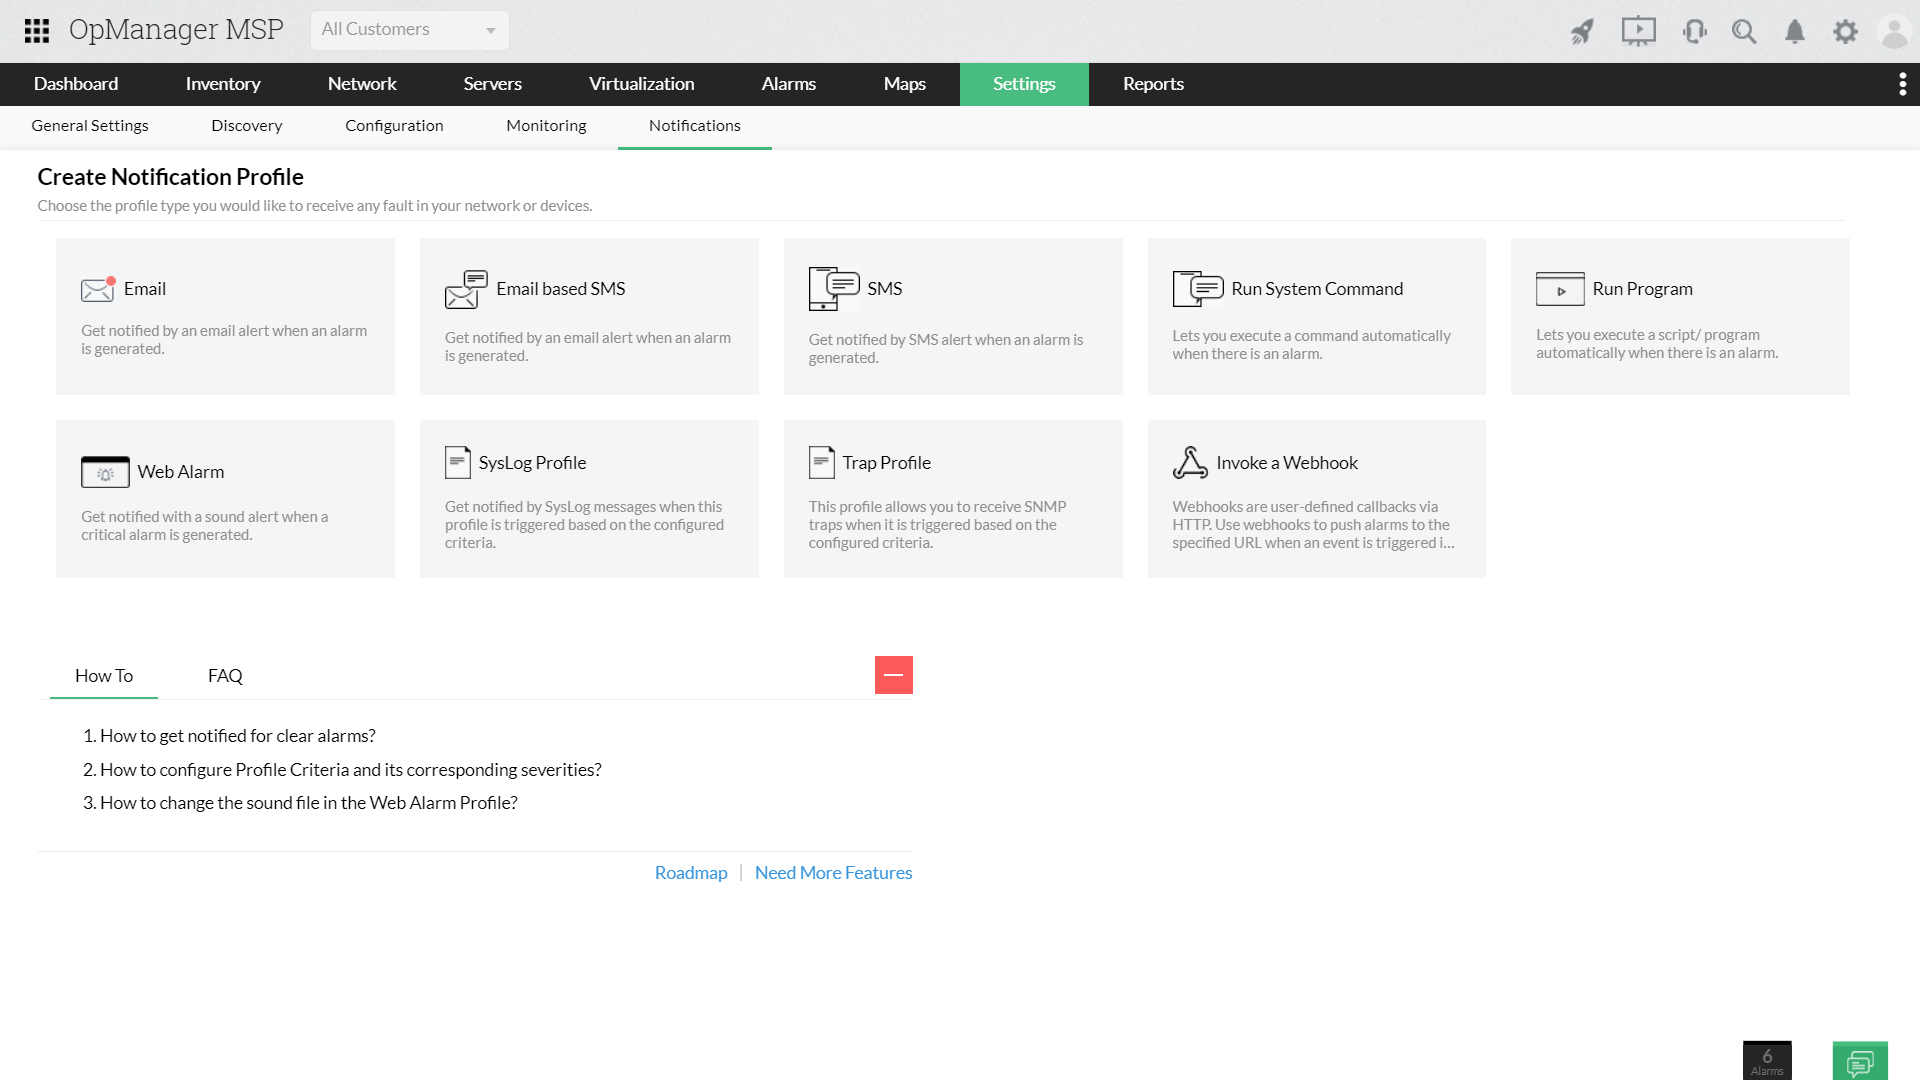
OpManager MSP triggers alarms when potential faults have been identified during monitoring. Alarms of all the clients are presented on the central console in a color-coded fashion based on severity levels. With OpManager MSP, you can acknowledge alarms to avoid redundant examination, suppress alarms for definite intervals, and escalate alarms to specific emails when they haven't been tended to or don't fall in the ambit of a technician's skill set. OpManager MSP software lets you create customized notification profiles, which help broadcast alarms over diverse media, such as email, SMS, Slack, etc.
Vivid virtual network visualization with topology maps for MSPs
Visualization of virtual environments helps track the availability of VMs across a client's network. OpManager managed services software lets you build topology maps which depict the relationship between VMs, hosts, and data stores. These maps help your technicians keep an eye on your client's VMs in groups. With OpManager MSP's topology maps, you can also track the migration of VMs across hosts.
Identification of underutilized resources for effective resource provisioning
OpManager MSP software paints a clear picture of the resource consumption levels of VM's from all your clients. This helps you identify resources which are underutilized, and spot the ones which consume excessive resources without churning out any value (zombie VMs). This helps you with effective resource provisioning, capacity planning, and averting VM sprawl.
Client-specific virtual network performance and availability reports for MSPs
OpManager MSP offers client-specific VM performance and availability reports containing historic virtual networks stats. You can either build new reports, or make use of pre-defined reports, such as Nutanix performance reports. These reports contain a wealth of information, and help generate actionable insights to enable better decision making. These reports can be either scheduled at defined intervals, or can be generated on-demand. Also, OpManager MSP lets you export these reports in multiple formats such as PDF, CSV, and XLS.
Client-specific holistic dashboards and widgets for MSPs
OpManager MSP offers holistic dashboards that provide you with a bird's-eye view of all critical VM performance, and availability metrics from a single console, eliminating the need to shift between multiple screens. With more than 70 widgets, these dashboards are highly customizable, and can be modified according to each client's network. OpManager MSP also offers a dedicated VM sprawl dashboard that enables to track VM resource consumption levels 24/7 to avoid to VM sprawl.
To learn more about how OpManager MSP can help you with monitoring VMs and virtual networks, download a 30-day free trial or register for a demo.
