Frequently Asked Questions
- General
- Licensing
- Connecting to Analytics Plus
- Data synchronization
- Data modeling
- Reports and dashboards
- Sharing and collaboration
- Need more help?
General
1. What is ManageEngine Analytics Plus?
ManageEngine Analytics Plus is a business intelligence and analytics solution that helps you to easily analyze your business data and create insightful reports & dashboards for informed decision-making. It can be set up with Jira Software in minutes, and offers 150+ prebuilt reports and dashboards.
2. Is Analytics Plus native to Jira?
ManageEngine Analytics Plus is a Jira Marketplace certified app and can be accessed from your Jira Software application. Simply navigate to Analytics Plus in the navigation bar, and select Home. This opens the ManageEngine Analytics Plus application, with out-of-the-box reports and dashboards built for Jira Software.
3. What are the Jira Software modules supported by the Analytics Plus application?
Analytics Plus offers out-of-the-box analytics using data from the following modules:
Sprints: Detailed list of the sprints created in Jira Software.
Backlogs: A record of every product backlog.
Projects: List of the projects configured in Jira Software.
Epics: Details of every epic created in Jira Software.
Issues: A history of the issues logged in Jira Software.
Worklog: A detailed record of the time logged in Jira Software.
4. How long is the trial period, or is there a trial period? Are there any feature restrictions during the trial period?
Analytics Plus offers a 30-day free trial. During the trial period, you have access to all of Analytics Plus' features.
5. Can I test this app in my Jira Software application?
Yes. You can test out Analytics Plus for free in your Jira Software application. Refer the Setting up the ManageEngine Analytics Plus application document for more details.
Or, sign up and provide a number, and we'll give you a call to help you get started. You can also check out the live demo from the same page.
6. What happens to my data after the free trial?
If you choose not to purchase a subscription at the end of your 30-day trial, or if you discontinue Analytics Plus during the trial period, your data will be permanently removed upon product uninstallation.
Licensing
1. Is Analytics Plus free?
You can try a free, 30-day trial of Analytics Plus. After that, you will need to subscribe to a paid plan. Click here to view the available pricing models.
2. How much does ManageEngine Analytics Plus cost?
The licensing model of the Analytics Plus app for Jira is based on the number of users and the deployment model. To learn more about the license packs, click here.
Connecting to Analytics Plus
1. How to download and set up Analytics Plus app for Jira?
You can easily download and install the ManageEngine Analytics Plus app from the Jira Marketplace. For detailed steps on the installation process, refer this documentation.
Note: You must be an Jira administrator to do this.
2. How to log in to ManageEngine Analytics Plus?
Since ManageEngine Analytics Plus supports single sign-on with Jira Software, users can simply click the Analytics Plus icon from the navigation bar, and select the Home button to access the application. This opens the Analytics Plus application with out-of-the-box reports and dashboards on your Jira Software data.
3. Why am I unable to launch Analytics Plus?
Ensure you allow cookies in your browser while setting up the ManageEngine Analytics Plus app. This is essential to access the application.
4. How do I start and stop the Analytics Plus application?
For Windows installations, you can start and stop your ManageEngine Analytics Plus application from the Services window. For Linux installations, use the start and stop scripts in the bin folder under your Analytics Plus installation. For detailed steps, refer this documentation.
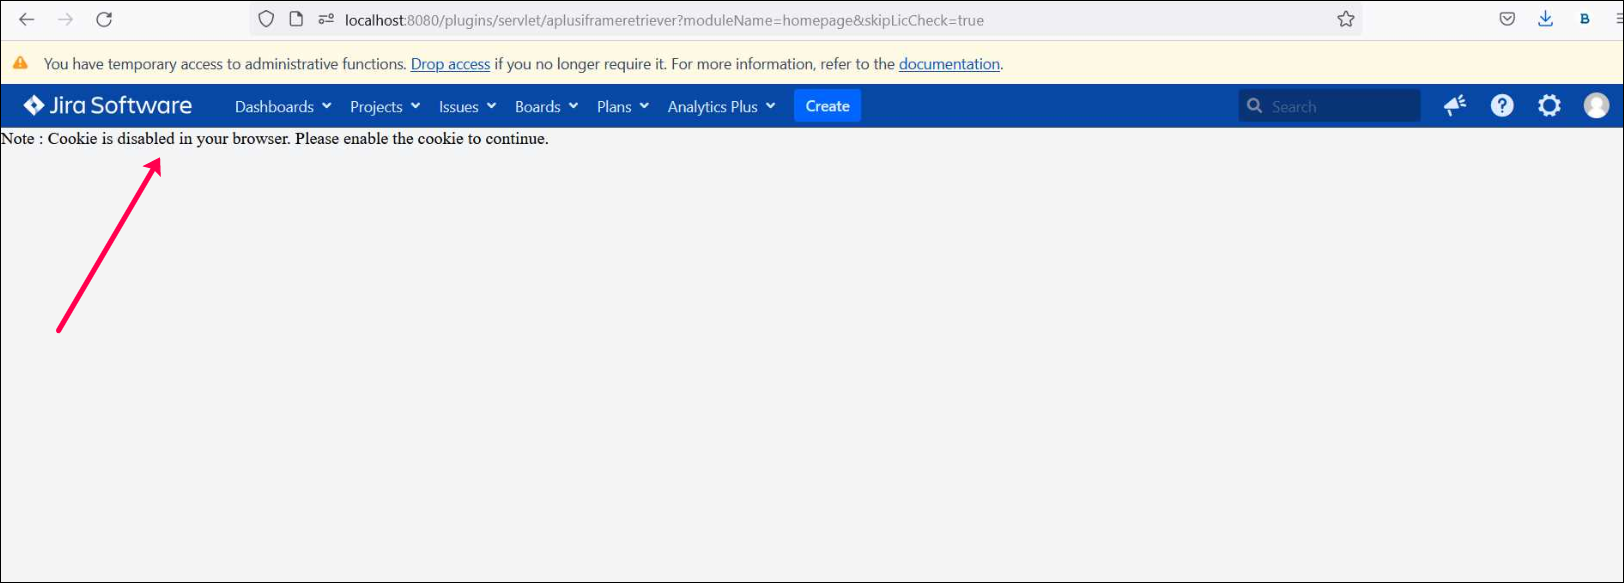
5. How do I overcome the "Cookie is disabled" error when accessing the app from a Chrome browser?
Users may face the "Cookie is disabled in your browser. Please enable the cookie to continue" error while accessing the Analytics Plus app from a Chrome browser.
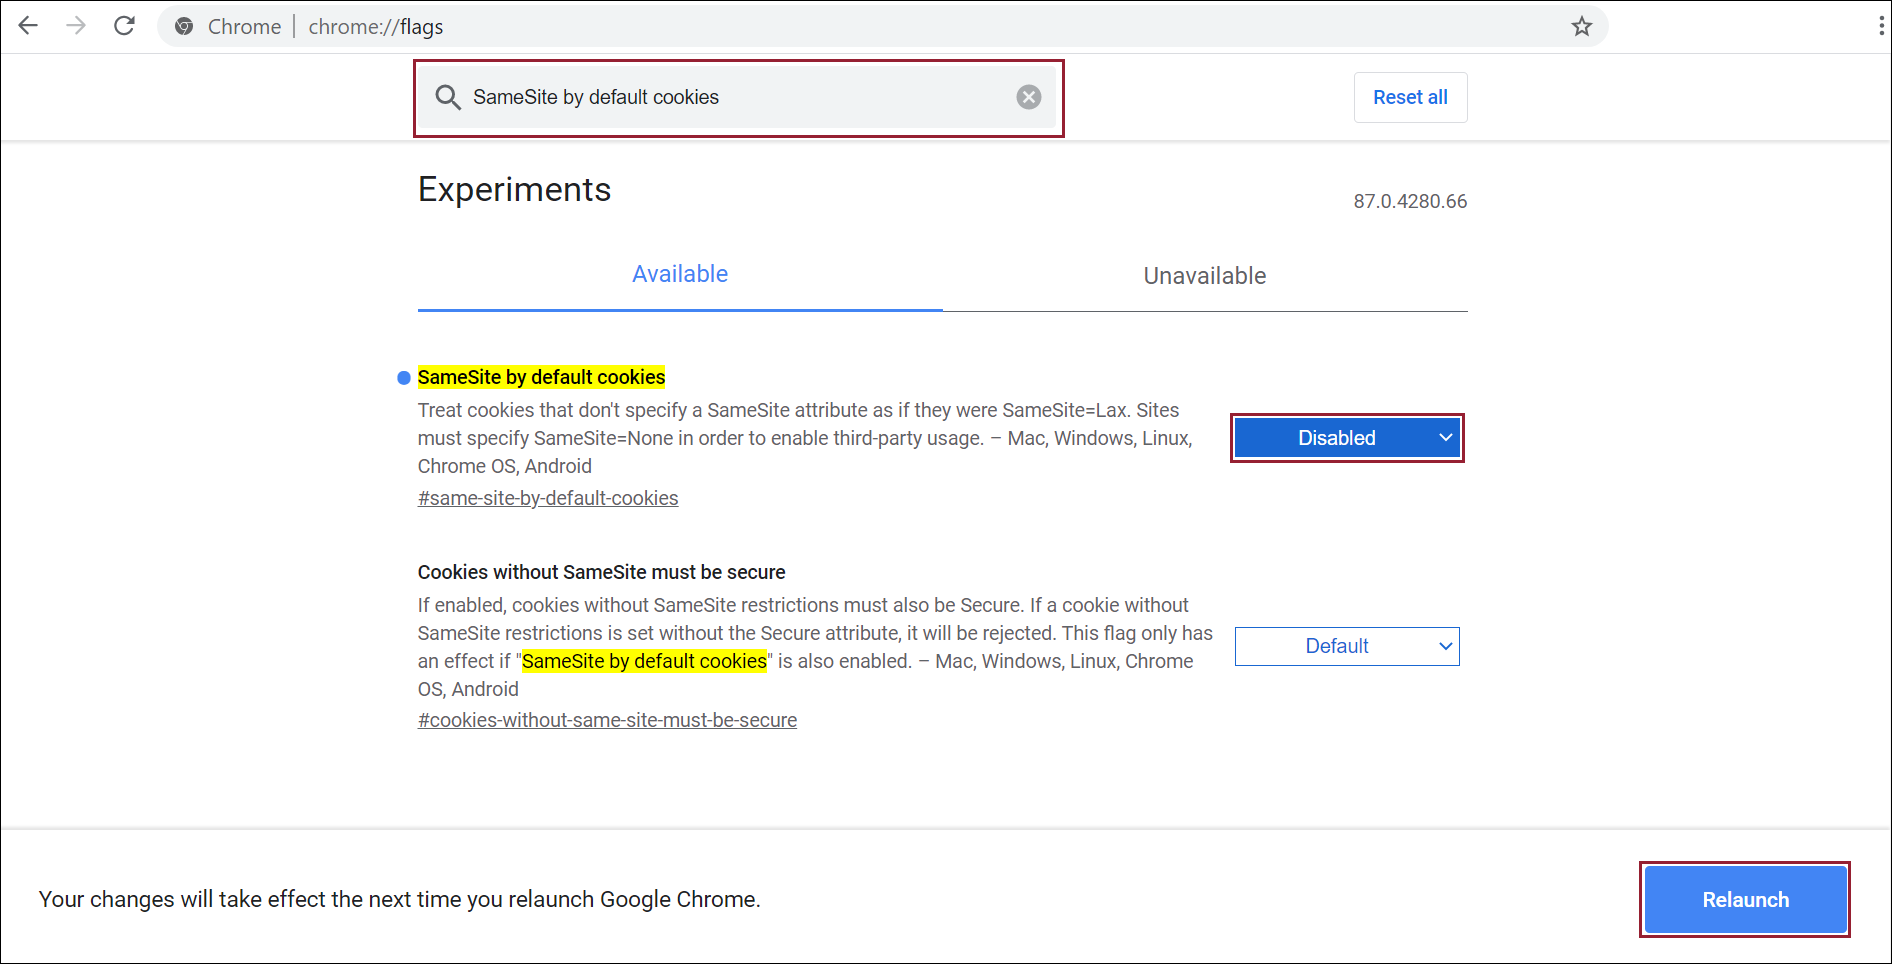
In addition to enabling cookies from Chrome's settings, users may also have to carry out the following steps to overcome this error.
Open the chrome browser and head to the following URL: chrome://flags
Search for the SameSite by default cookies flag.
Change the option of SameSite by default cookies to Disabled and click the Relaunch button that a in the bottom right corner.
Data synchronization
1. How long does it take for Jira Software data to appear in Analytics Plus after the initial setup?
After setting up your Analytics Plus account, you might have to wait for around 5-10 minutes for the initial data synchronization to complete. Once the initial data synchronization is done, subsequent changes in Jira Software will automatically be synchronized with Analytics Plus as per the schedule that you have set up.
2. What should I do when the data synchronization between Jira Software and Analytics Plus fails?
The synchronization of your Jira Software data can sometimes fail, due to several reasons. To resolve this, click the Analytics Plus button in the navigation bar, and select Home. This opens your Analytics Plus application. Select the Data Sources button from the left panel, and synchronize the application by clicking the Sync Now button. If this doesn't resolve the issue, you need to re-authenticate your Analytics Plus for Jira app by clicking the Re-authenticate link. For detailed steps, refer this documentation. If the issue still persists, please write to analyticsplus-support@manageengine.com, or use the Contact support form found under Analytics Plus in your navigation bar.
Note: Only the Jira Software administrator can re-authenticate Analytics Plus.
3. Why is my data not up to date in Analytics Plus?
Data from your Jira application is synchronized with Analytics Plus in 30-minute intervals. To synchronize your data manually, head to your Analytics Plus workspace from the navigation bar, and select Data Sources from the left panel. Click the Sync Now link in the page that appears to bring your data up to date in Analytics Plus.
Data modeling
1. Does ManageEngine Analytics Plus support Relational modeling?
Analytics Plus supports the relational modeling of your data tables. Lookup columns are used to join your Jira Software data tables for advanced analysis and reporting across varied data, and is already set up out of the box.
2. Can I join tables / datasets to create reports in ManageEngine Analytics Plus?
Joins between Jira Software tables are pre-configured based on the optimum relationship between different modules. We recommend that these joins may not be altered, unless instructed by our technical support team. However, to join new/custom tables or datasets, you can use one of the following options.
Configure a Lookup: A lookup can be configured between two tables with similar or related data columns. For example, consider two tables - Sales and Product.

To join these tables, the Product ID column in the Sales table has to be converted into a Lookup Column, that looks up the Product ID column in the Product table. The simplest way to define a lookup relationship is to open the child table (Sales table in the example above) and right-click the column. Click the Change to Lookup Column option and select the corresponding column to lookup in the parent table (Product table in the example above).
Once the lookup relationship is established, columns from the Sales and Product tables can be used in the same report. Similarly, the Sales and Sales Person tables can be joined by defining a lookup relationship through the Sales Person ID column.
Query tables: A query table can be created using SQL joins between multiple tables. You can save the results from the query into a new table and create any type of reports for analysis and visualization.
Reports and dashboards
1. What are the types of reports that can be created in Analytics Plus?
Analytics Plus supports a wide variety of report creation options:
Charts: You can create more than 25 different types of charts, such as Pie charts, Bar charts, Map charts, etc.
Pivot tables (also known as Matrix Views): You can create powerful visualizations with data summarized in a grid, both in horizontal and vertical columns.
Tabular views: Create simple table views that allow you to group columns and apply varied advanced summary functions (Average, Running total, etc.).
Summary views: Create summary views to summarize and group large amounts of data.
2. How to create reports in Analytics Plus?
There are two ways to create reports in Analytics Plus:
Click the +Create button in the side panel of Analytics Plus. Select the required report type, and select the base table over which you wish to create a report. Drag and drop the needed columns from the fields listed on left into the shelves on the right to generate your report.
A faster way to generate reports is to use Ask Zia, the search-driven analytics assistant in Analytics Plus. Powered by machine learning and natural language processing, Zia allows you to type in your questions in plain english and generates powerful insights immediately, in the form of relevant visualizations. You can access this by clicking the Ask Zia button from the left panel of your workspace.
3. Does Analytics Plus support dashboard creation?
Analytics Plus allows you to create custom dashboards and widgets through an easy, drag-and-drop interface. Dashboards facilitate a quick view of your key business information by displaying a collection of reports on a single page, for easy analysis and visualization. KPI widgets allow you to add single-numbered and chart type widgets, to highlight key metrics in the dashboard.
4. Are dashboards in Analytics Plus customizable?
Analytics Plus offers a wide range of options to customize dashboard design and create a visually rich dashboard quickly. Some of the customization options are:
Theme customization: You can apply themes to improve the look and feel of your dashboard. Analytics Plus provides a set of preset themes, which can be customized to suit your needs.
Show/Hide Report Title and Description: You can customize the reports in the dashboard to show or hide the report title and description. This option is available only in the Edit Design mode.
Show Report Specific User Filters: This option allows you to apply filters on a specific report without disturbing the other reports. To access this option, open the dashboard in the Edit Design mode, click the Options button of the specific report, and select the Show Report Specific User Filter option.
Include/Exclude Dashboard Filters: When you want your reports to remain unchanged regardless of the filters applied in the dashboard, you can easily exclude the user filters from being applied on a specific report using the Apply Dashboard Filters option.
5. What is the difference between a pivot and a summary report?
A pivot and a summary report are both tabular representations of data.
A pivot view is recommended for reports that include many fields, and for reports where you are trying to group the results based on certain fields. For example, a report on the sales figures by category and product.
A summary report is recommended for when you want to list details. For example, a report on the details of requests raised in the current month.
Sharing and Collaboration
1. Can I share my data and reports created in ManageEngine Analytics Plus with other Jira Software users?
You can easily share your data tables, reports and dashboards created in ManageEngine Analytics Plus with other Jira Software users, using the Share button found in the top right corner of all reports, dashboards and tables. You just need to provide the e-mail address and set the necessary permissions for the views being shared. To learn more, refer to the Sharing and collaboration section.
2. Can I export the reports created in Analytics Plus? If yes, what are the supported formats?
You can export the reports and dashboards created in Analytics Plus by clicking the Export button found in the top right corner of every report, dashboard and table. The visualizations can be exported in the following formats:
CSV - Exports the underlying data of a report as a Comma Separated Value (CSV) file.
PDF - Exports the report/dashboard as a printer-friendly Portable Document Format (PDF).
HTML - Exports the report / dashboard as a HTML document.
Excel (XLS) - Exports the underlying data of a report as an Excel file.
Image - Exports charts as a GIF or PNG image.
3. Can I e-mail the reports as an attachment? If yes, can I schedule the e-mails to be sent automatically at specified time intervals?
Yes, you can e-mail the reports and dashboards created in Analytics Plus by clicking the e-mail icon found in the top right corner of all reports and dashboards. To schedule these e-mails,
Open the specific report or dashboard, click the e-mail icon and choose the required format.
Specify the e-mail address of the users you want to share the visualization with and customize the subject and description of the e-mail as needed.
To schedule for users to receive this email periodically, select the Schedule this email option, and choose the frequency from the drop down menu, and click Send.
The report will automatically be sent as an e-mail attachment at the specified time intervals, and you can also choose to e-mail multiple reports together.
4. How do I use the collaboration feature in real time?
You can collaborate efficiently with your colleagues in real time using the Commenting option. Follow the steps given below to do this:
Open the required report or dashboard and click on the Comment icon.
Add a collaborator by sharing the view, or if you've already shared the view to a set of users, make sure the Allow Commenting permission is selected.
Once that's done, type in your message and click Post.
You can also attach other reports from the workspace to your comment thread using the attachment icon at the bottom. To learn more, refer to the Sharing and collaboration section.
Need more help?
1. Do you offer free technical support during the trial period?
Yes. Technical support is free for all users, even during the trial period. There is no separate charge to receive support during the trial period.
You can contact technical support through:
Email: analyticsplus-support@manageengine.com
Phone: +1.888.720.9500
You can also try searching our documentation online or get answers straight from our community.
2. Can I get a personalized demo of the software?
Yes, please send us an e-mail at analyticsplus-support@manageengine.com. Additionally, you can use the Contact Support form found under your ManageEngine Analytics Plus app in your Jira Software application, and we'll set up a personalized demo of Analytics Plus for you right away. You can also access the form from this link.
3. How can I request for new reports / features with Analytics Plus?
For requests of additional reports or any new features, please drop us an e-mail at analyticsplus-support@manageengine.com. You can also use the Contact Support form in this link, or found under the ManageEngine Analytics Plus app in your Jira Software application.