Gain comprehensive insight into your application architecture as you seamlessly discover, visualize, and map dependencies across your entire application stack. Monitor the health, availability, and performance of a diverse range of application and infrastructure components, including application servers, databases, websites, middleware, ERP systems, cloud resources, containers, and more, all through a unified console.
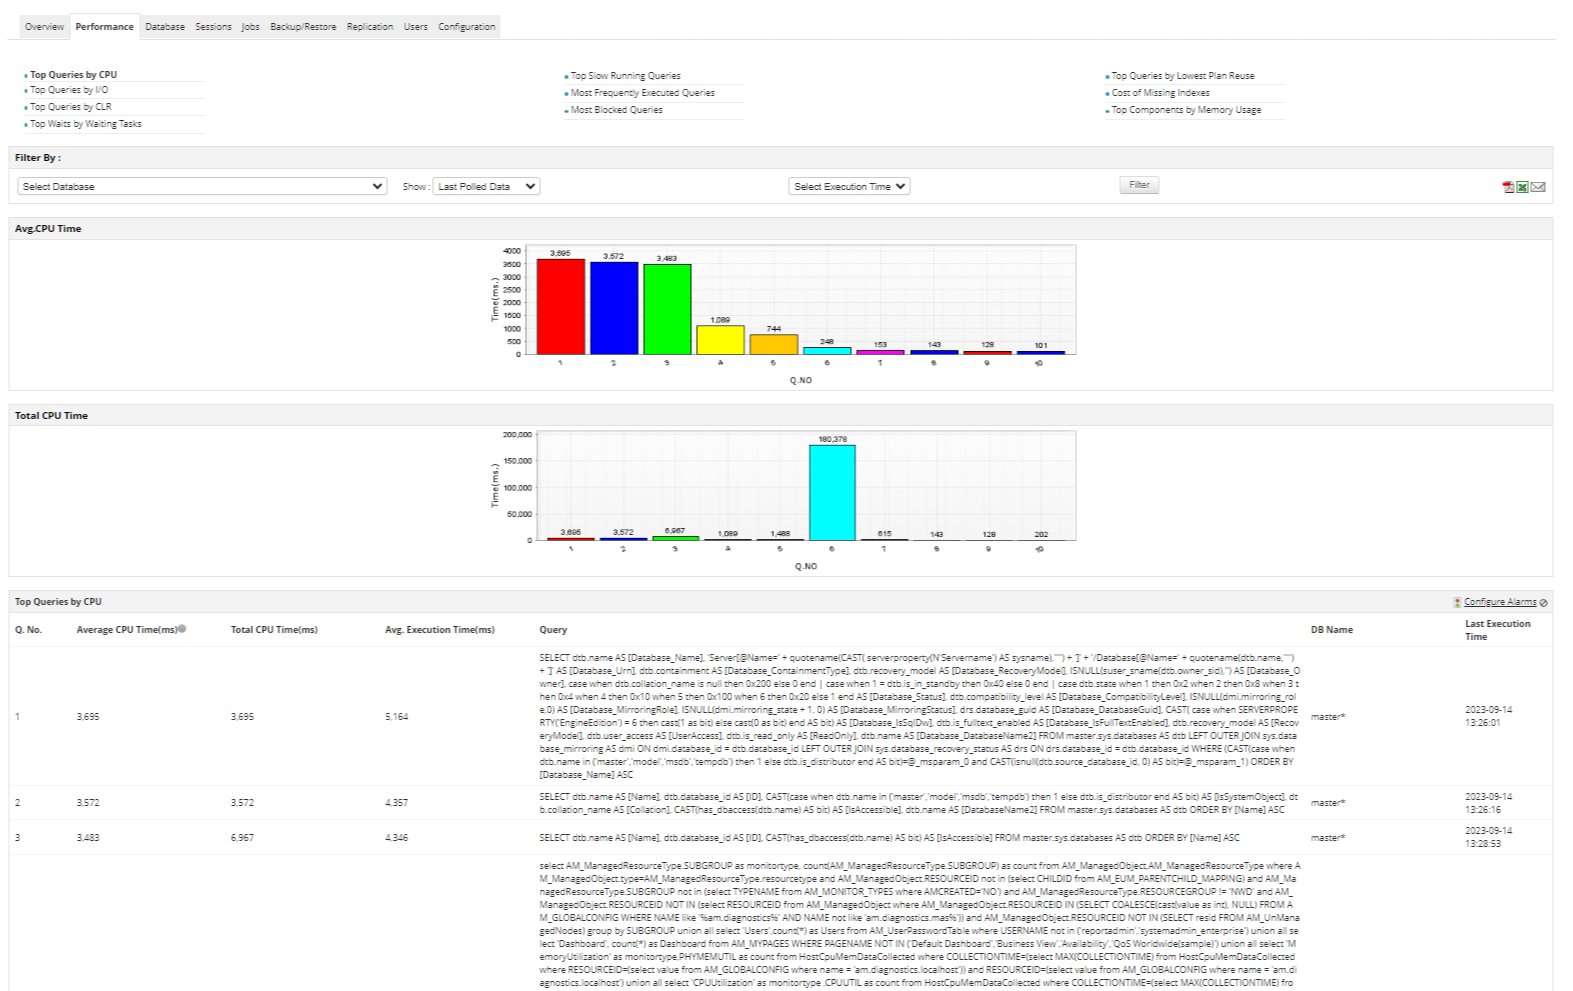
Proactively monitor business critical metrics across your relational, NoSQL (non-relational SQL), in-memory, and key-value databases. Deep dive into database transactions and track key metrics like user sessions, backups, jobs, locks, connection stats, replication details, and more. Analyze, identify slow-running queries and quickly pinpoint the root cause of issues.
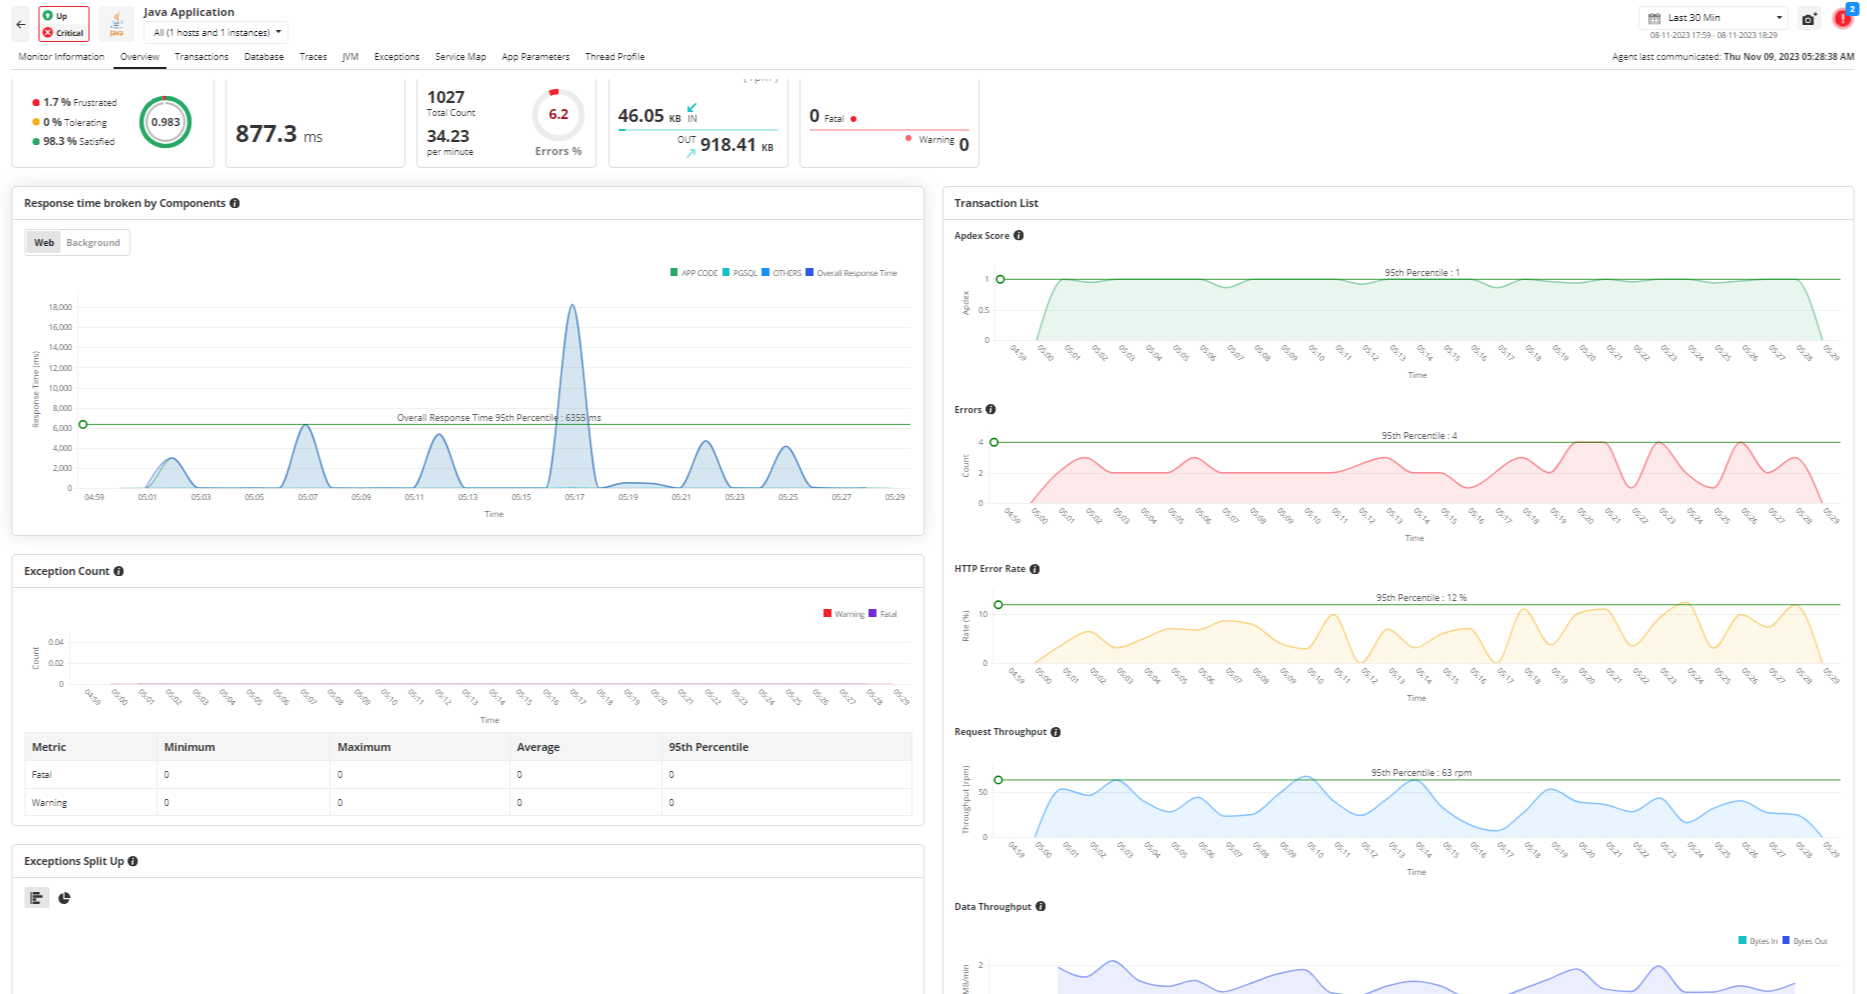
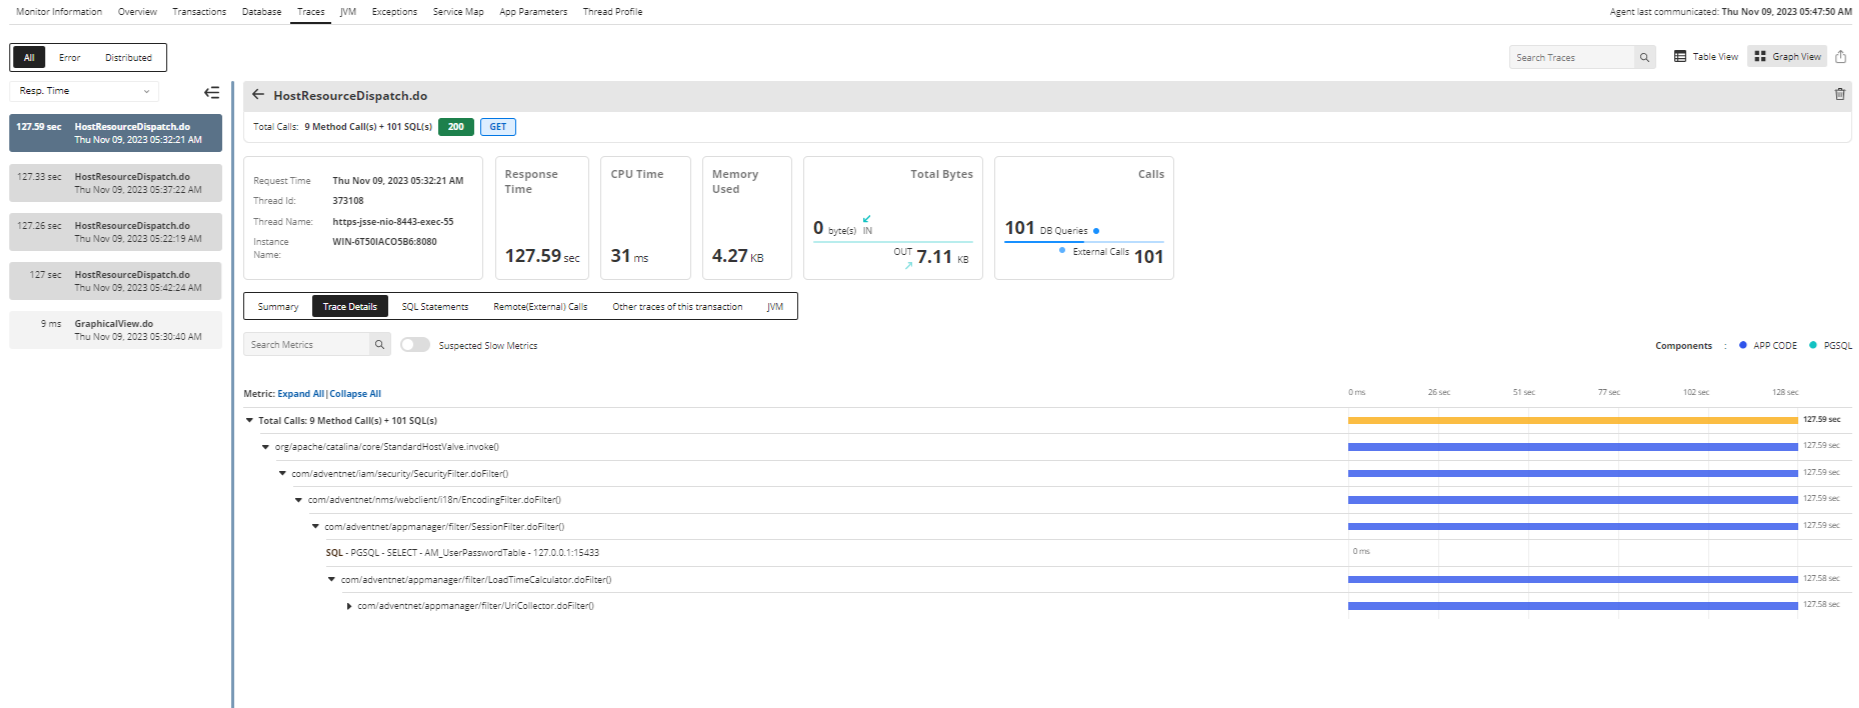
Gain holistic code-level visibility into the performance of your applications running on Java, .Net, .Net core, PHP, Ruby on Rails, Python, and Node js platforms. Leverage distributed tracing to track transactions across your microservices seamlessly. Track errors, exceptions, and easily eliminate performance bottlenecks.
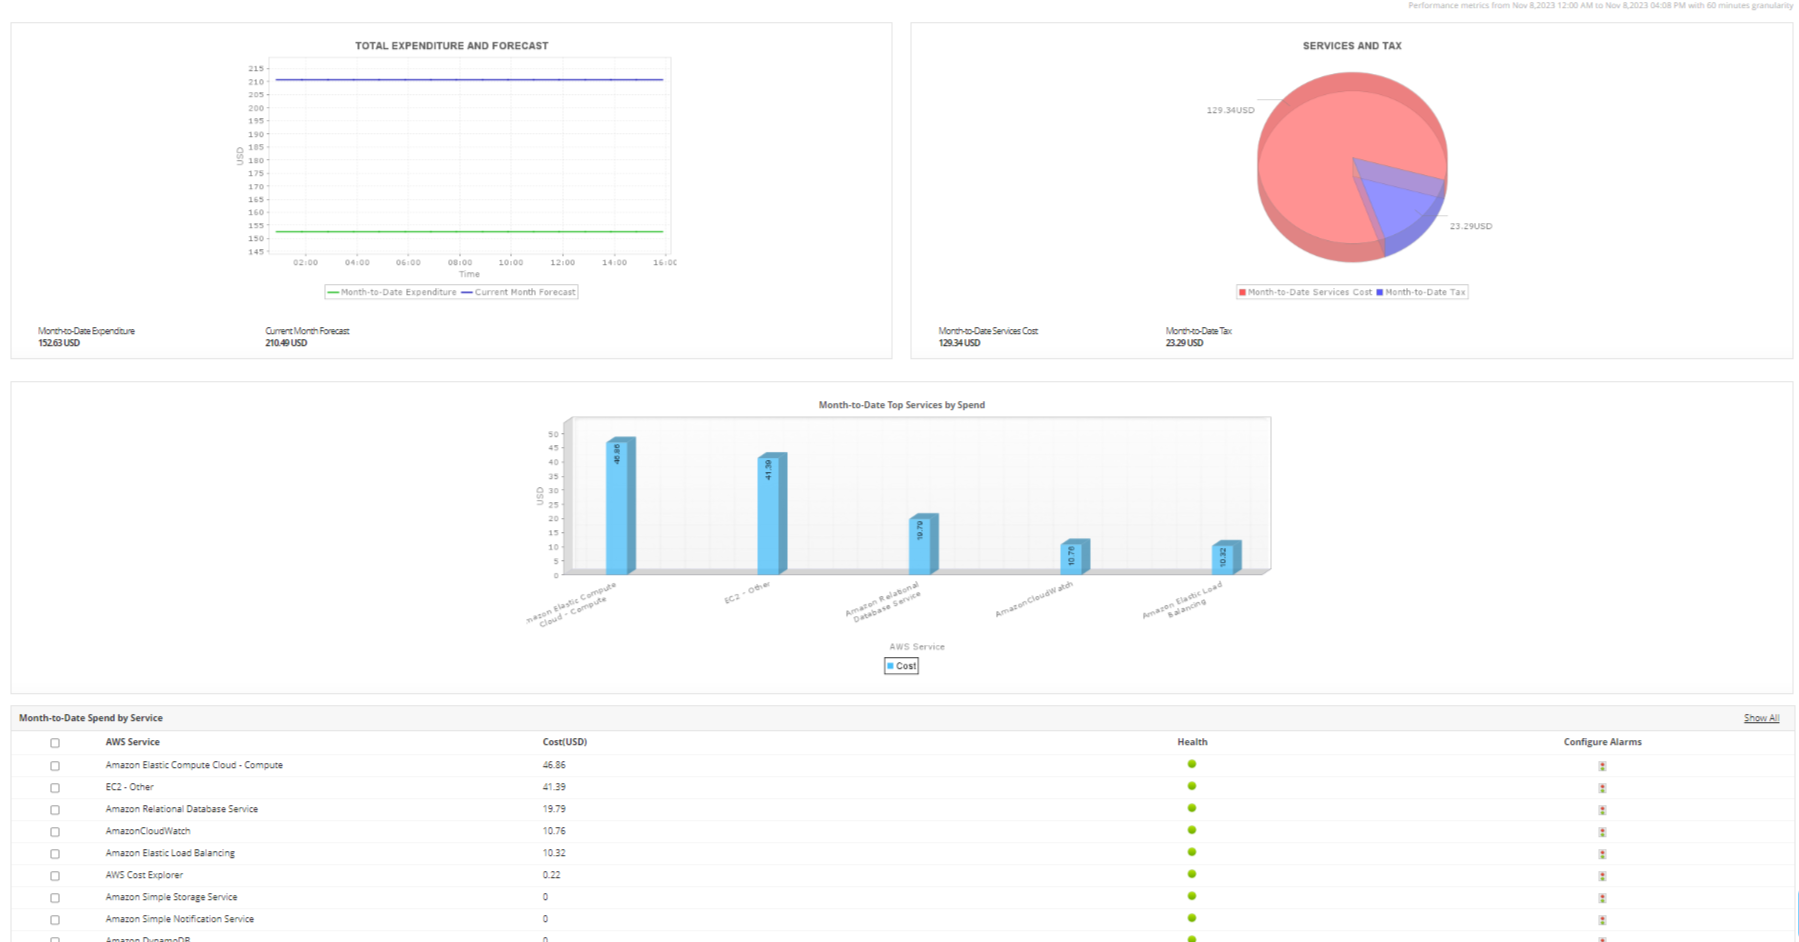
Effectively monitor private, public, and hybrid cloud stacks across your vendors like AWS, Azure, Google, Oracle, OpenStack, and others. Enhance the efficiency of your cloud migration process by analyzing performance trends both before and after migration. Understand resource utilization and manage cloud costs better.
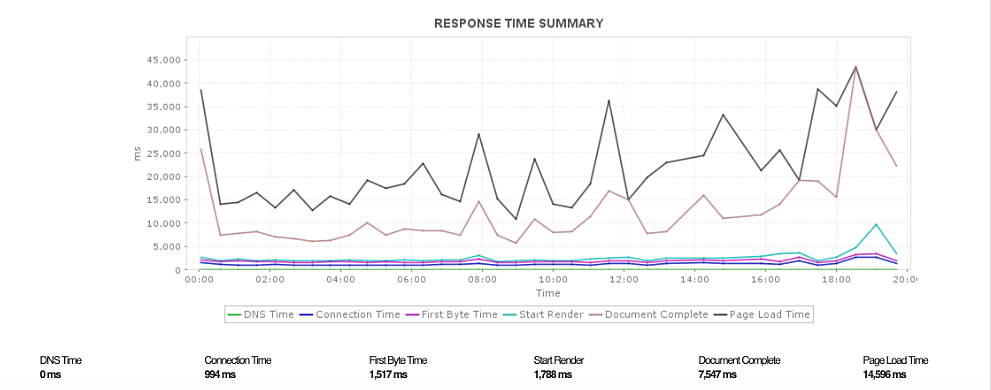
Track the availability and performance of your websites. Get notified instantly when the website goes down, or if the page loading time increases. Auto-crawl and monitor website for content changes to prevent unauthorized changes or website defacement. Analyze website performance for insights to improve page speed.
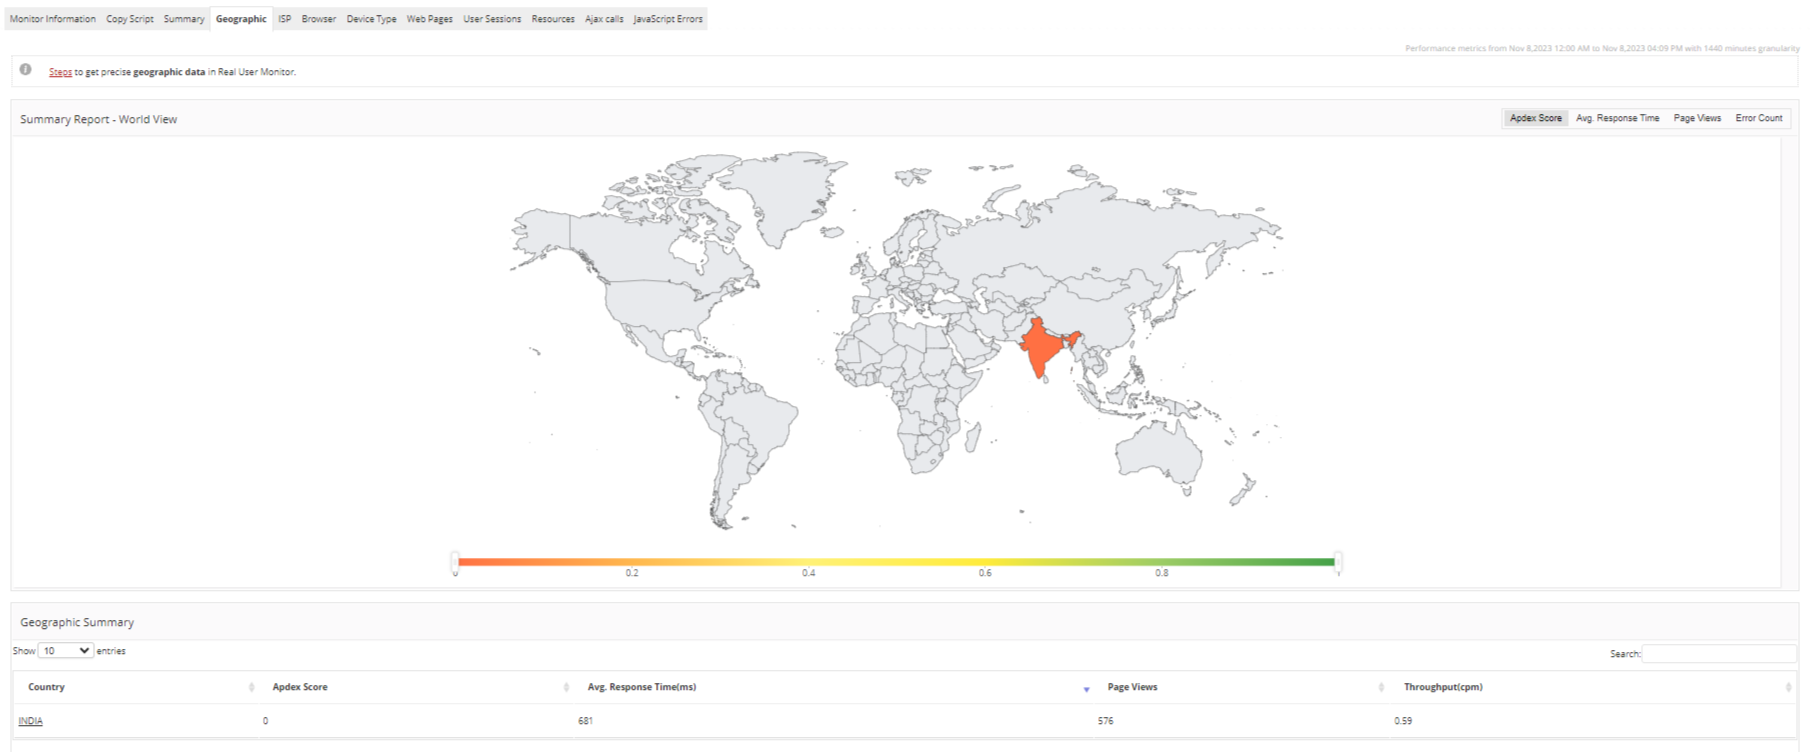
Deliver uninterrupted digital experiences to your end users by harnessing the capabilities of both synthetic and real user monitoring. Employ synthetic monitoring to replicate user journeys in pre-production environments, proactively identifying and remedying performance issues. Concurrently, leverage real user monitoring to gain immediate insights into user interactions and experiences across diverse geographical locations.

a) The free, 30-day trial of the plugin
b) The full license activation of the plugin
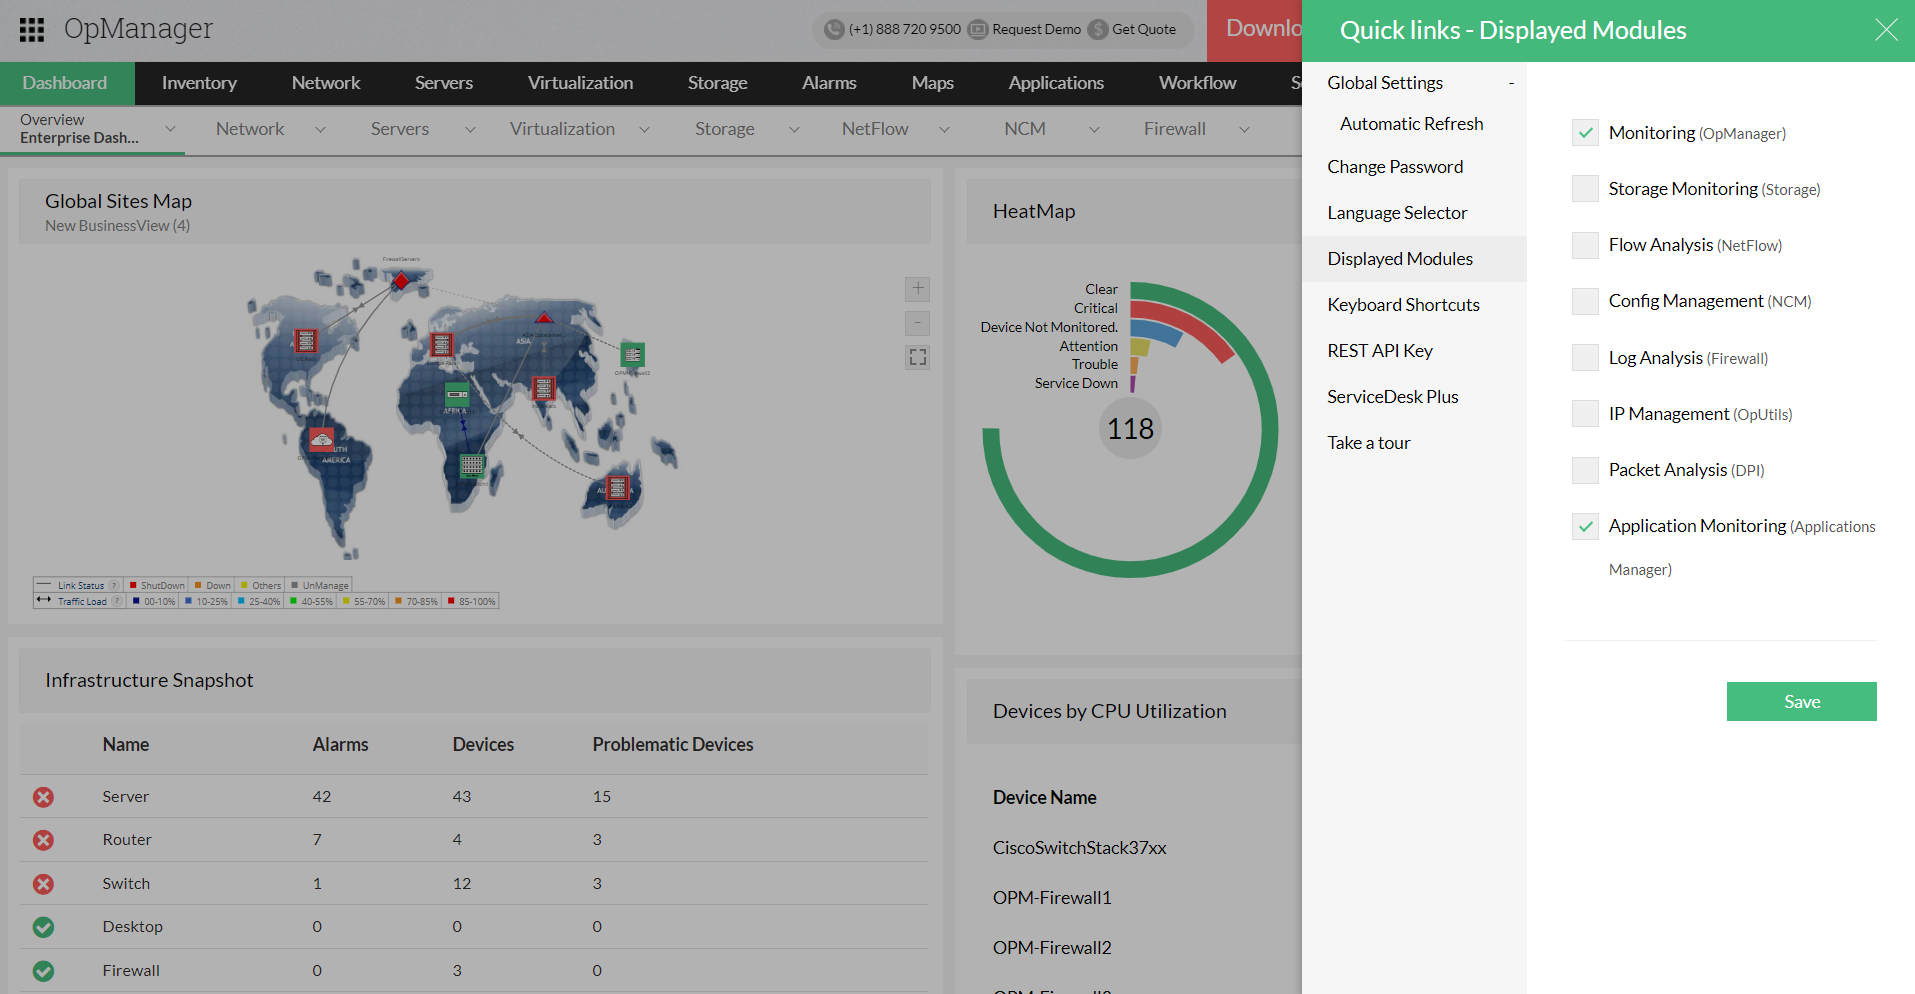
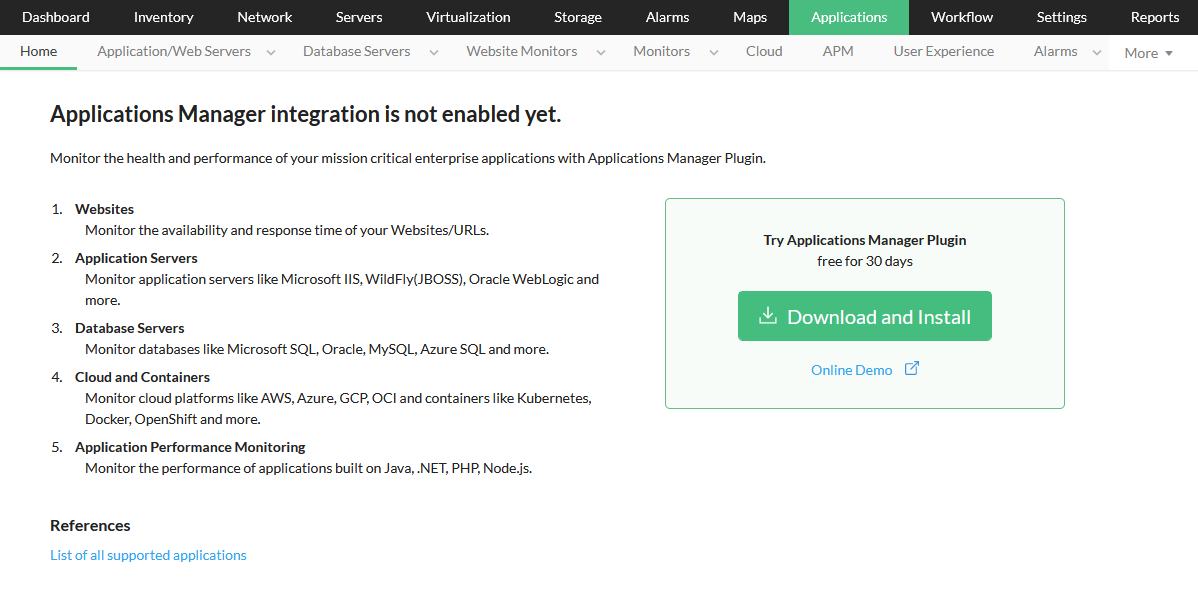
You can choose the number of monitors for the Applications Manager plugin and acquire them, which will activate the add-on right away.
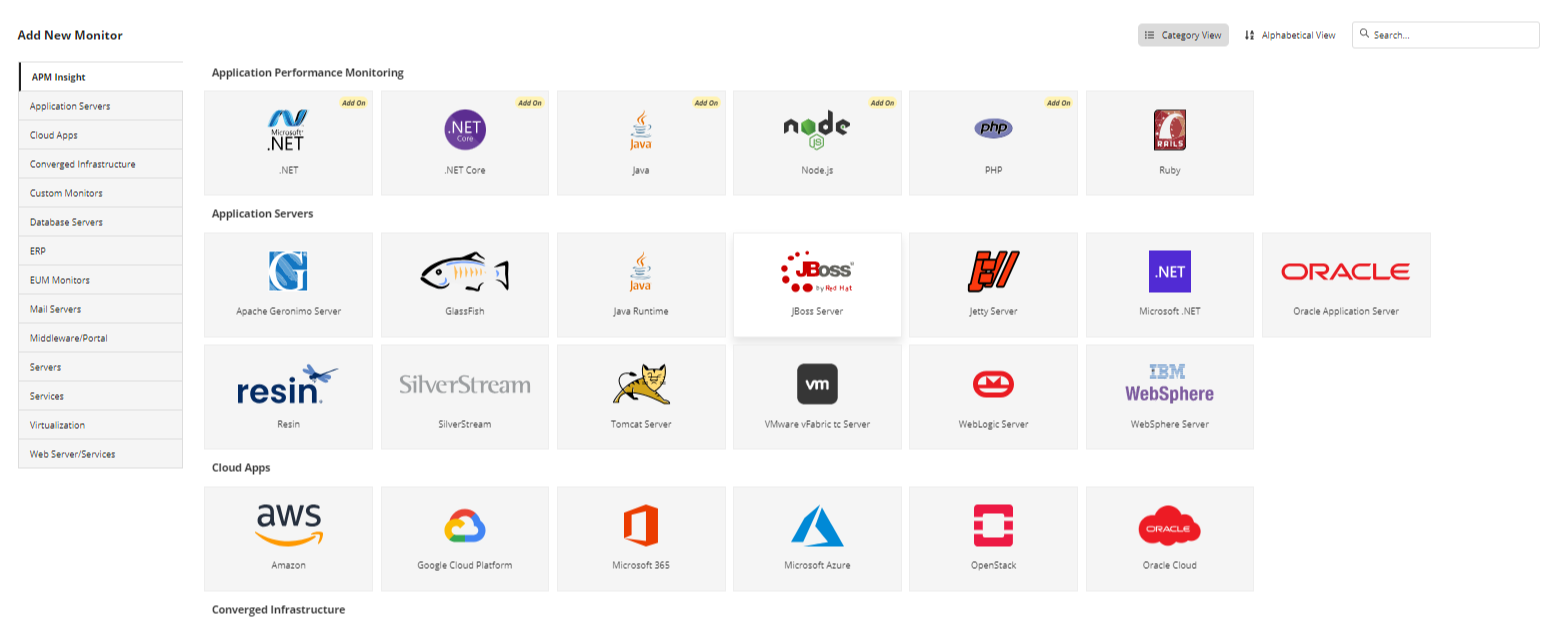
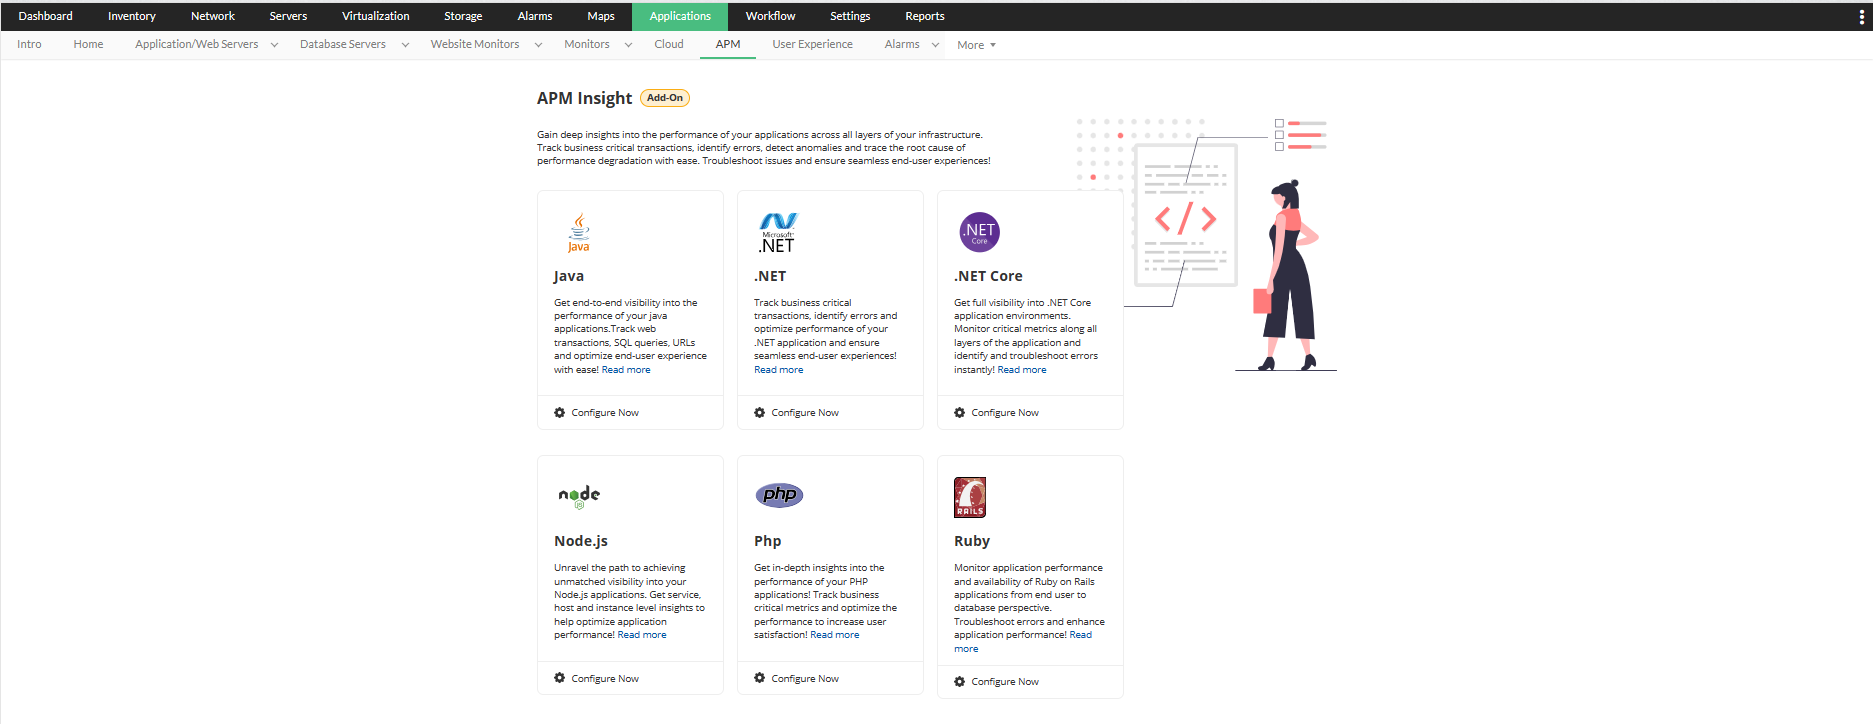
To access the Application Performance Monitoring (APM) module, download the APM Insight agent of your choice.
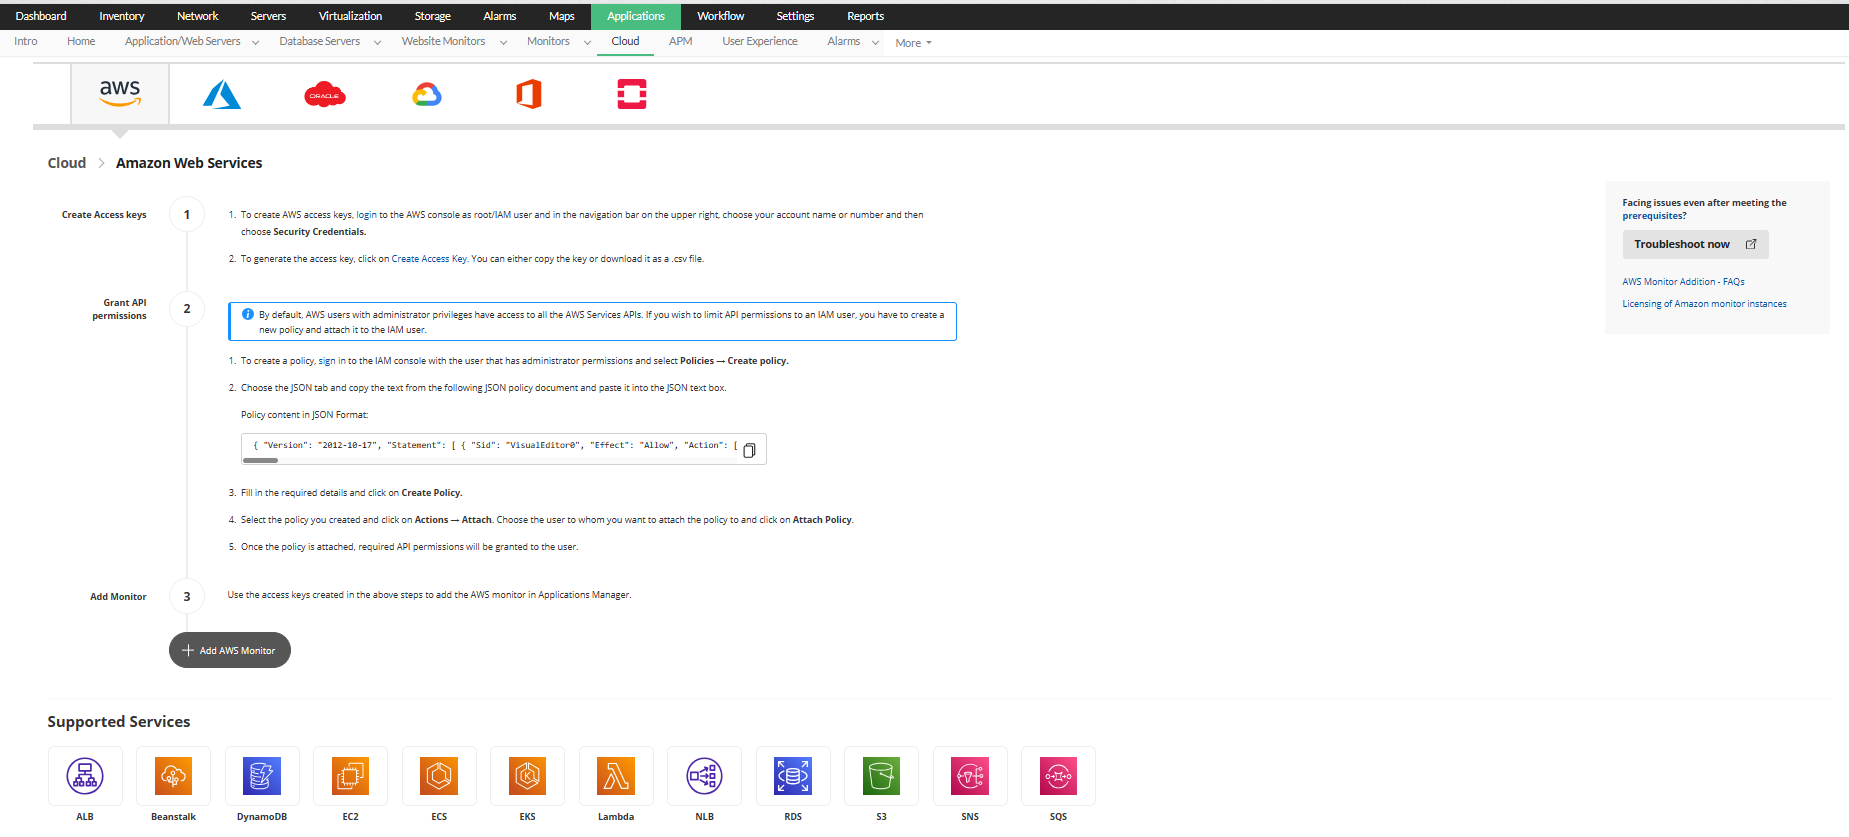
To activate cloud monitoring, navigate to the Cloud tab and configure your preferred vendor settings.
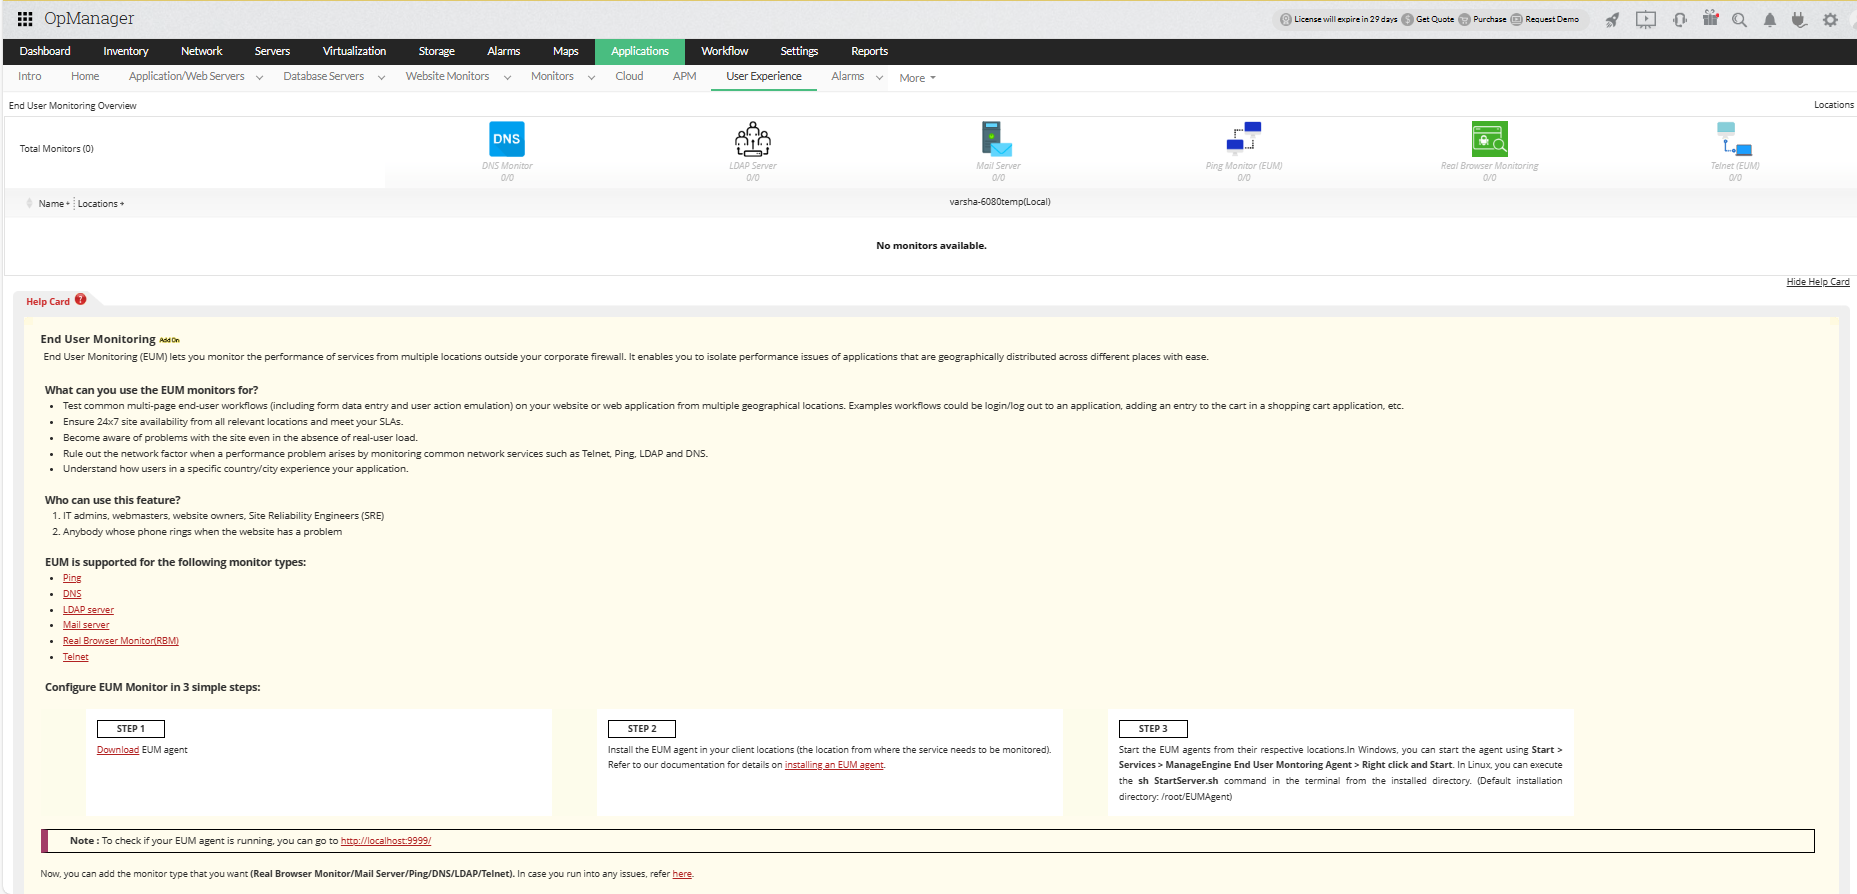
To enable End user experience monitoring, download the EUM agent. To add a Real Browser Monitor, you need to add the Applications Manager Web Transaction Recorder extension to your browser.
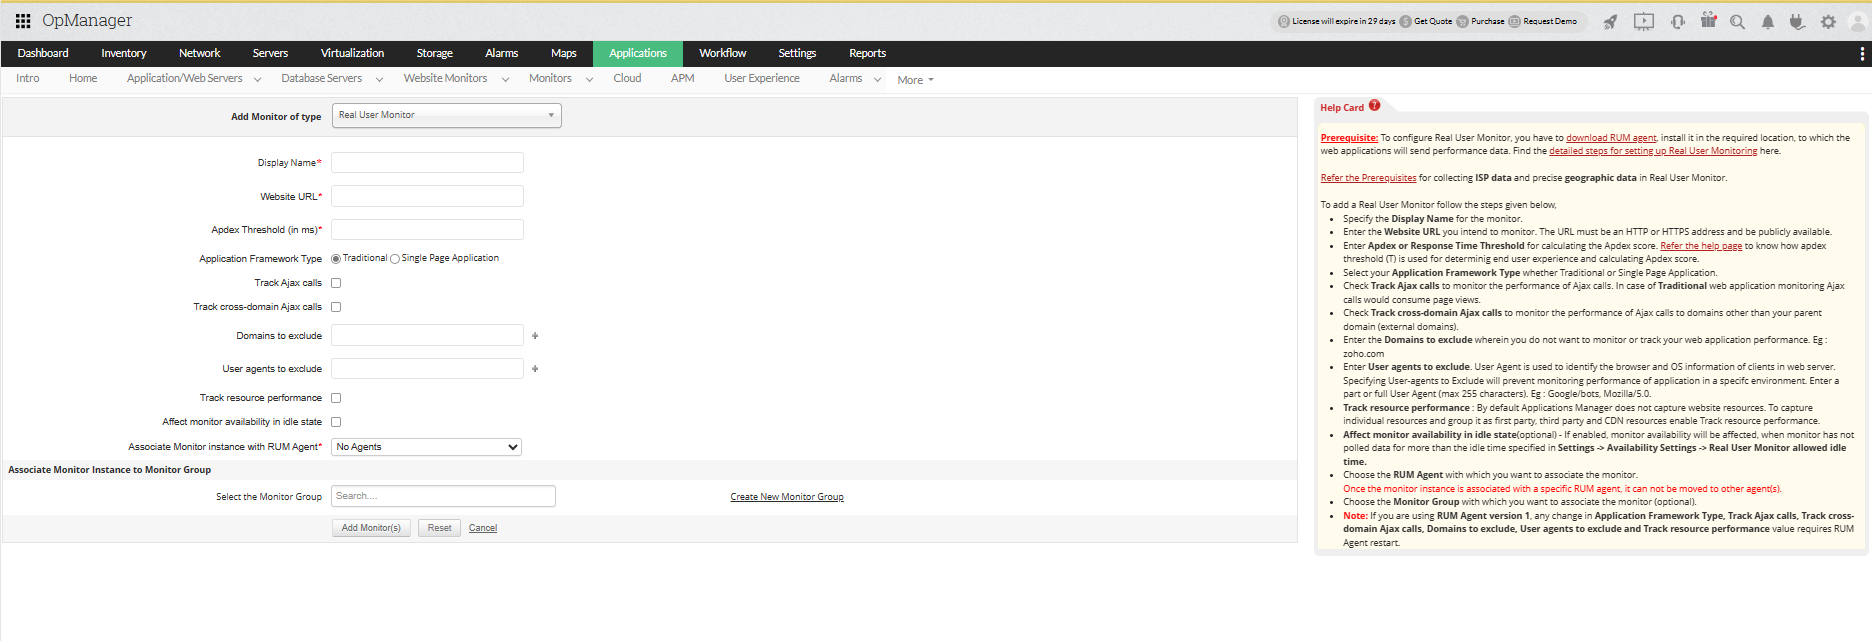
To enable Real user monitoring, download the RUM agent, complete the prerequisites, and then add the monitor. You can find the configuration details here.
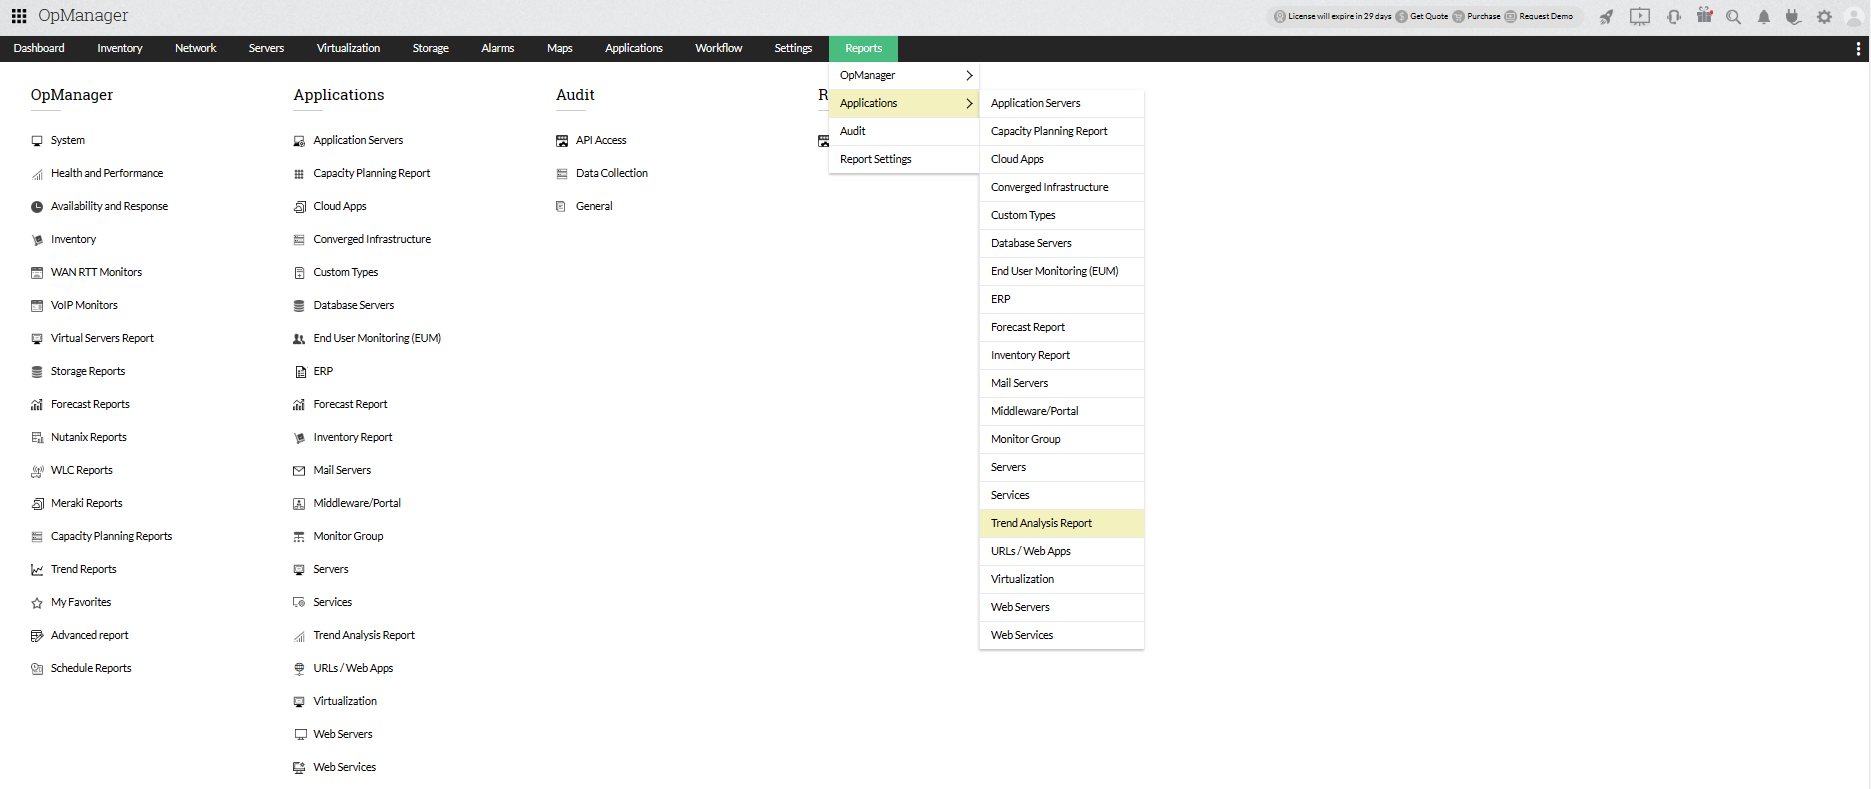
To access Applications Manager reports directly from OpManager console, go to Reports -> Applications and select the report of your choice.
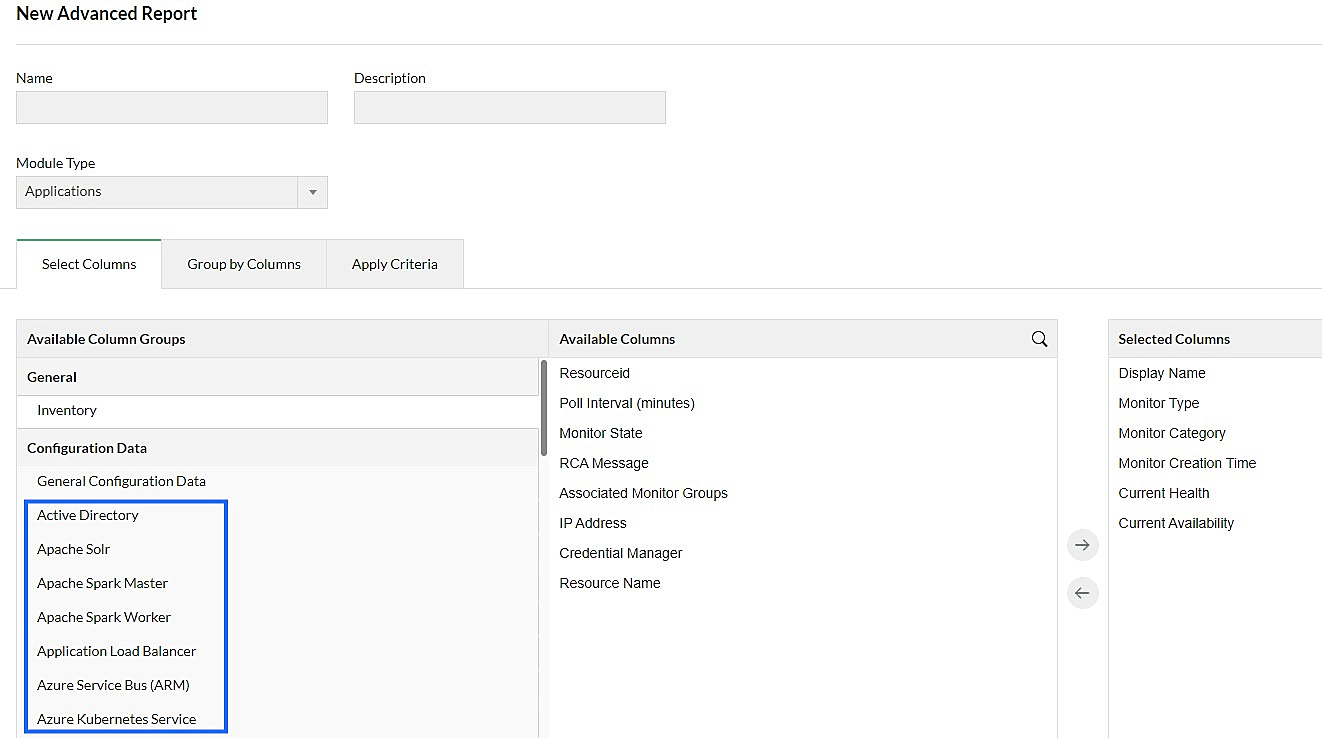
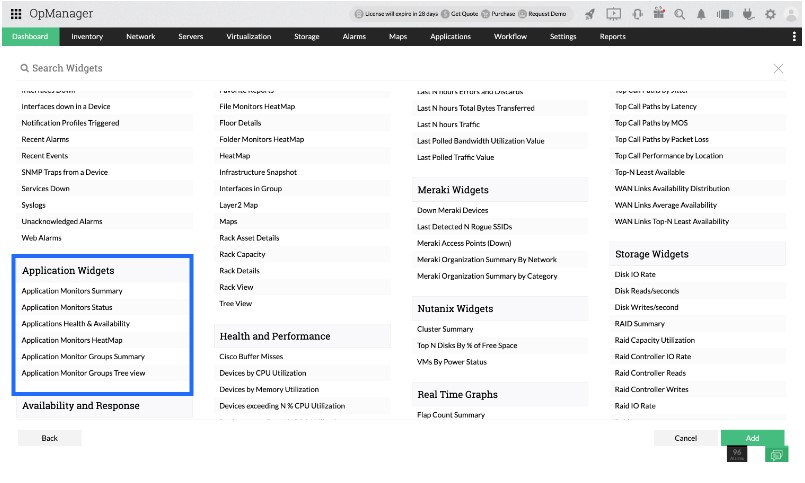
Visualize application performance within the OpManager dashboard by adding Application Widgets available in the Add Widgets page.
