-
Network monitoring dashboards
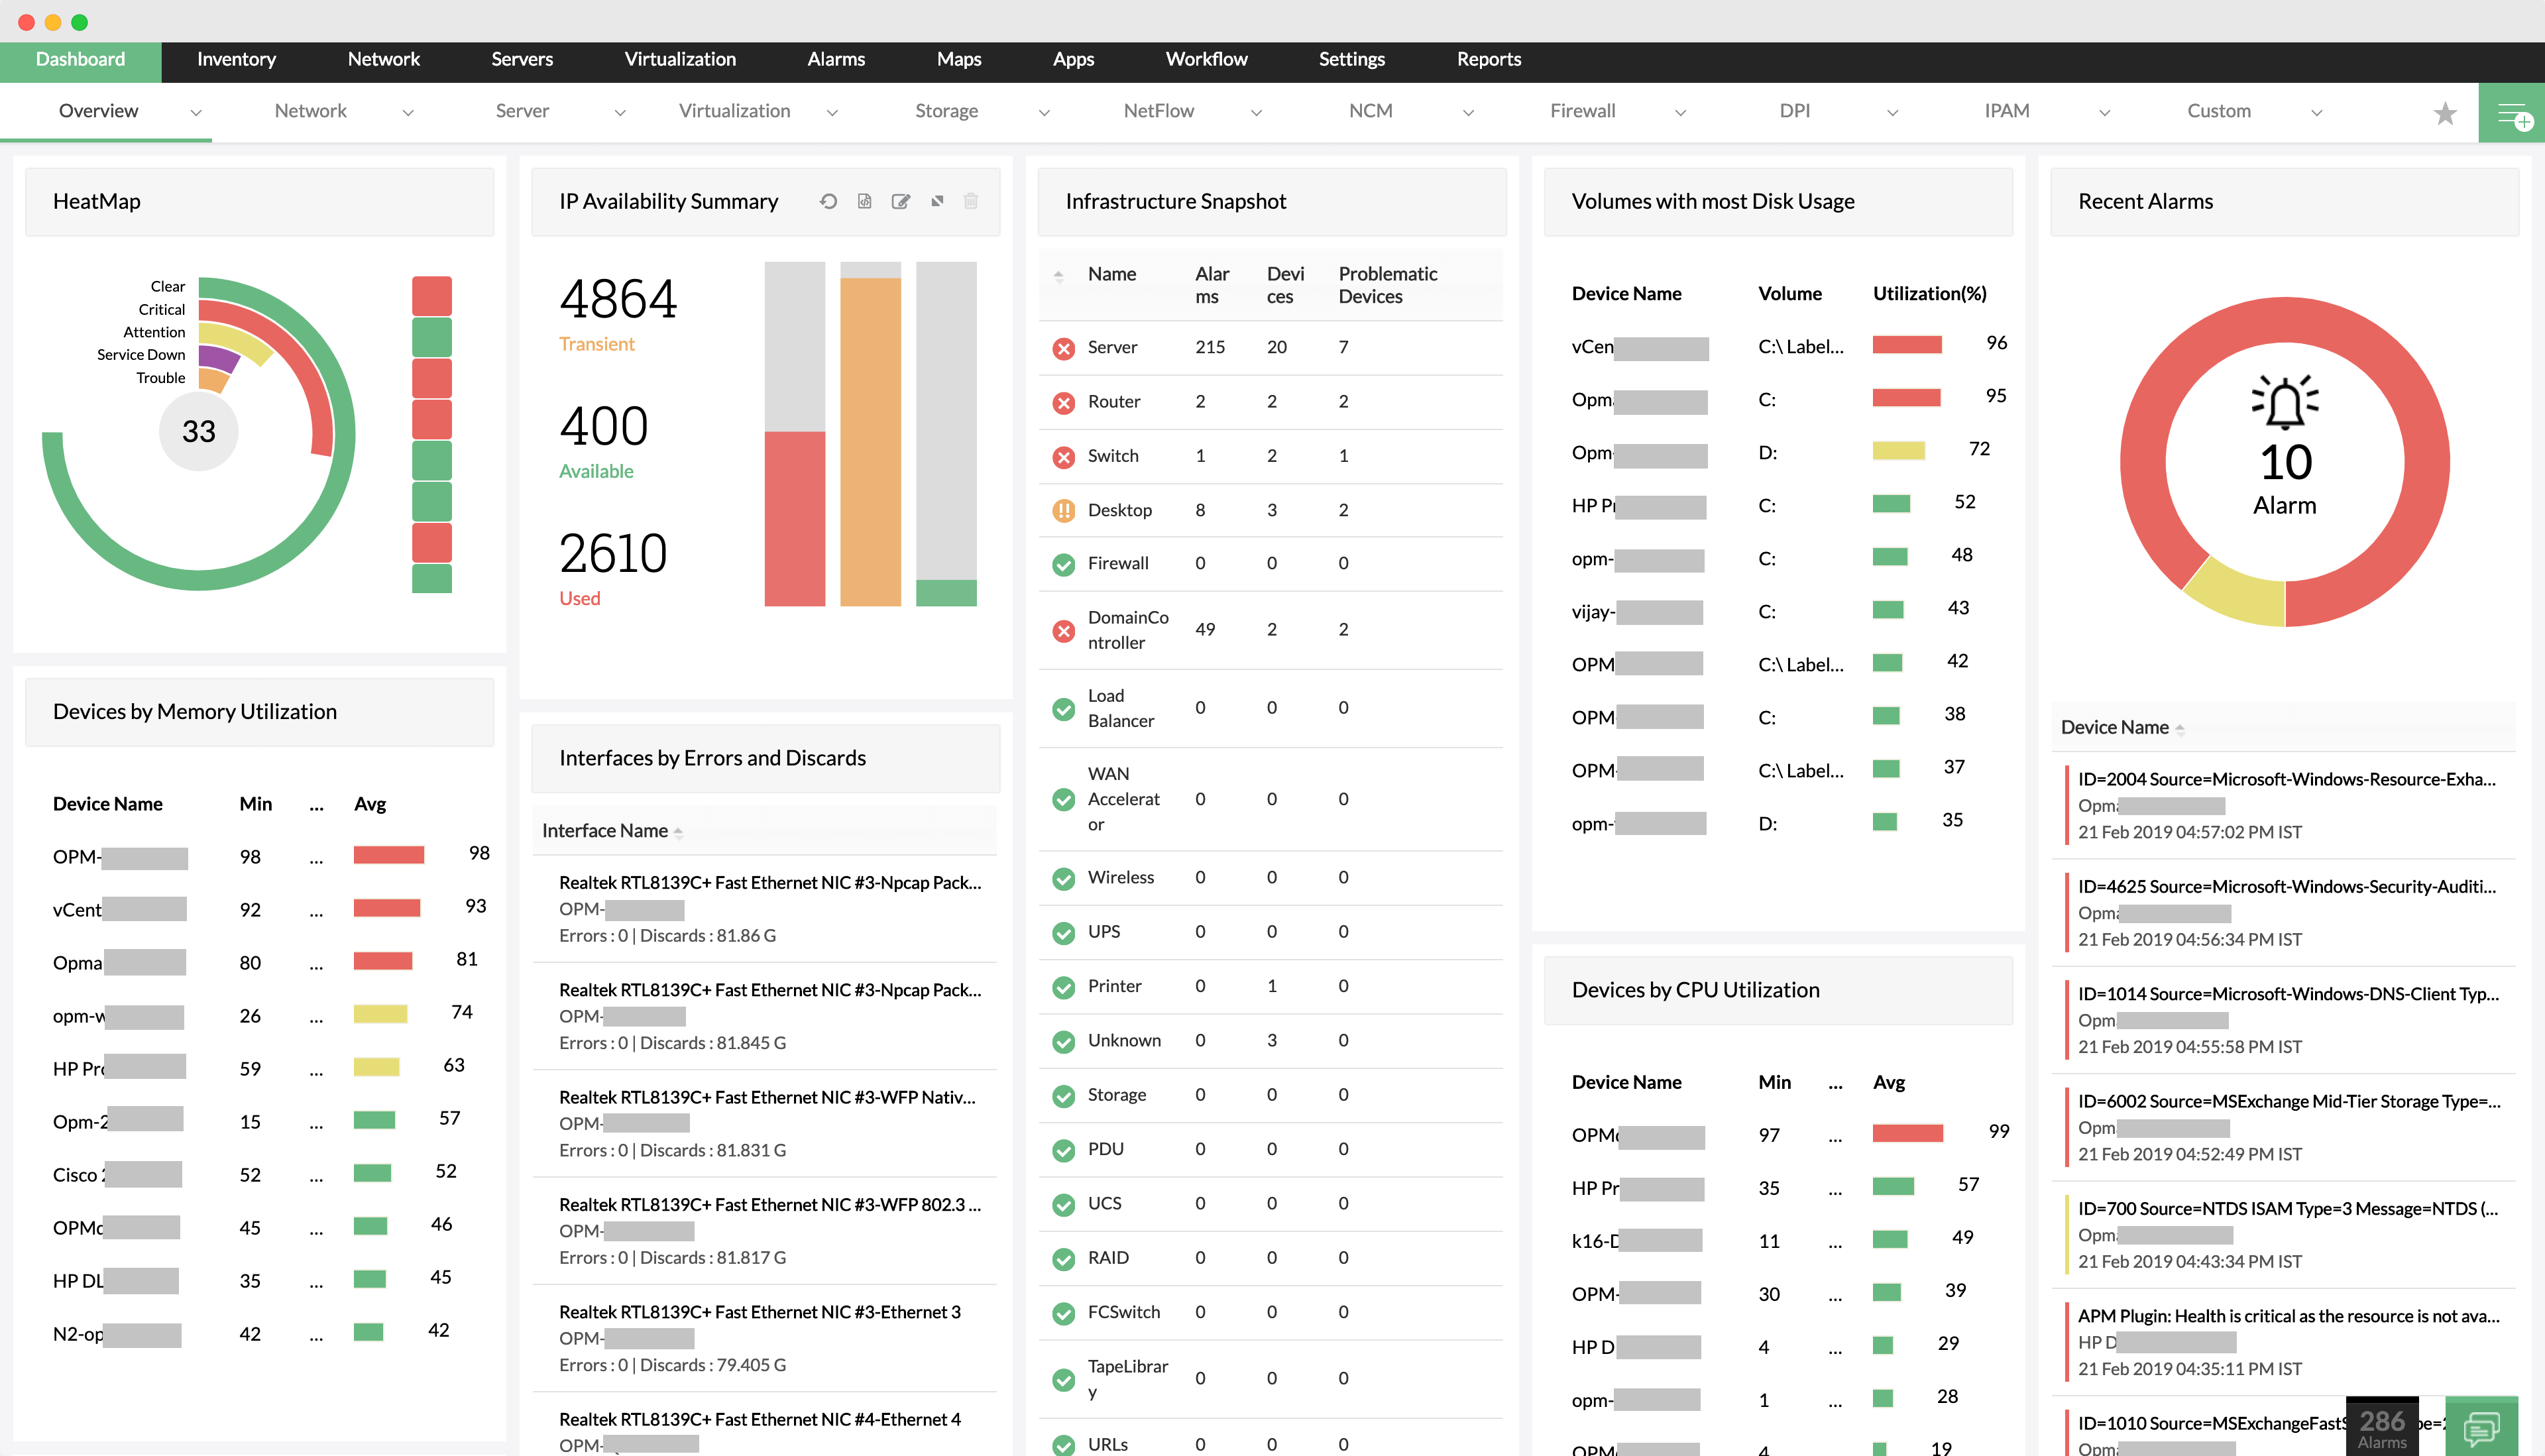
As soon as you login, OpManager's customizable dashboard gives you an immediate snapshot of your complete network health and devices that need your attention. Over 100 widgets provide you the real flexibility and insights you need to manage your network.
-
Network discovery

Add devices that you wish to monitor quickly using OpManager's automatic network discovery.
-
Interface Monitoring Templates
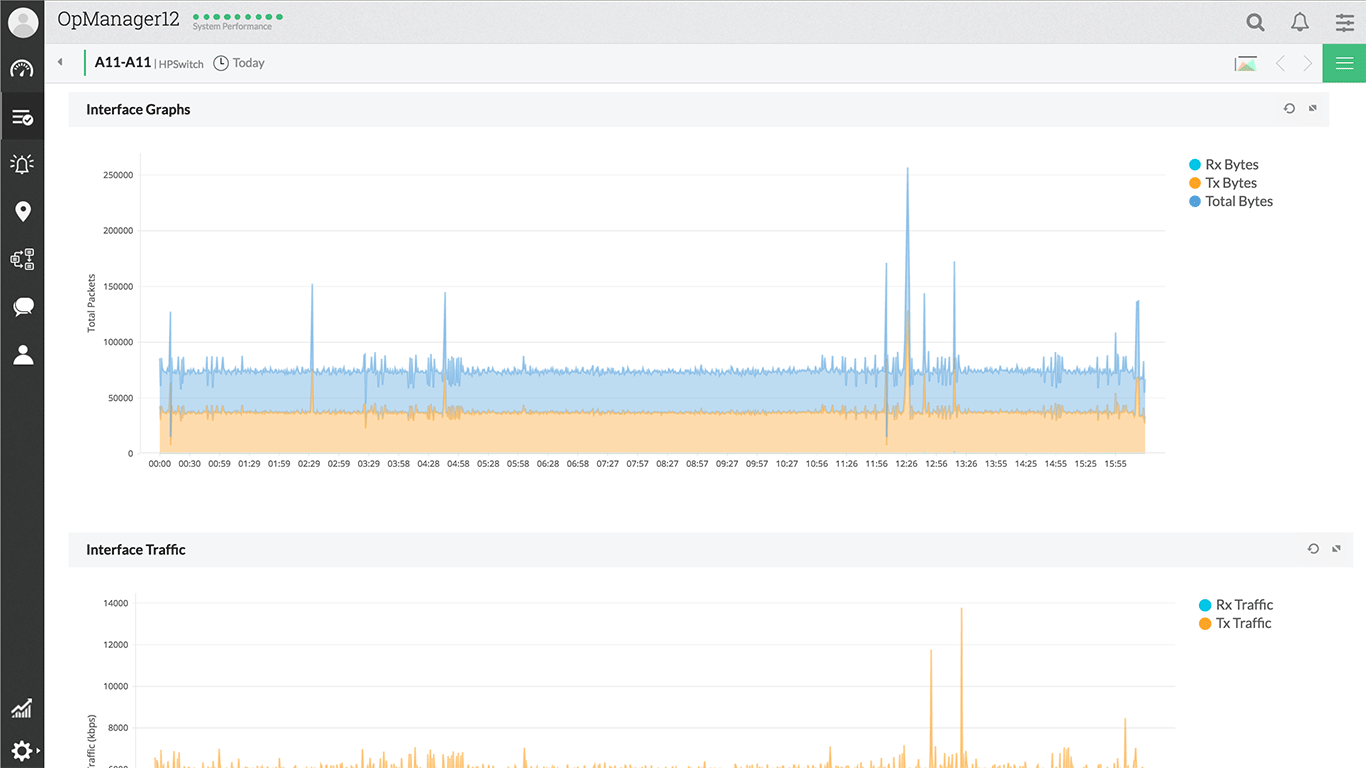
Similar to device templates, here is a list of supported interface types with pre-defined threshold points. Both device and interface templates can be used to apply your monitoring policies across similar device types.
-
Automatic Network Mapping
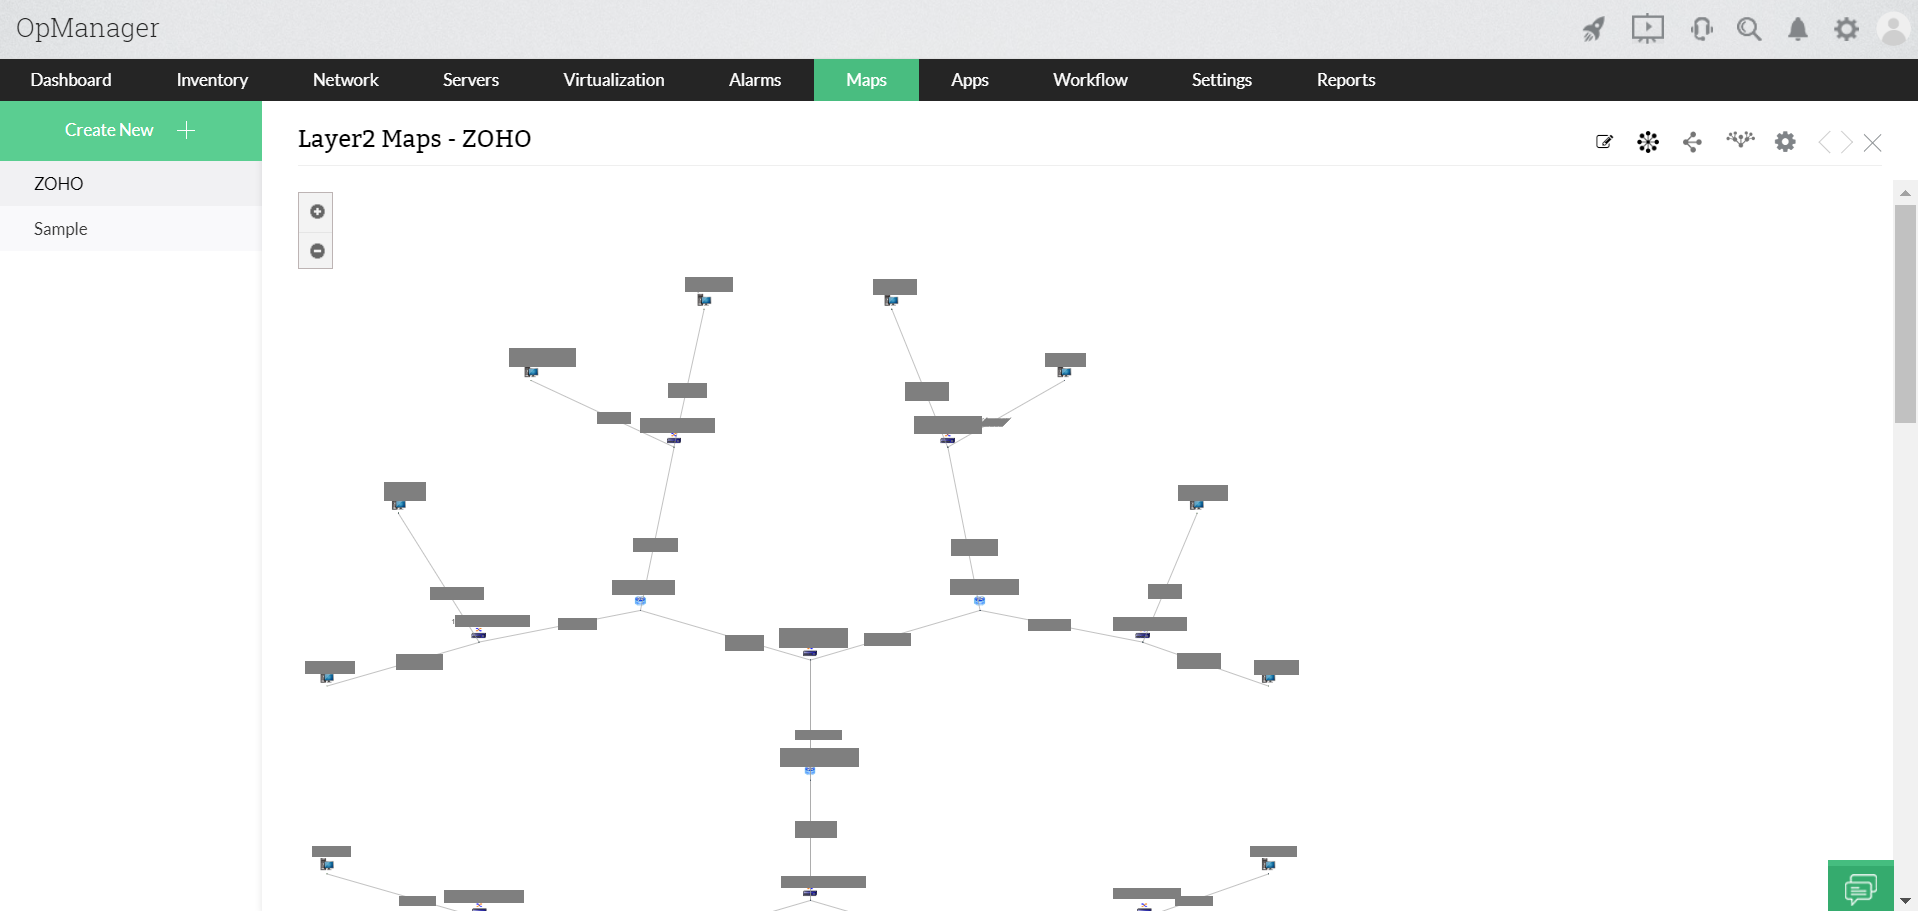
Spot the network performance bottlenecks quickly with automatic Layer 2 and Layer 3 network mapping from the seed device to an end node.
-
Custom maps
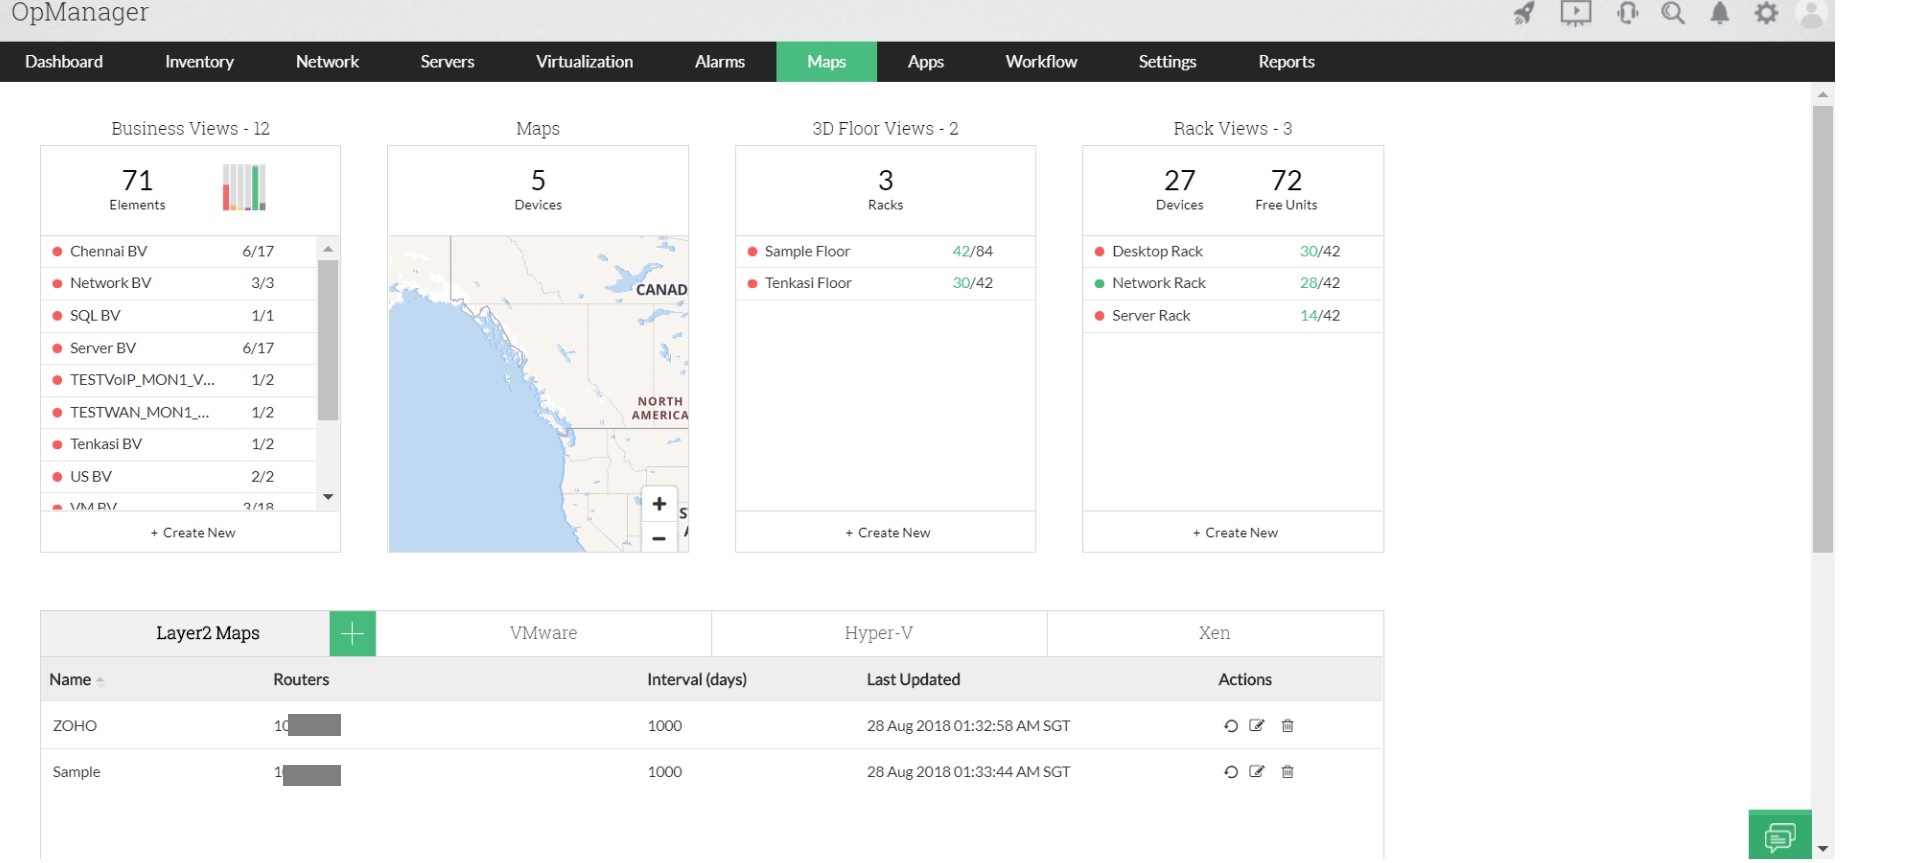
Create your own custom maps. Group devices as you want it to be with the desired background image viz., logical grouping, geographical grouping, a rack view or even a business service view.
-
Google map
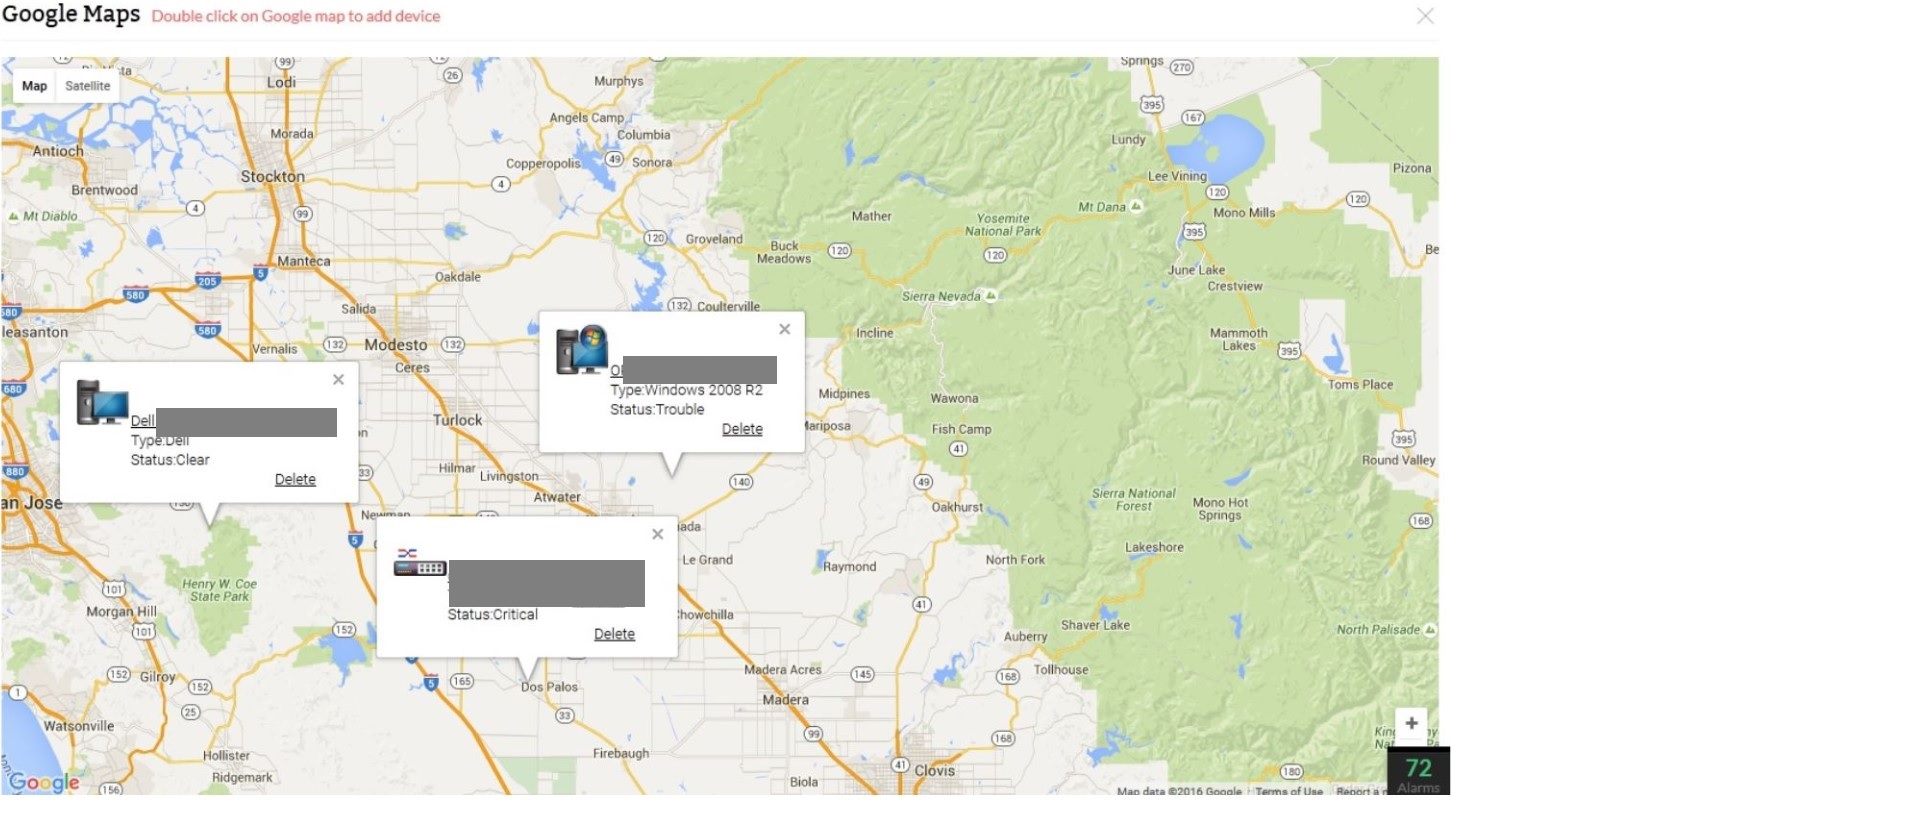
Leverage Google Map's API to get a bird's eye-view of your complete enterprise network with each node’s current health status.
-
Quick configuration
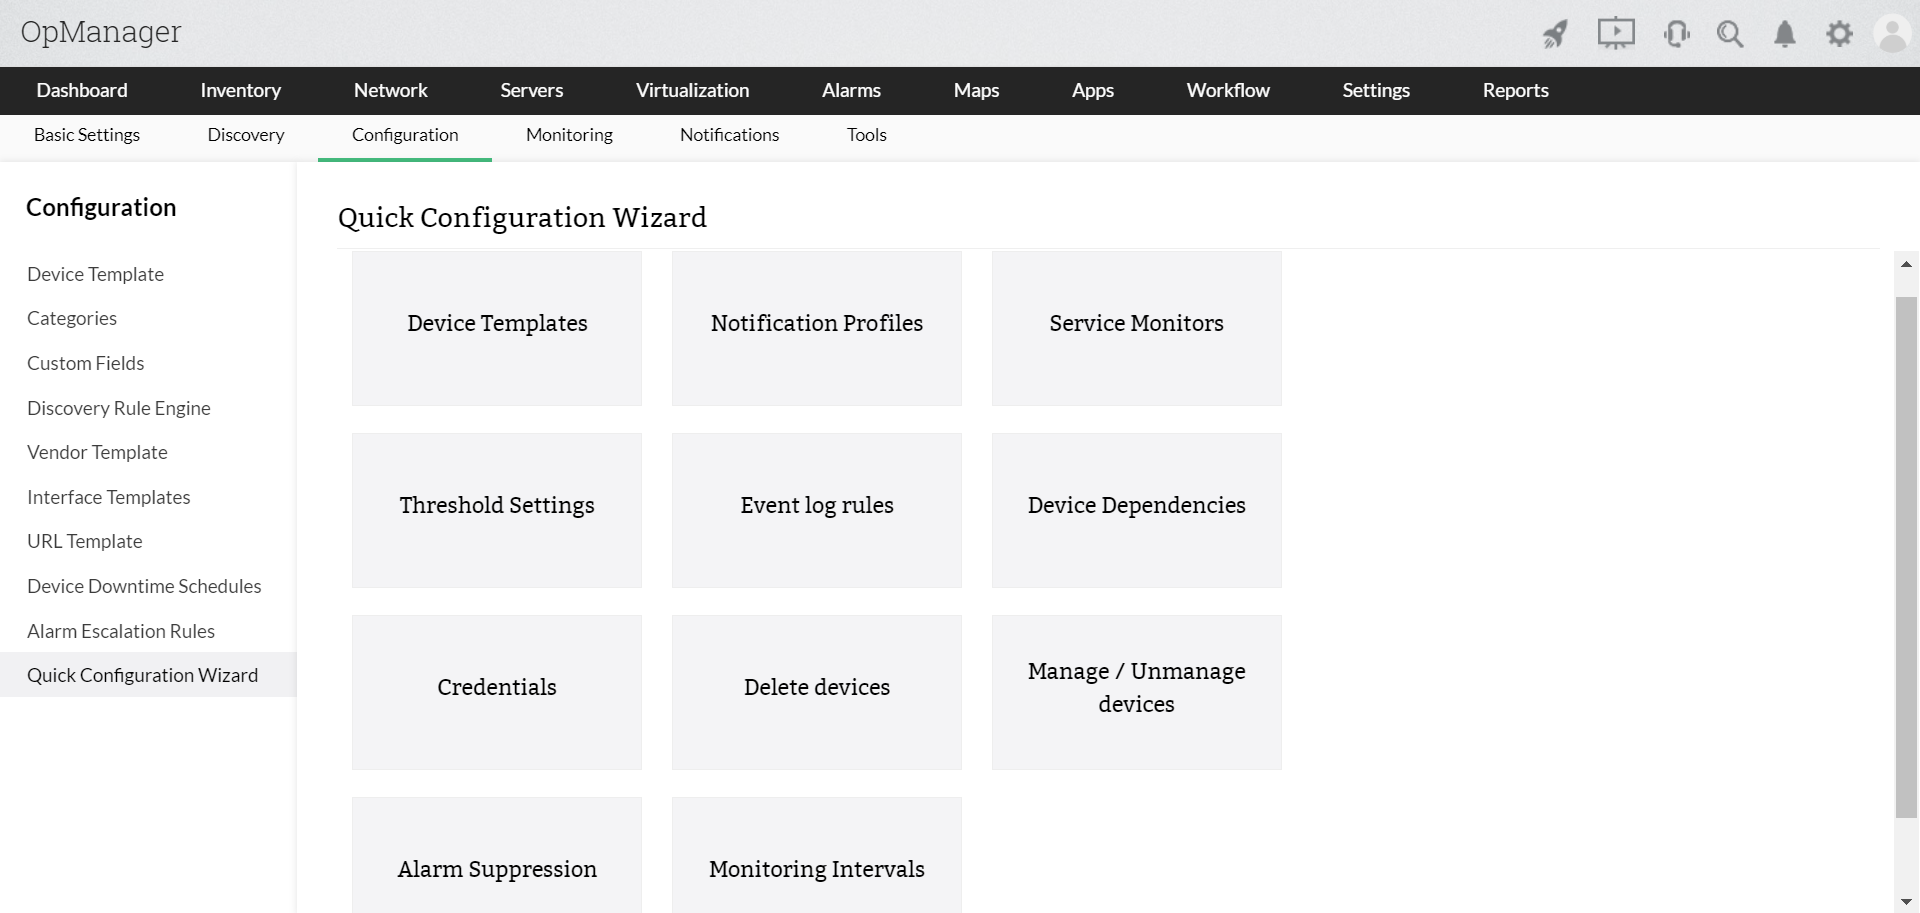
Apply your organization's monitoring policies across multiple devices at once using quick configuration tools.
-
Router Infrastructure view
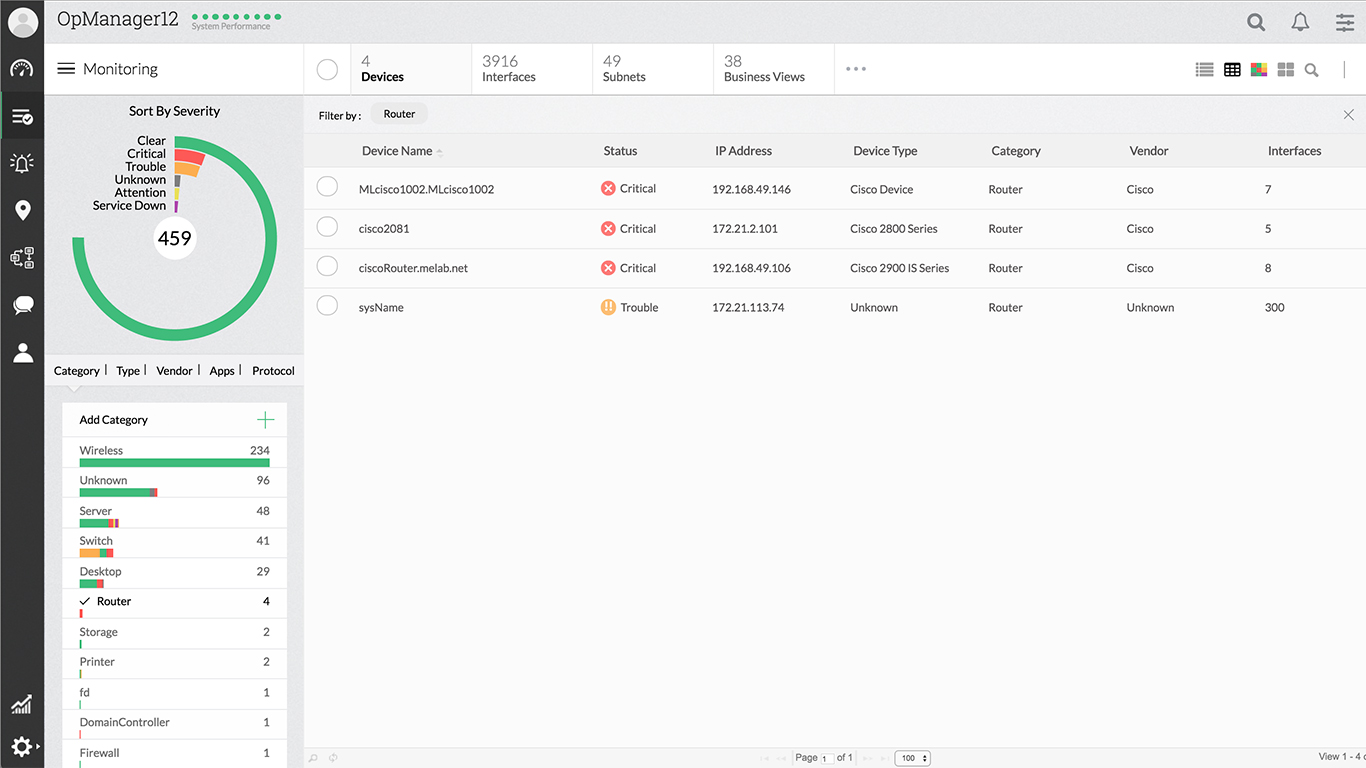
Get a quick snapshot view of the routers and interfaces health with links to drill down to the device or interface.
-
Interface performance monitoring

Monitor network traffic and link performance with easy-to-comprehend reports for every network interface/ port in your network. Displays availability, traffic, bandwidth utilization, errors, discards, total bytes received and transferred packets per second.
-
Network traffic analysis
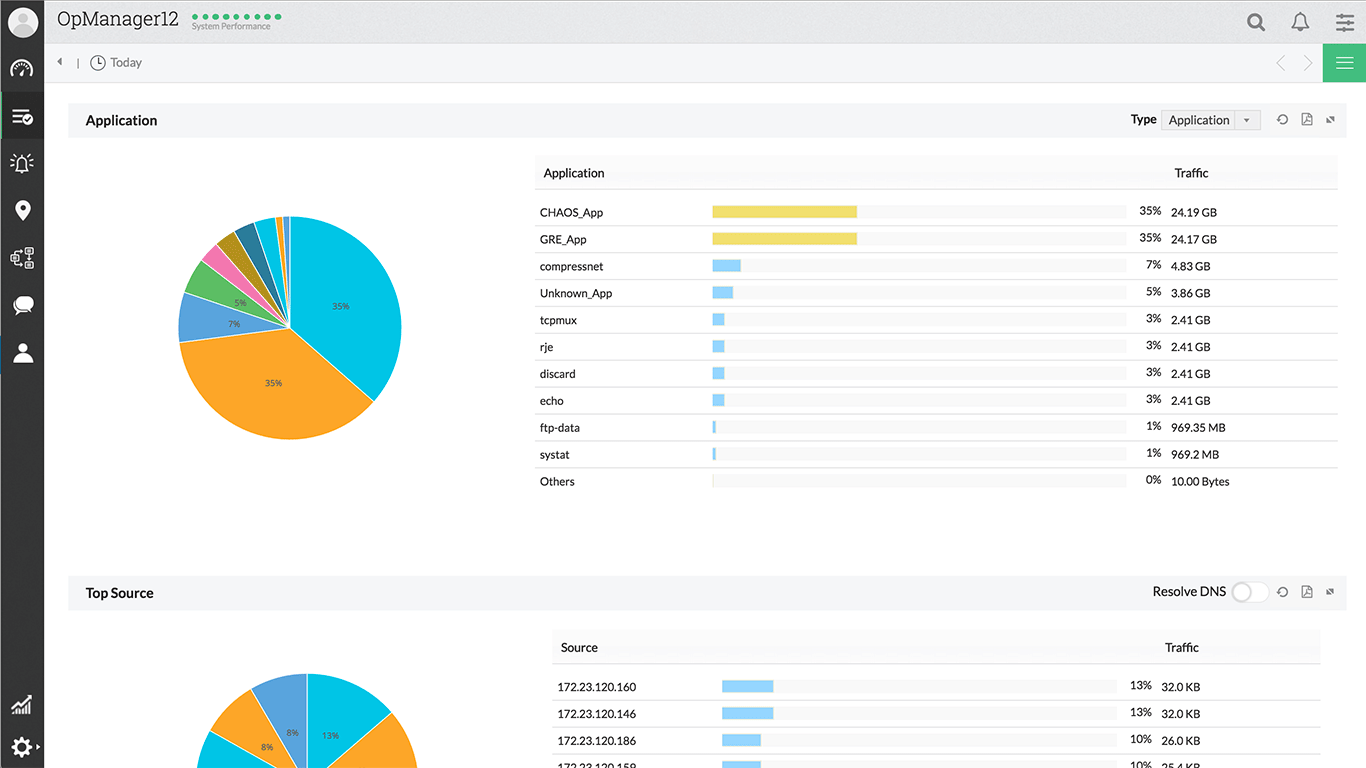
Detect who is occupying most of your bandwidth, is it your applications or some users (source and destination) with bandwidth analysis module. This module supports NetFlow, sFlow, cflowd, J-Flow, IPFIX, NetStream, NBAR and CBQoS technologies.
-
WAN RTT dashboard
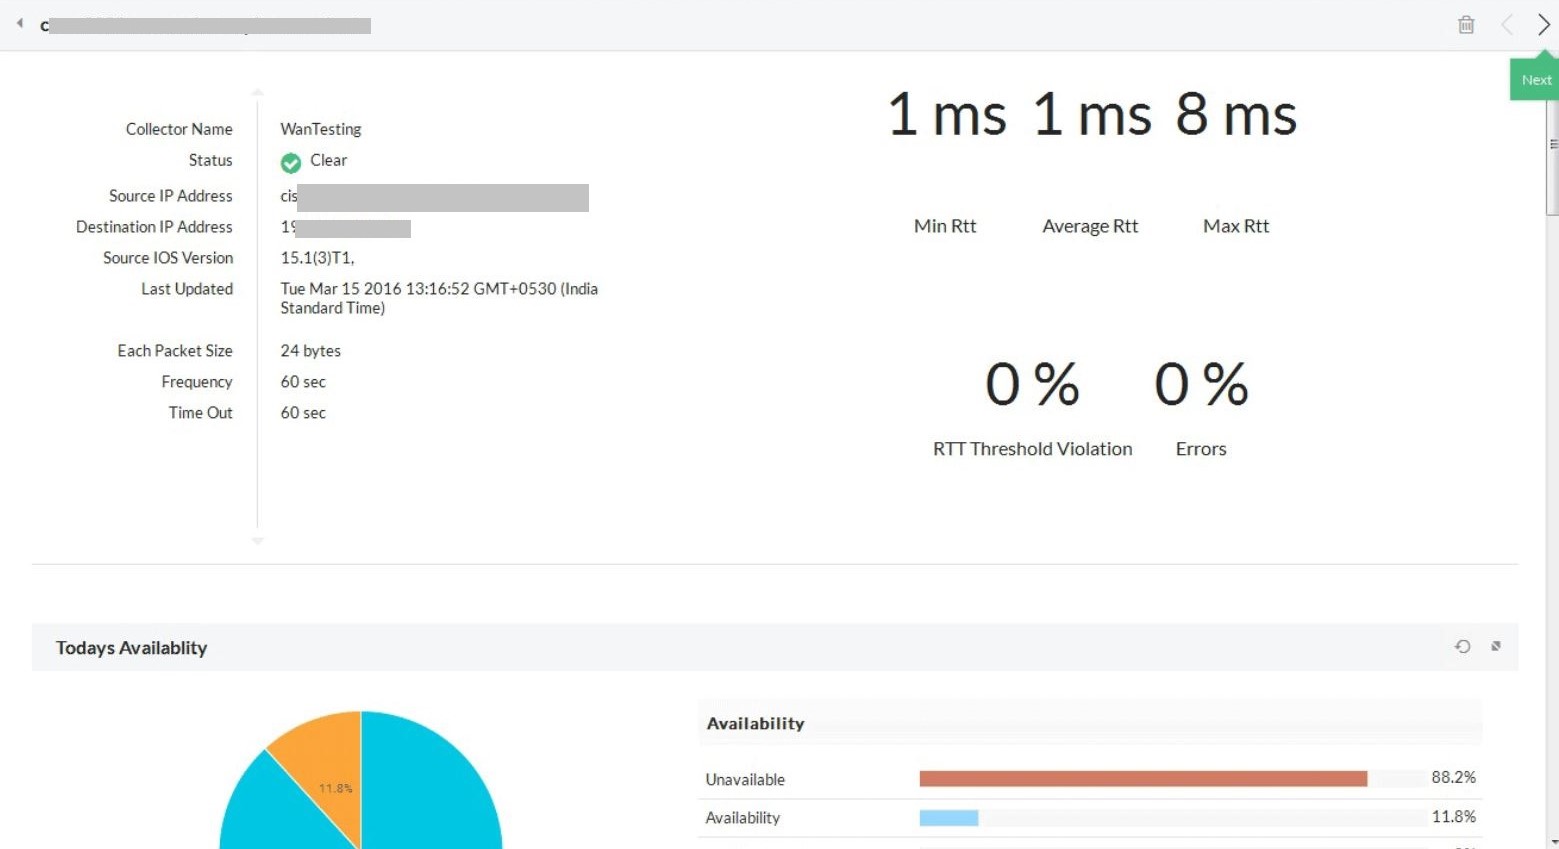
At a glimpse, understand how your key WAN links are performing over an intuitive dashboard: shows availability, WAN link latency and bandwidth information.
-
WAN Graph
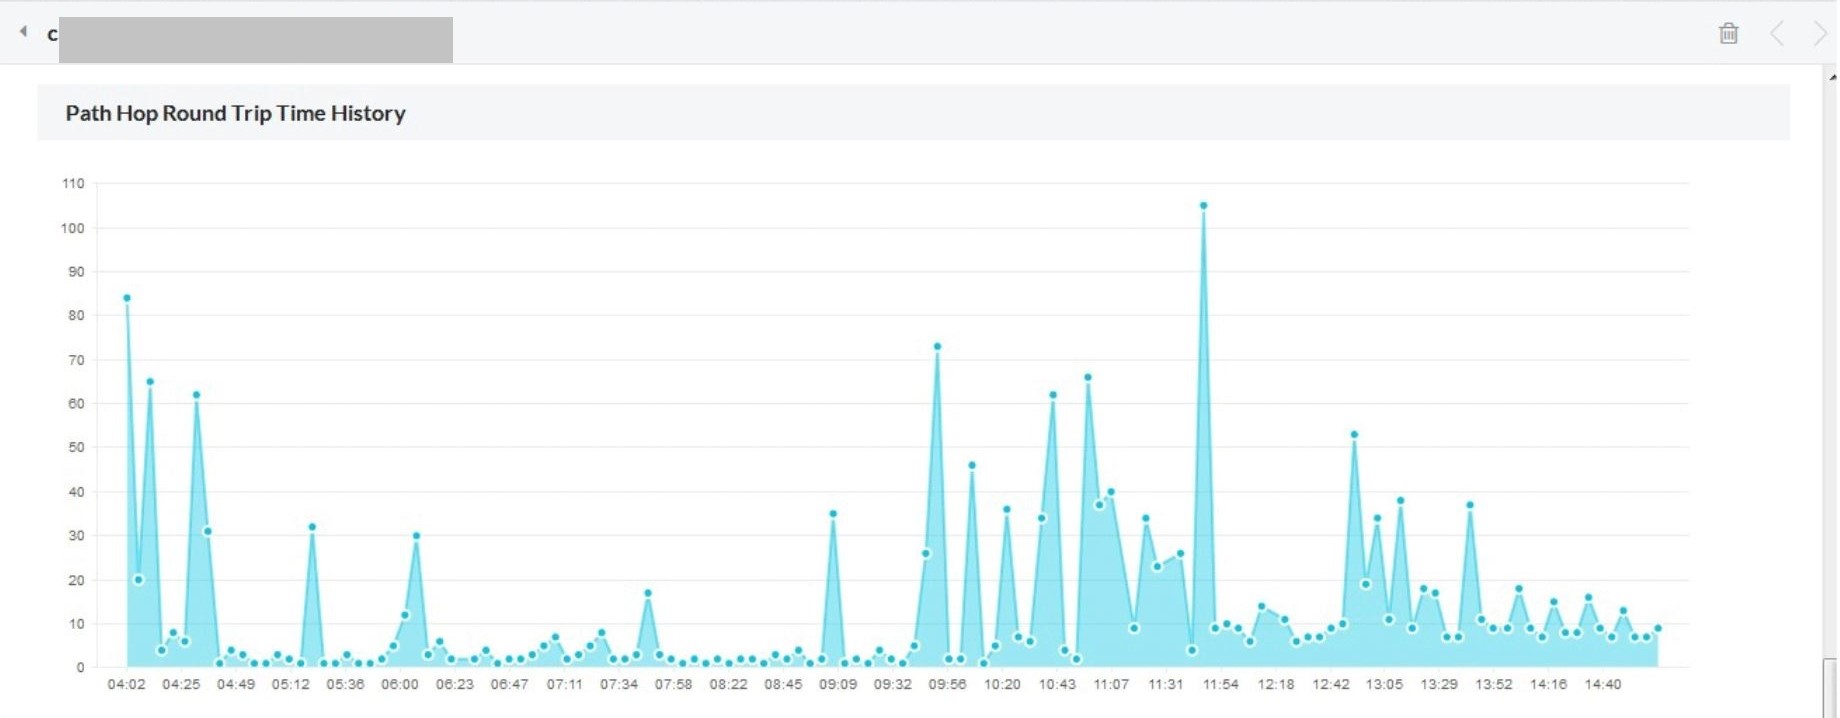
Find the root cause for WAN link delays in a flick with OpManager's WAN hop-graph; Lets you know whether the latency is induced at your ISP's infrastructure or within your manageable network boundaries.
-
Voip dashboard
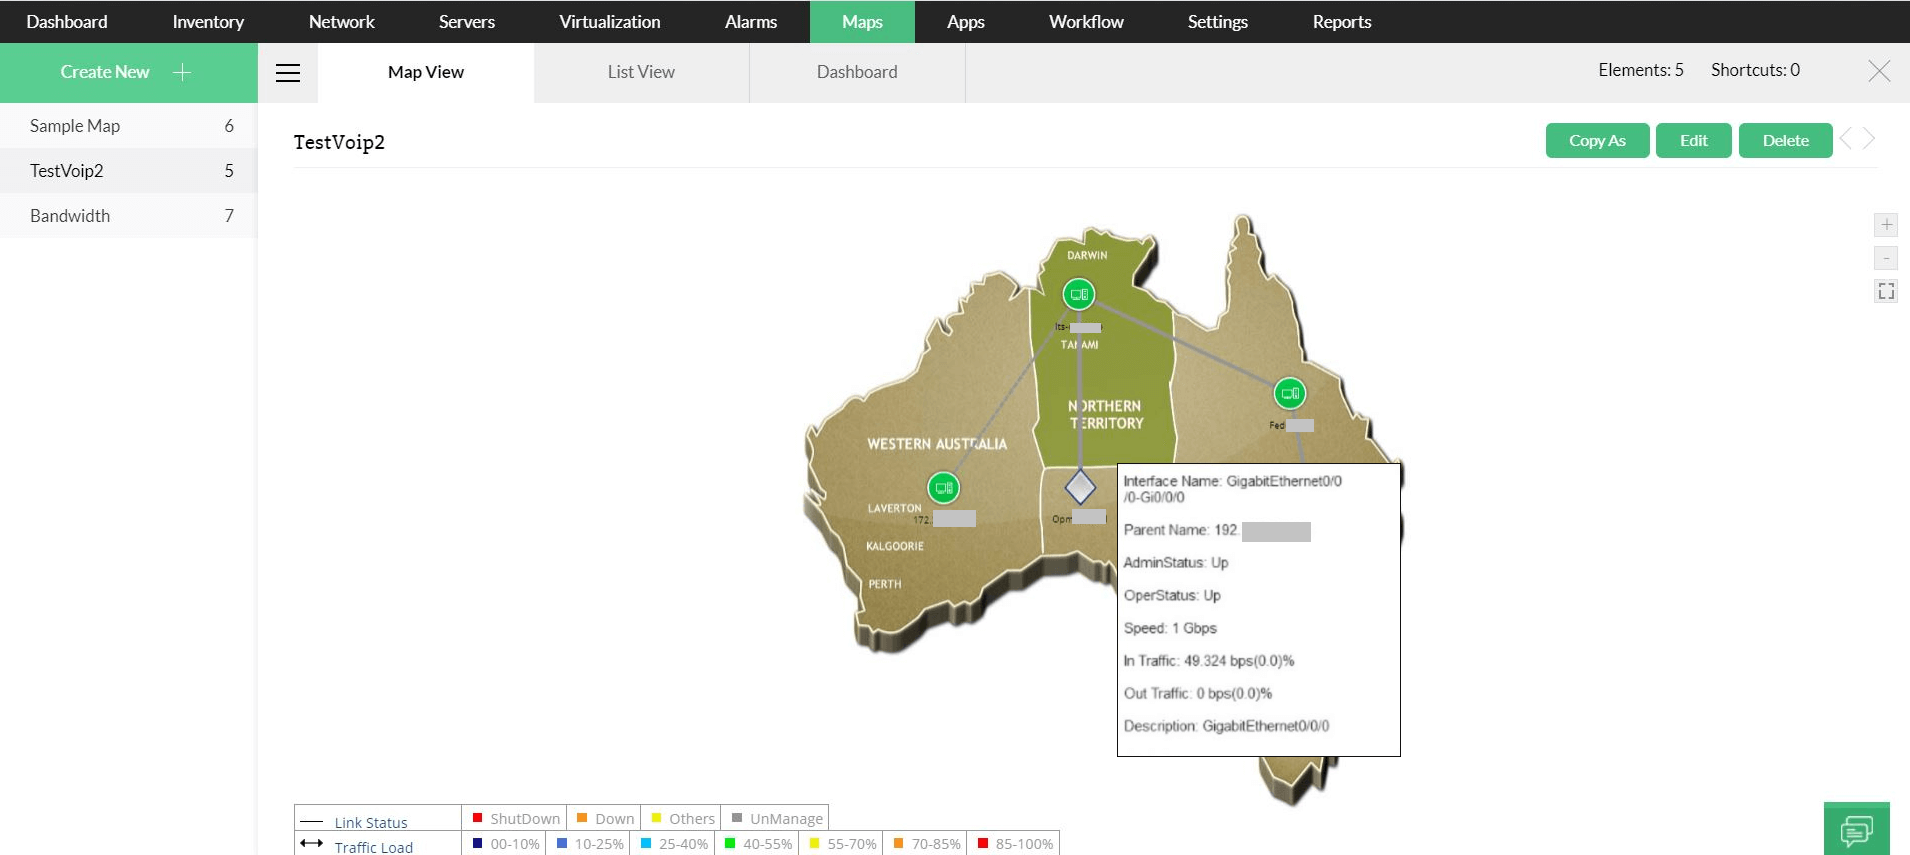
Monitor your VoIP link proactively by leveraging Cisco IP SLA; presents the top call paths, MOS, Jitter, packet loss and latency.
-
Network configuration management
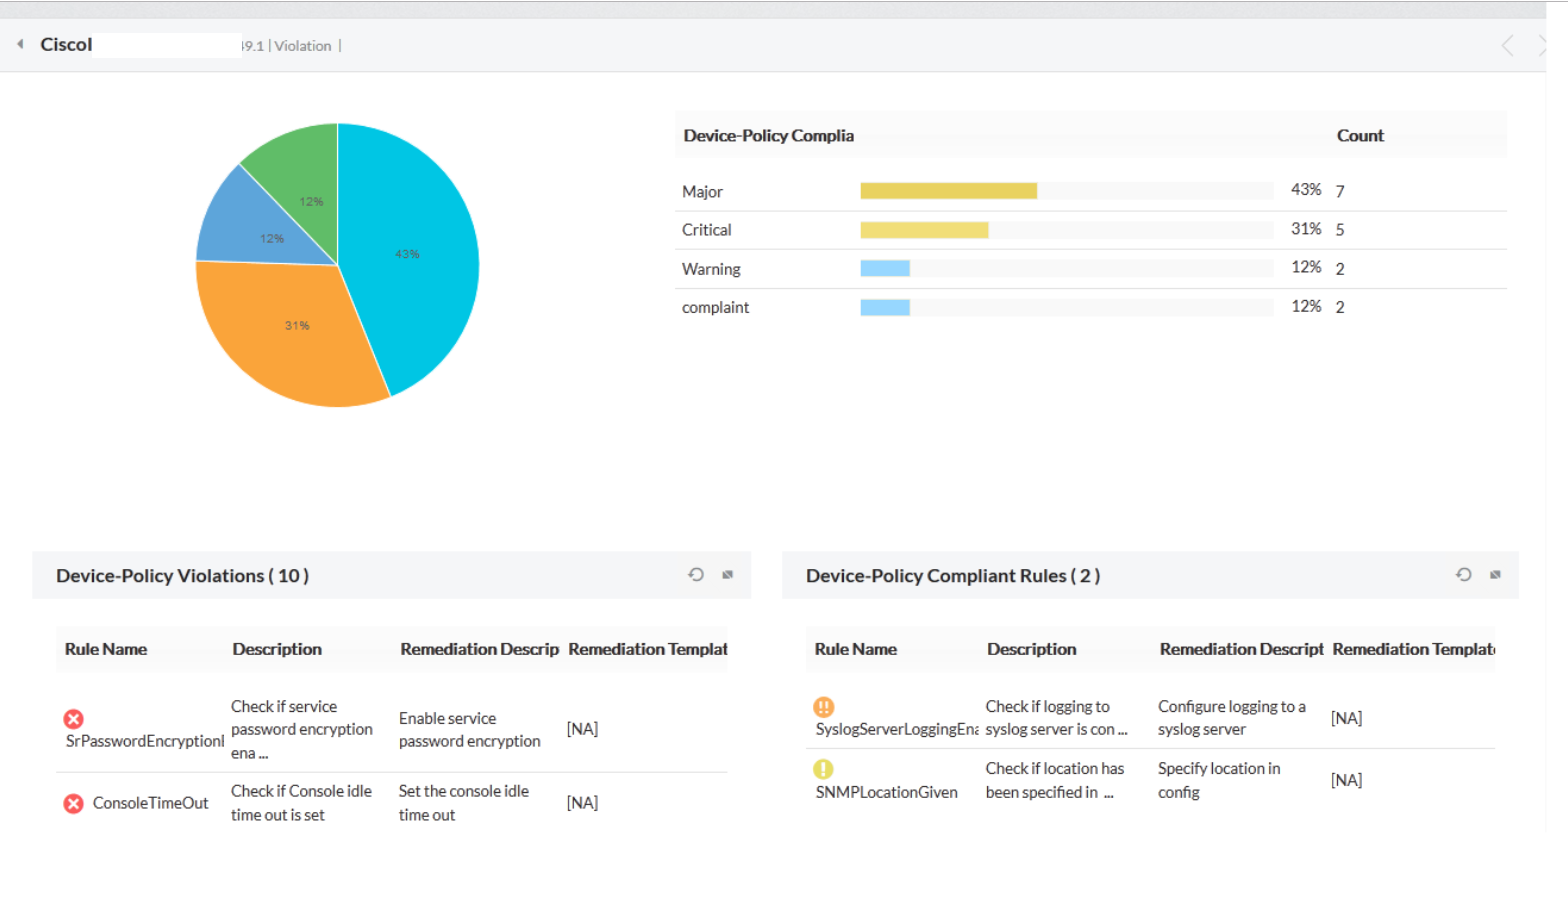
Effect automatic network configuration backup and versioning along side configuration comparison for your network devices and roll back to trusted version in a click with Network configuration management module.
-
Sever monitoring
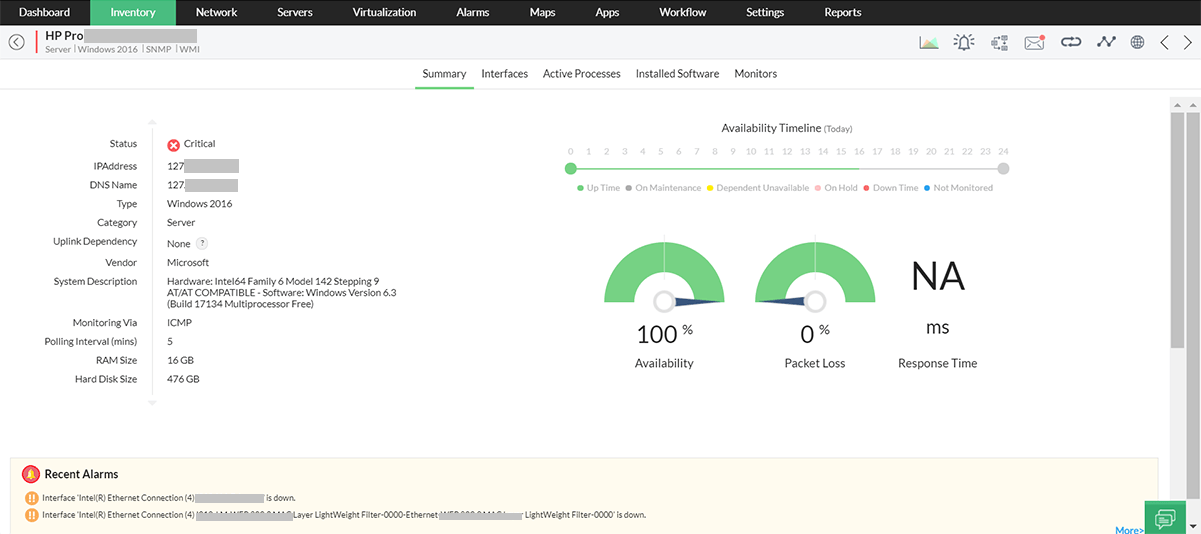
Assess how your servers are performing in terms of their availability, resource utilization (CPU, Memory and Disk) and traffic. In case of a problem, troubleshoot using network monitoring tools such as ping, trace route, web and RDP session. OpManager supports monitoring Windows, Linux, Solaris HP UX, IBM AIX and other UNIX-based OSes out-of-the-box.
-
Vmware
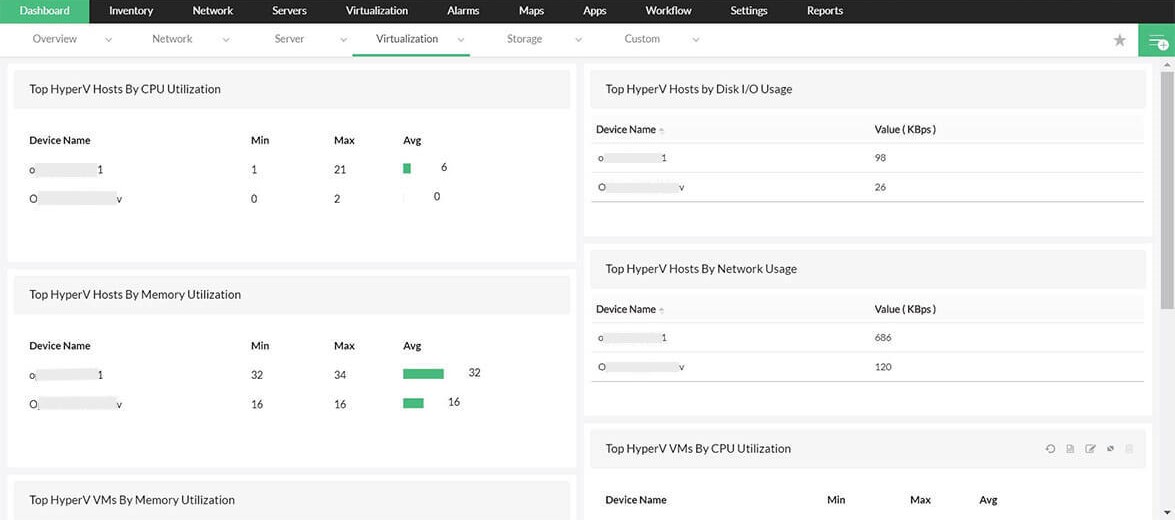
Monitor your virtualized infrastructure by leveraging VMware's API. Here is a dashboard that shows the VMware performance statistics for each Host and Guest instance in-a-snap
-
Hyper-V
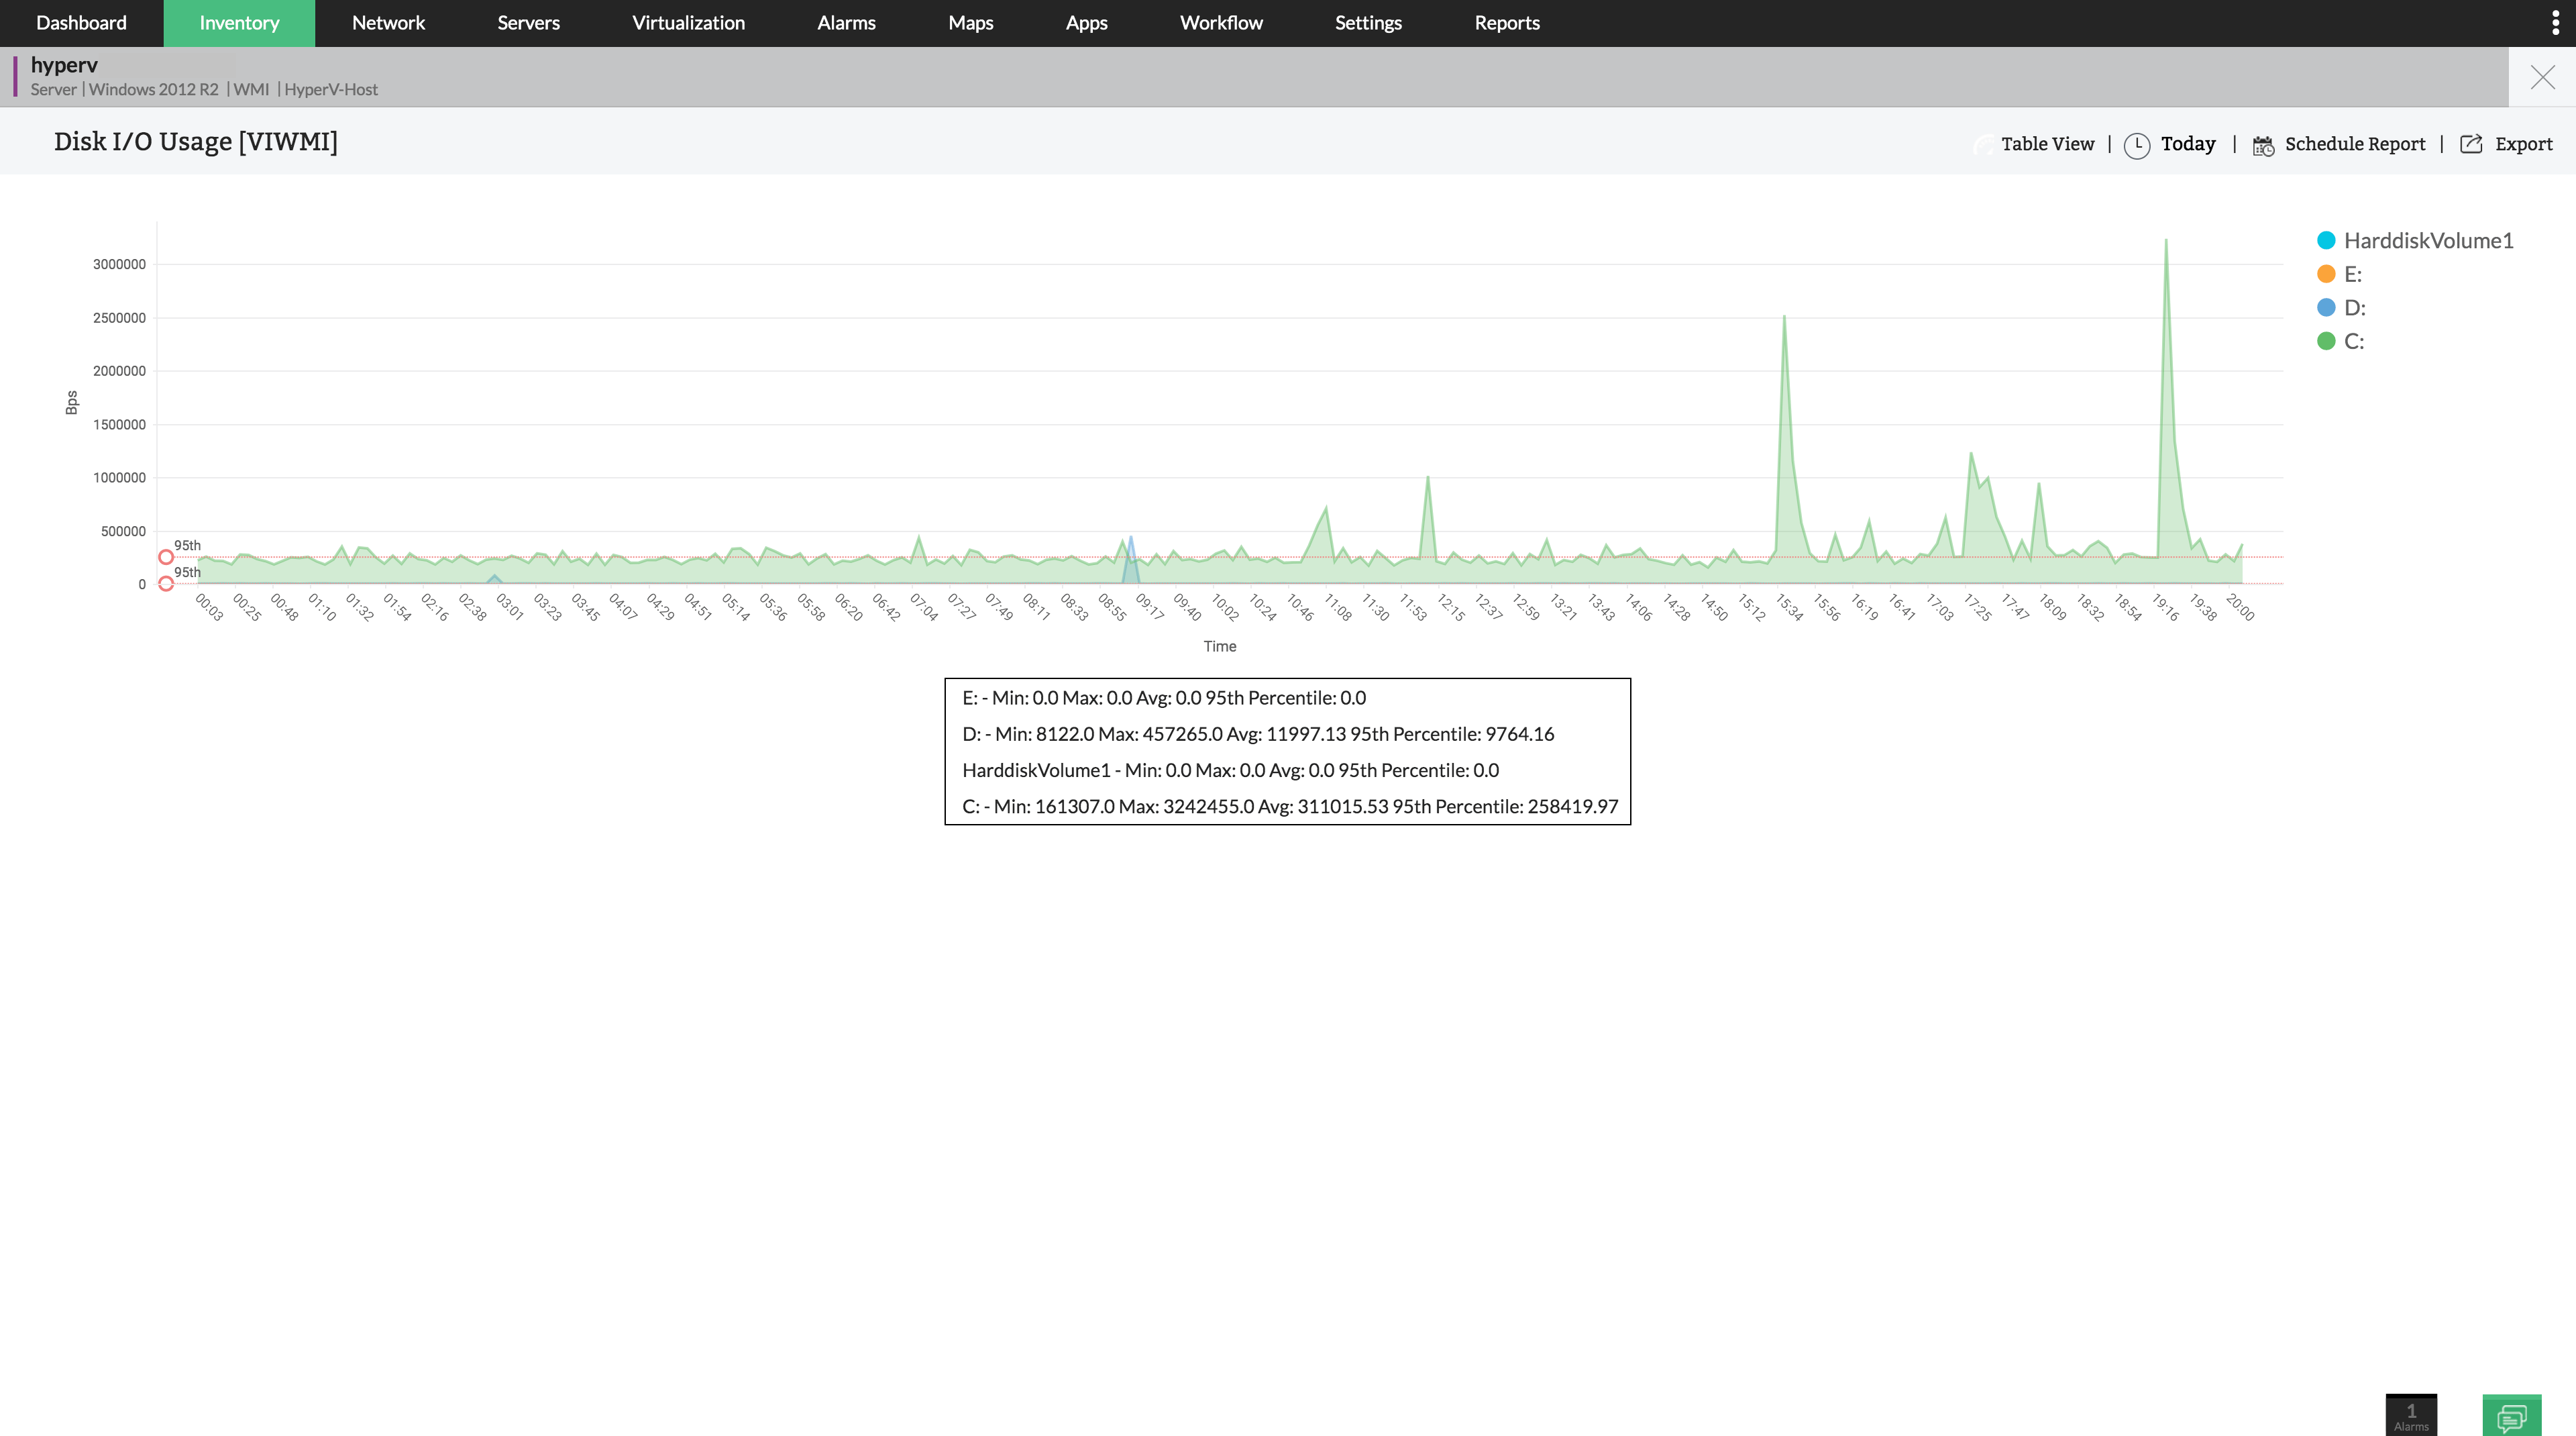
In addition to the existing VMware ESX monitoring, OpManager now supports hyper-v monitoring with over 40 deep metrics on the availability and performance of Hyper-V hosts and guests.
-
Exchange Monitoring
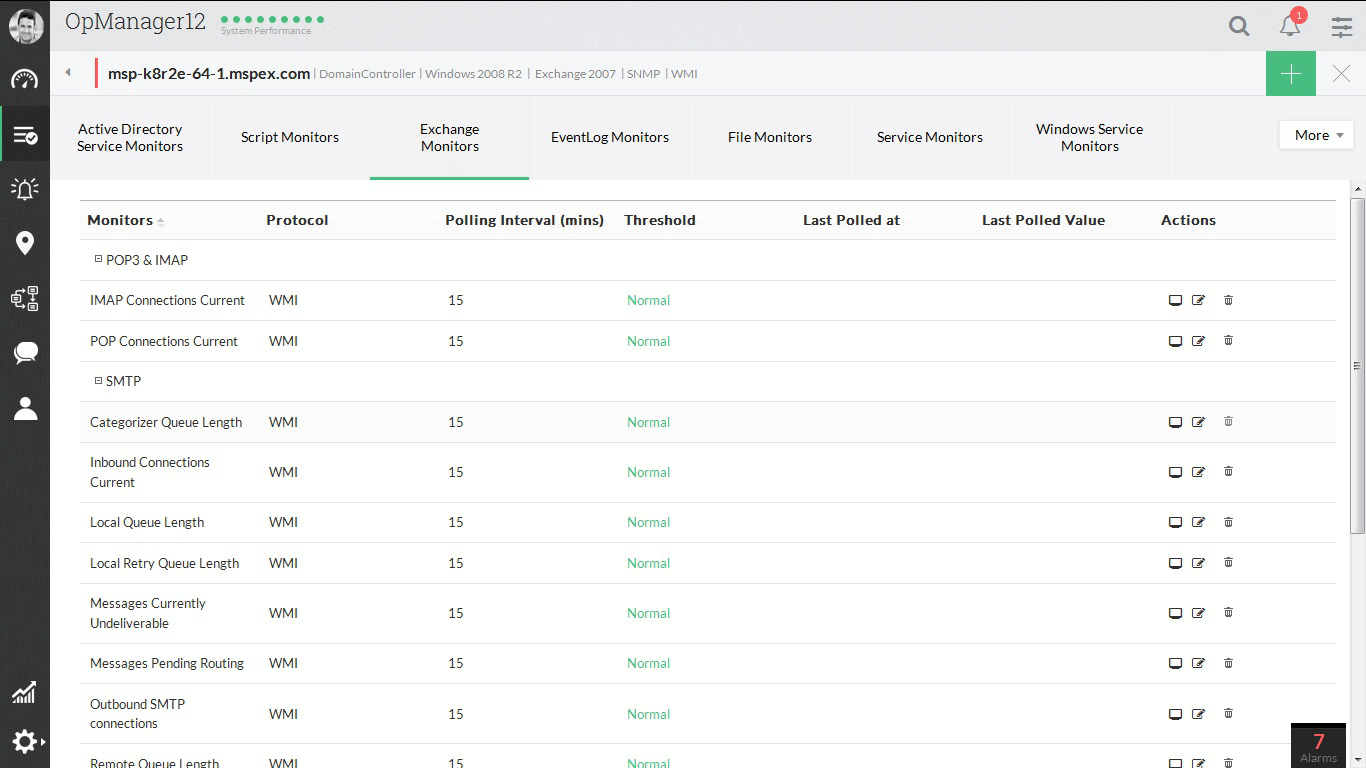
You don’t have to drill down each parameter on your exchange server to verify its performance. OpManager’s Exchange Dashboard gives you the overall insight you need in a comprehensive console; supports monitoring exchange 2000/ 2003/ 2007/ 2010.
-
Active Directory
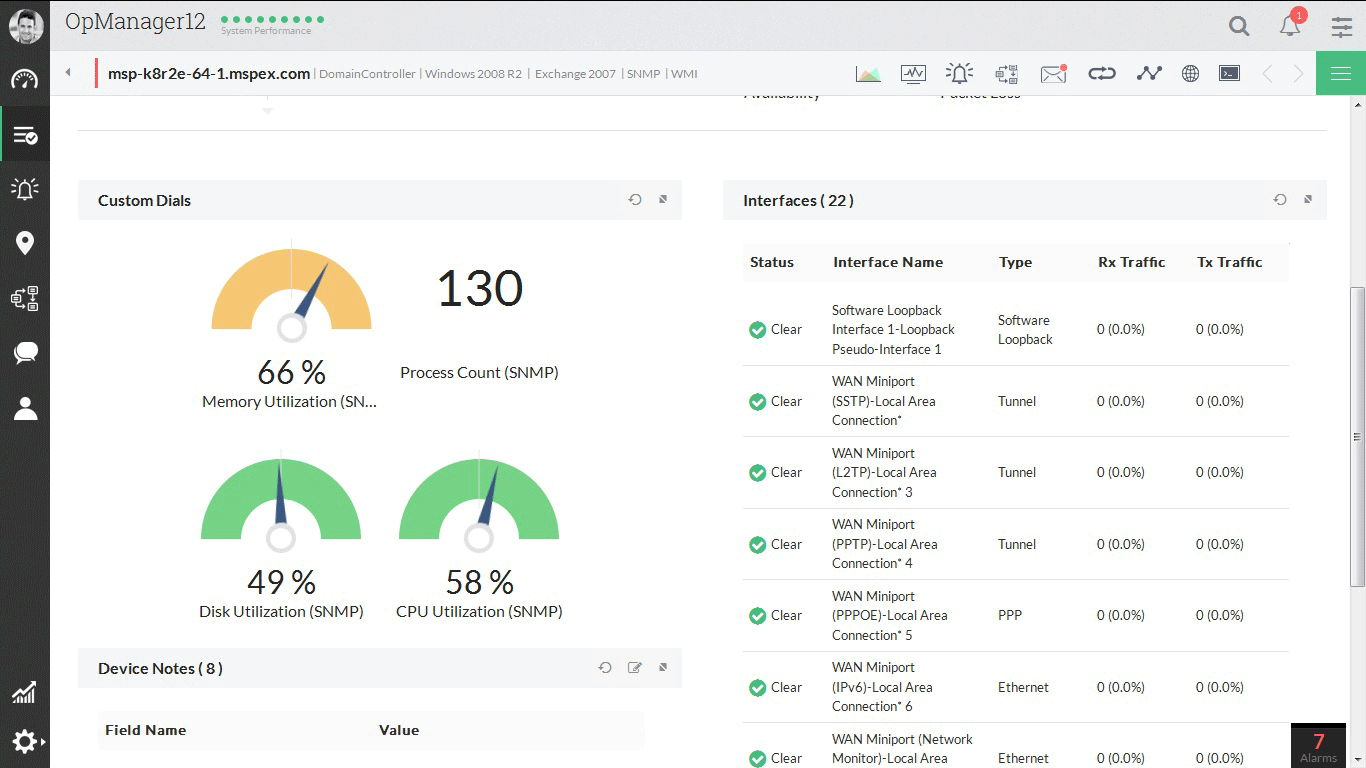
Let OpManager automatically identify the domain controller in your network and associate all the monitors with industry recommended threshold points. The dashboard shows you the quick snap of Active Directory performance.
-
MS SQL
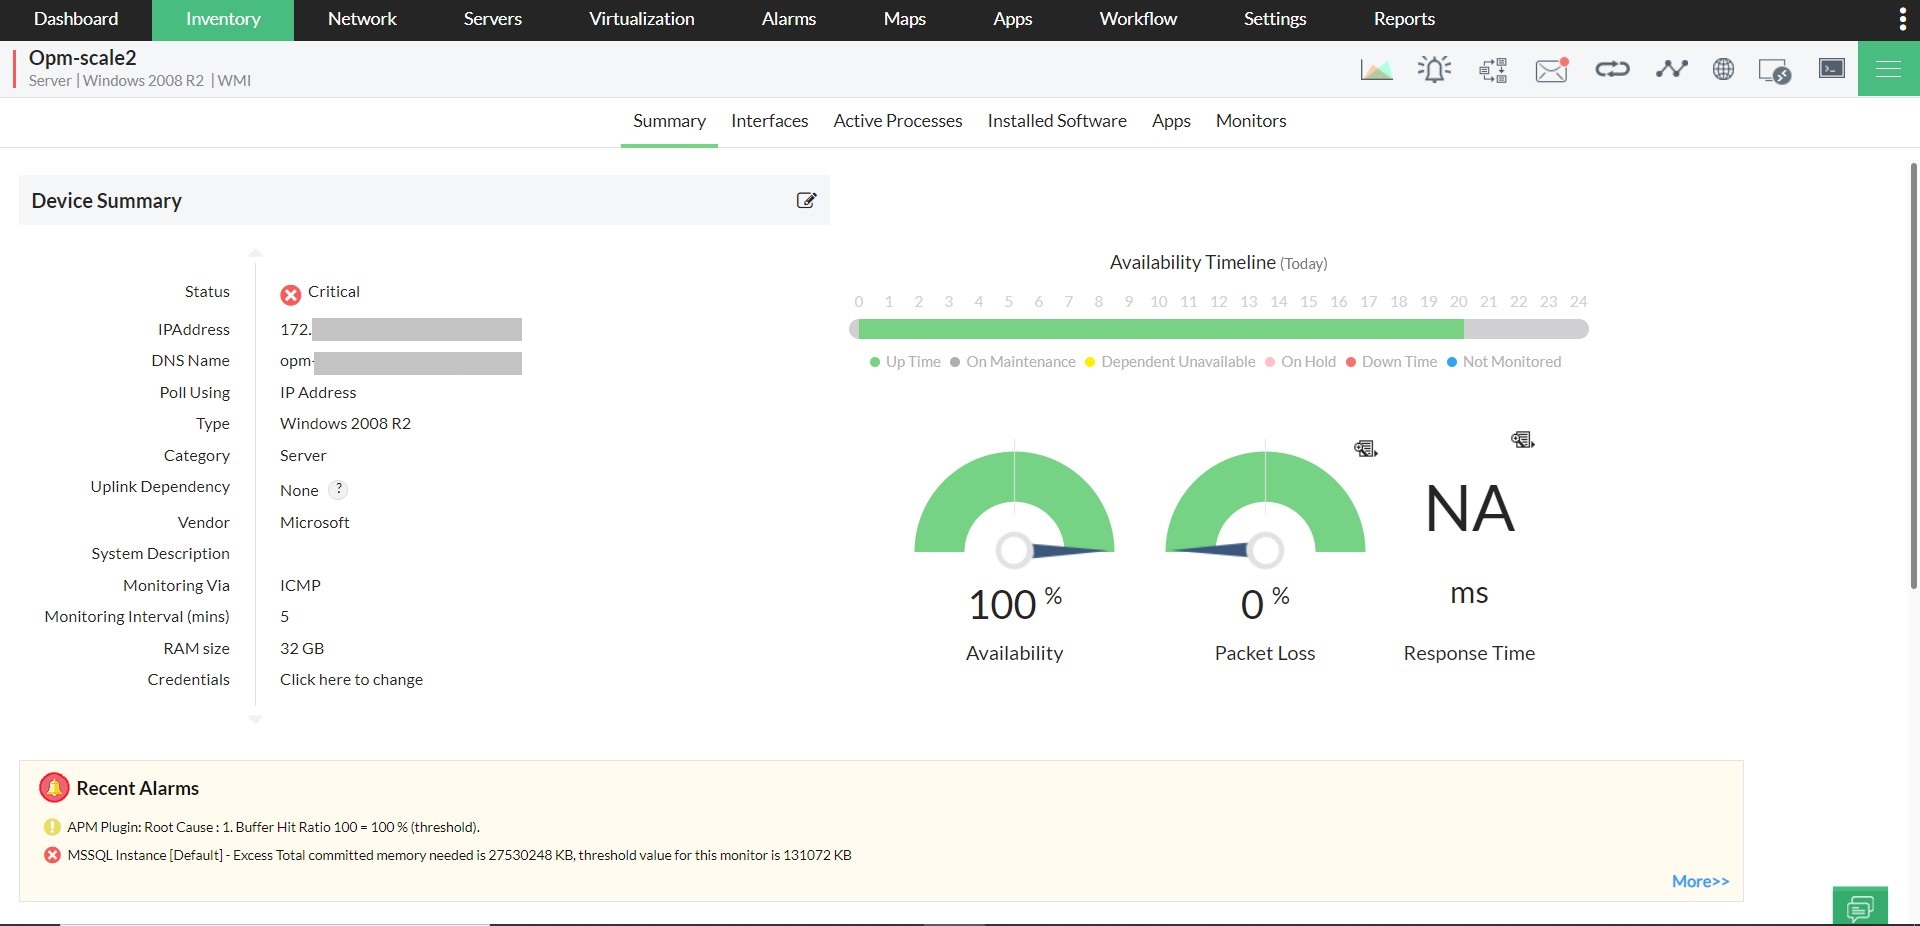
Similar to Active Directory and Exchange, OpManager displays performance monitors for MS SQL in an intuitive dashboard; supports monitoring SQL 2000/ 2005 and 2008.
-
Other Service and Application Monitors
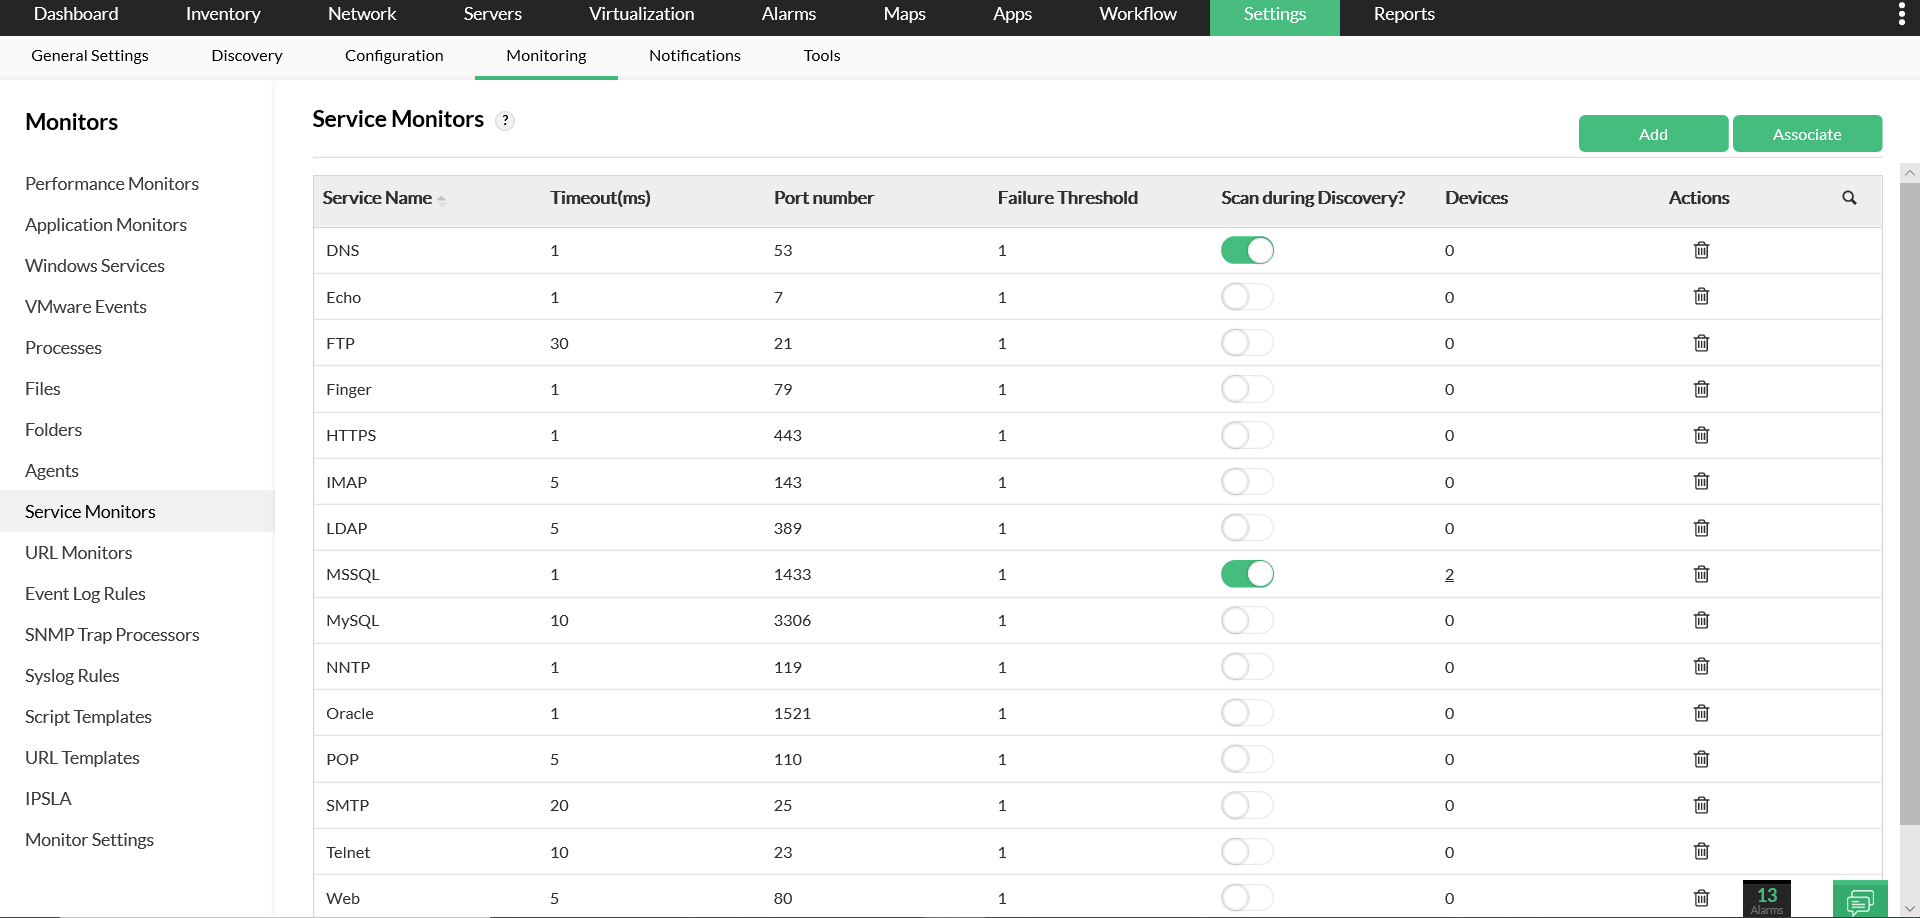
OpManager has a host of services and essential applications monitoring functionality viz. monitoring of TCP services, Windows services, Processes, URLs (HTTP/ HTTPS), Scripts and Files/Folders.
-
Alarms View
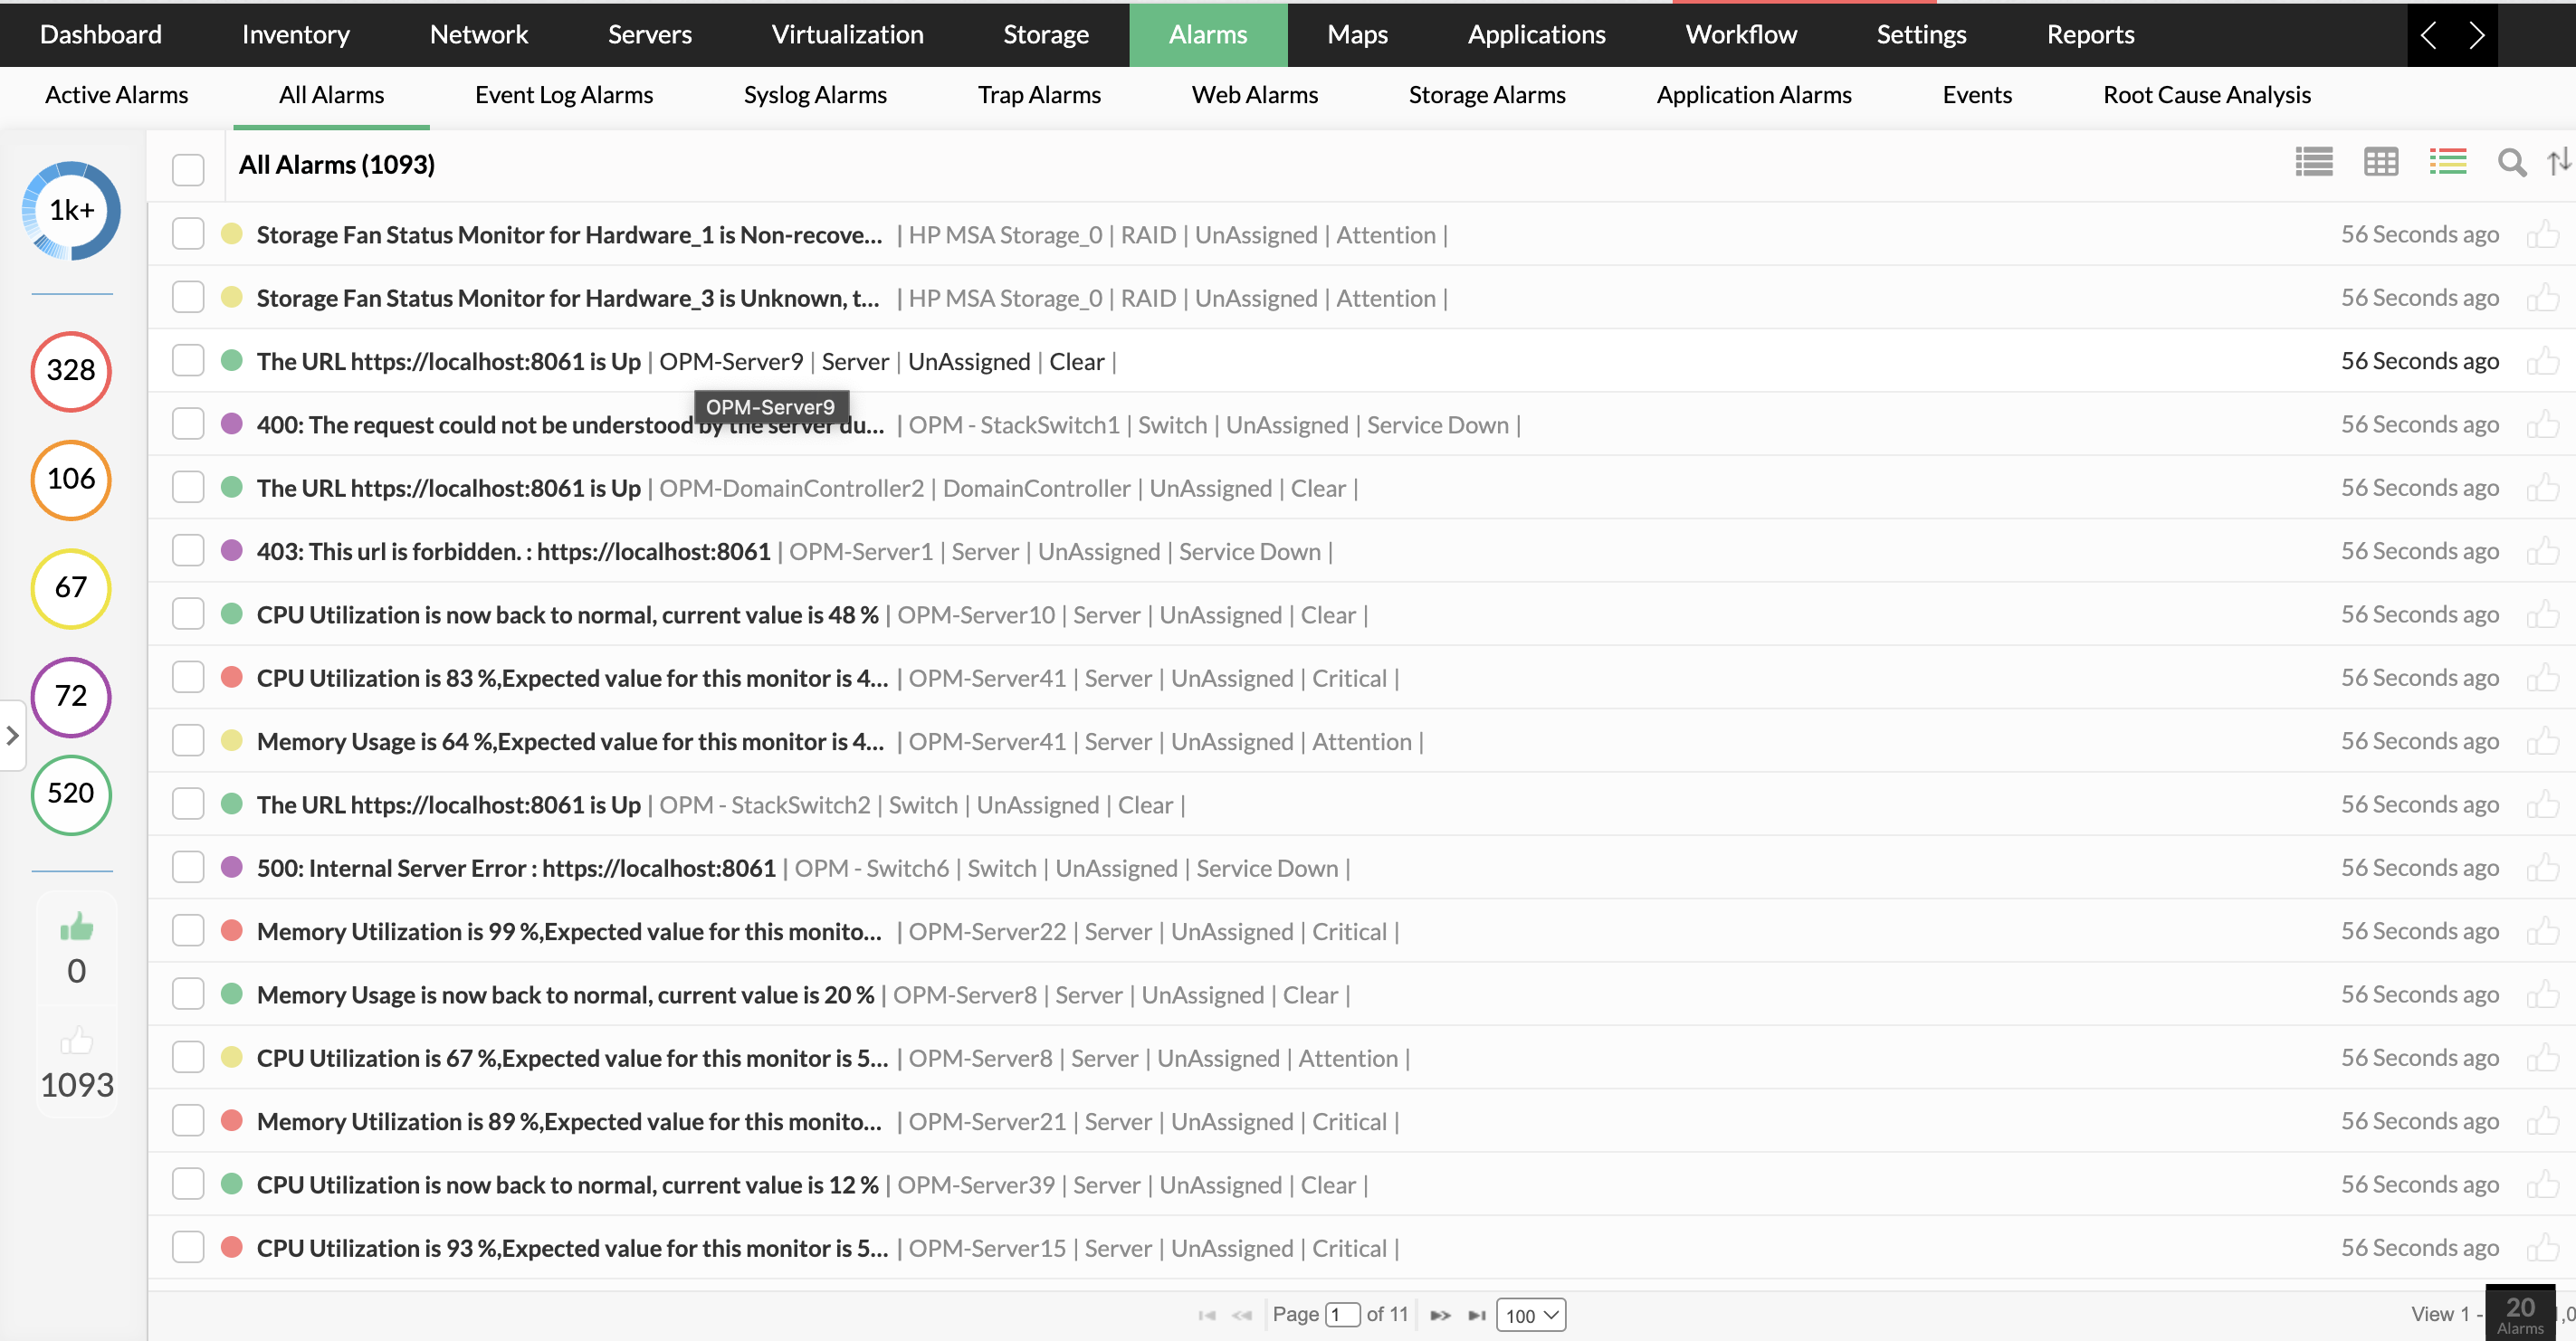
Find out what’s happening in your network with the list of recent alarms, current device status, which technician is looking after an alarm et al. You can also filter these to see alarms from a specific group like Syslog, Event Log and SNMP Traps.
-
Alerts
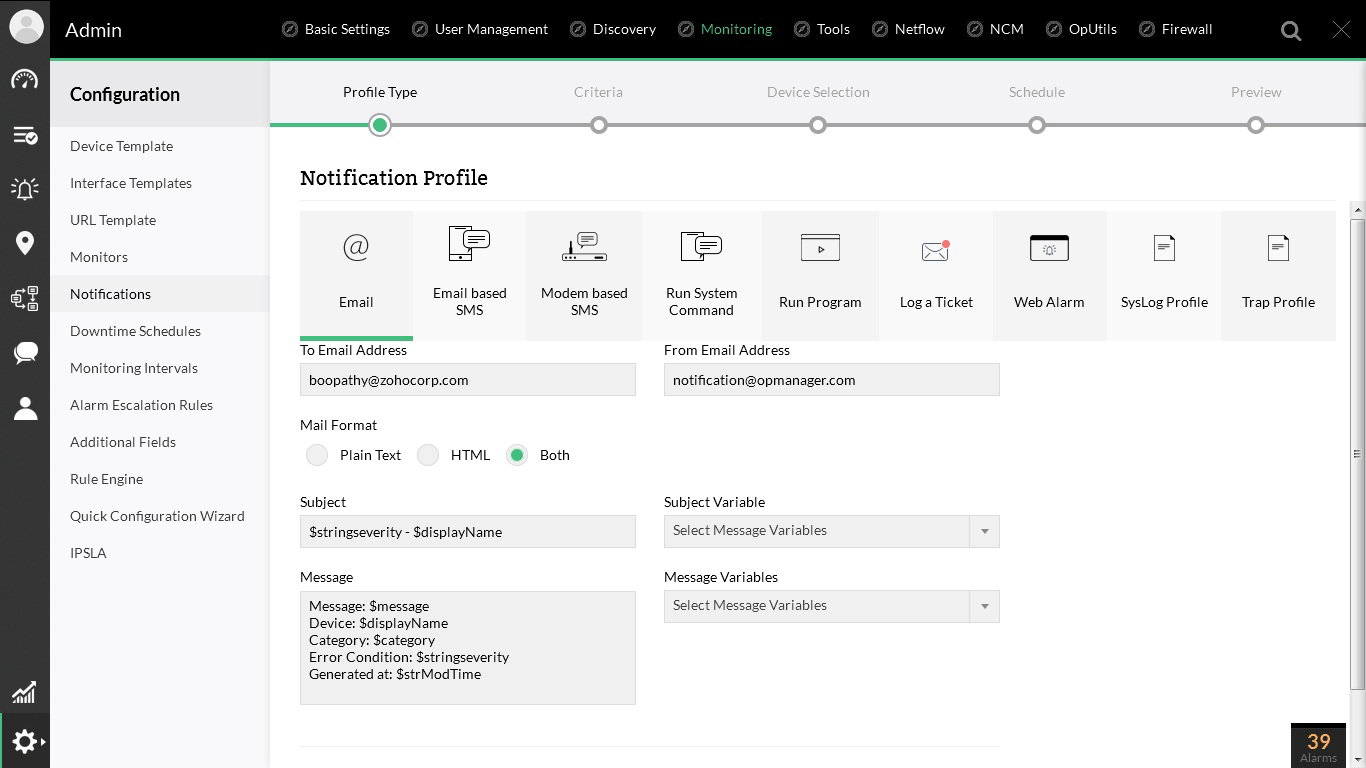
Configure OpManager to send you an alert via email or a text message to your mobile phone in the event of a network fault. You can even trigger a self-healing script /patch automatically for an event.
-
IT Workflow Automation

Automate first level troubleshooting steps and repetitive laborious maintenance tasks through our powerful IT workflow engine. This helps you to reduce MTTR and MTBF, streamline execution and thereby increasing efficiency.
-
Reports
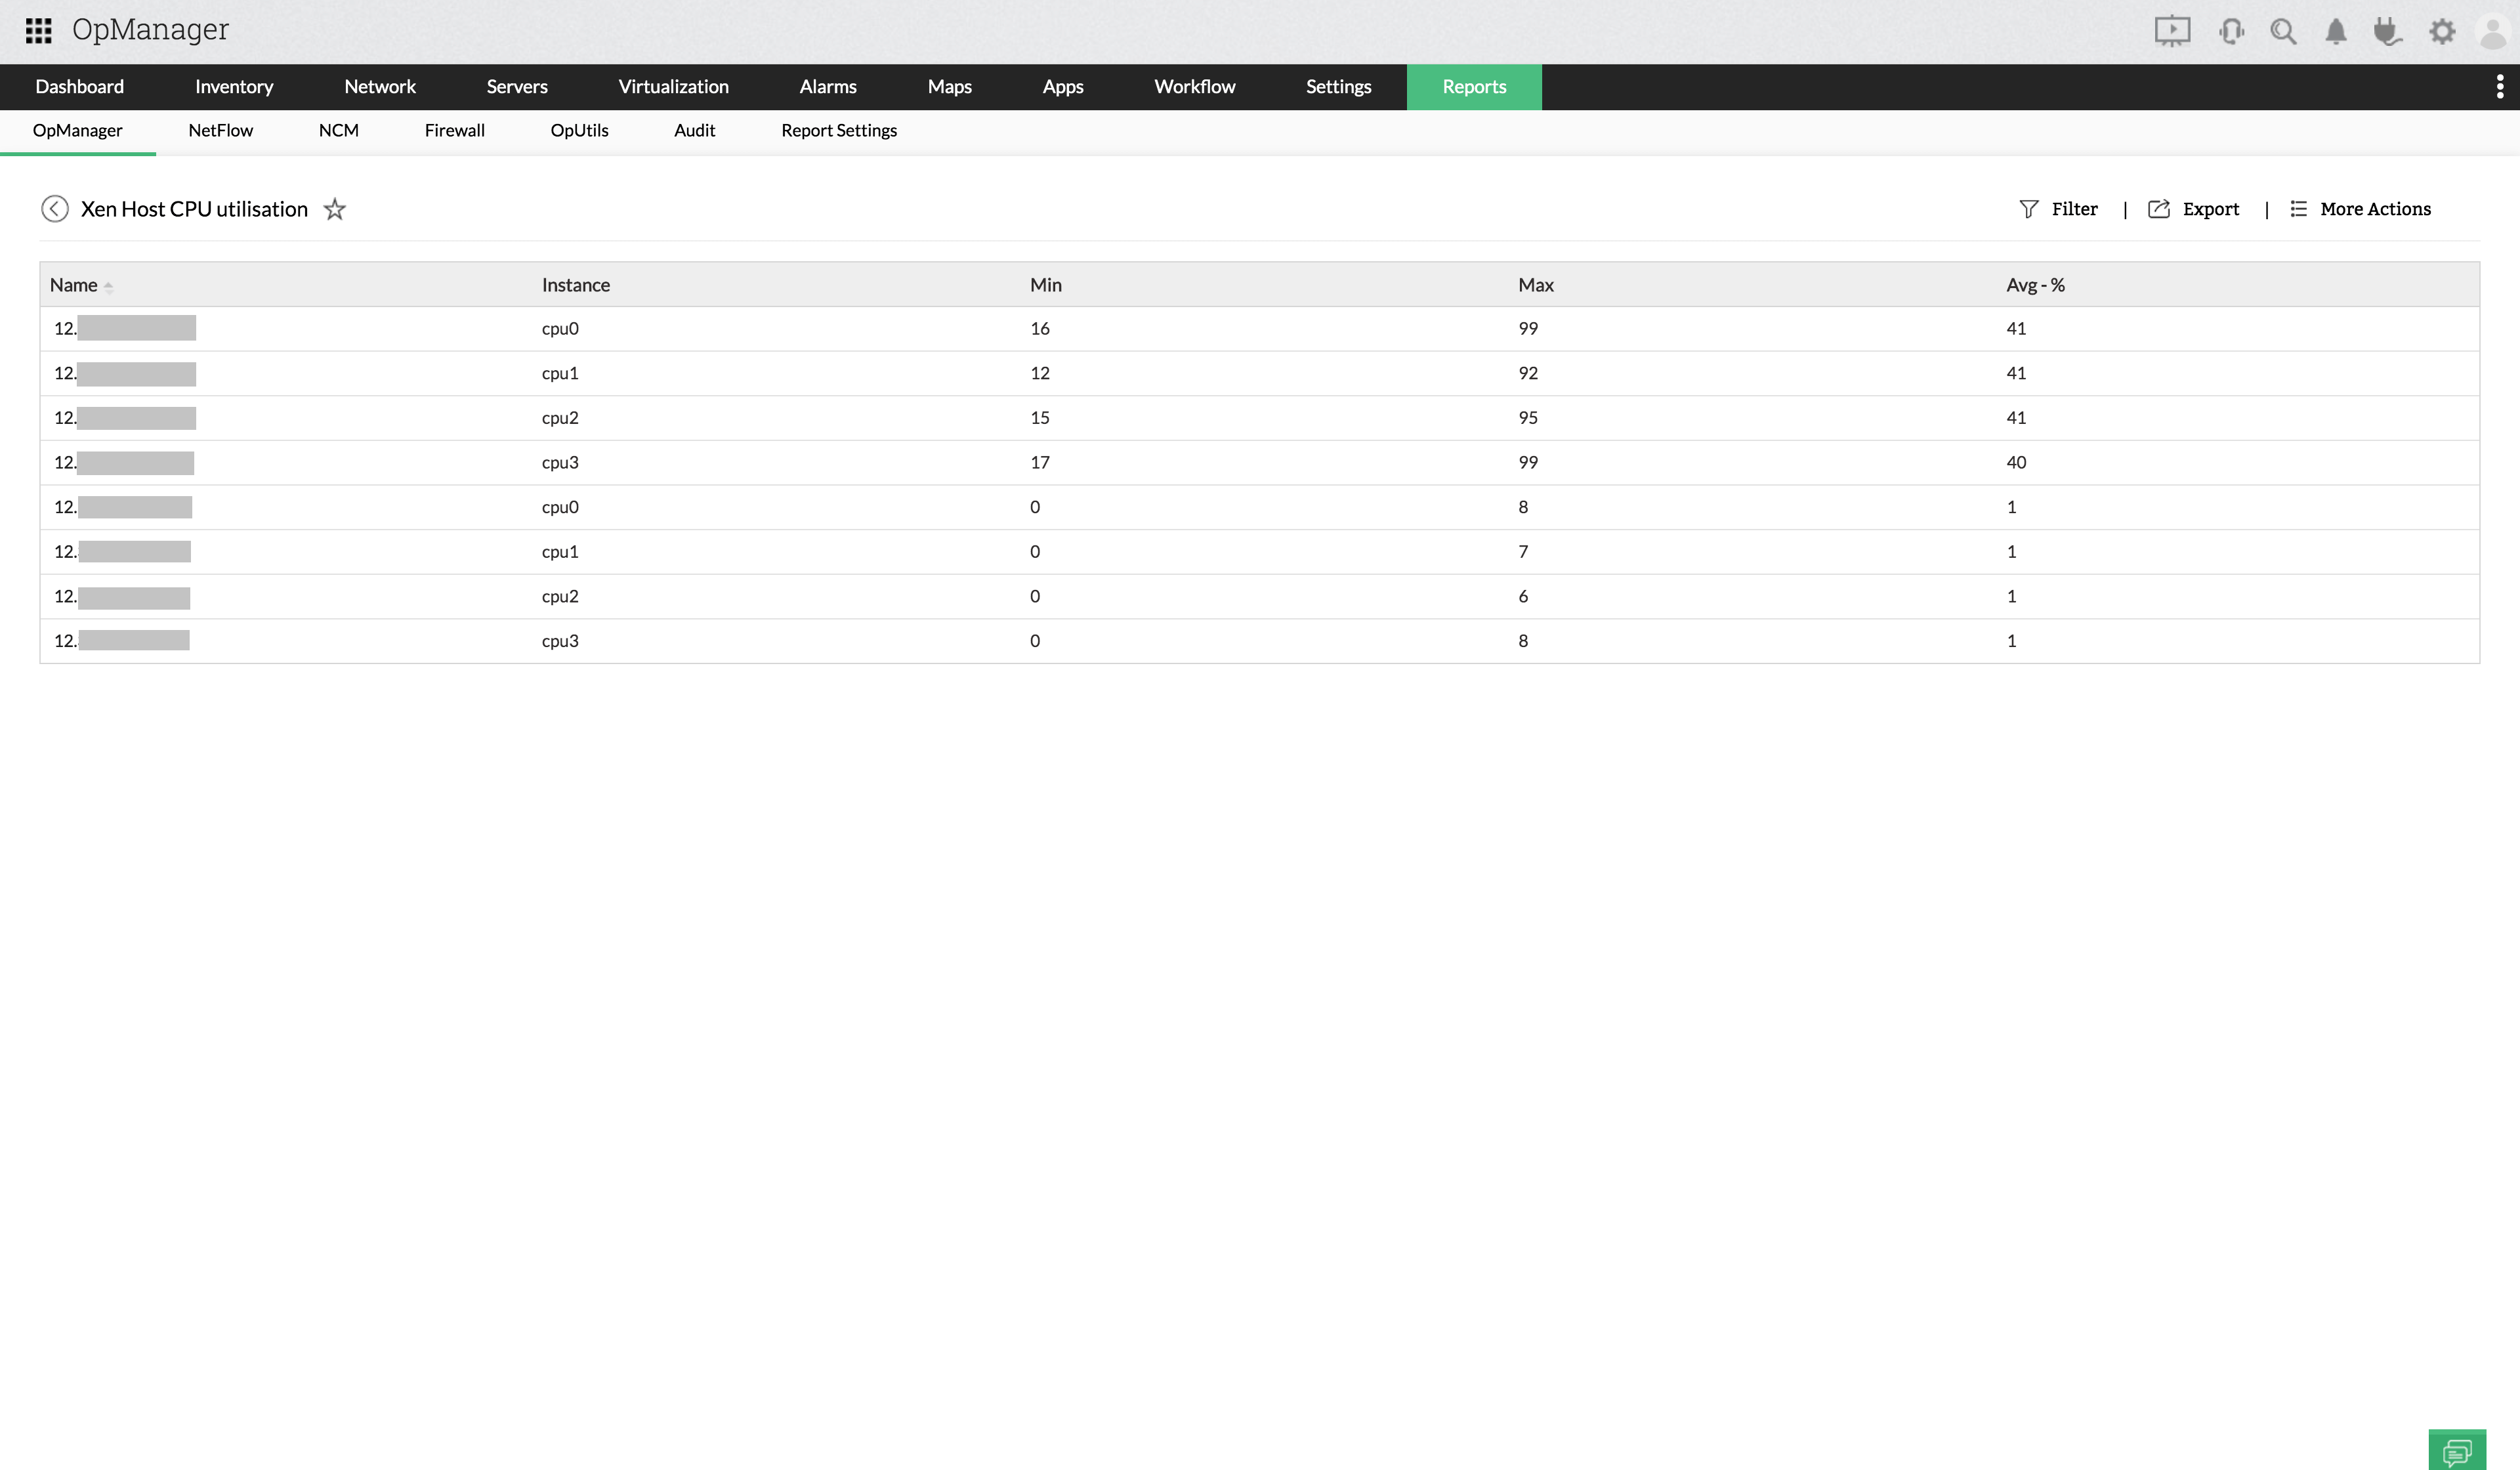
A sample report, showing options on the top right side to export as PDF or XLS or to email this report instantly. You can also find choices to schedule this report or add it to your favorite reports.


