Availability and Response Reports in OpManager
Availability and Response Reports in OpManager help enterprises ensure critical IT infrastructure and services are reachable and responsive at all times. These reports are essential for auditing uptime, identifying latency trends, and proactively addressing service disruptions. By offering detailed insights into availability and responsiveness across interfaces, servers, and applications, these reports support compliance goals, improve SLAs, and enhance the end-user experience. To access the following Availability and Response reports, go to Reports → Availability and Response.
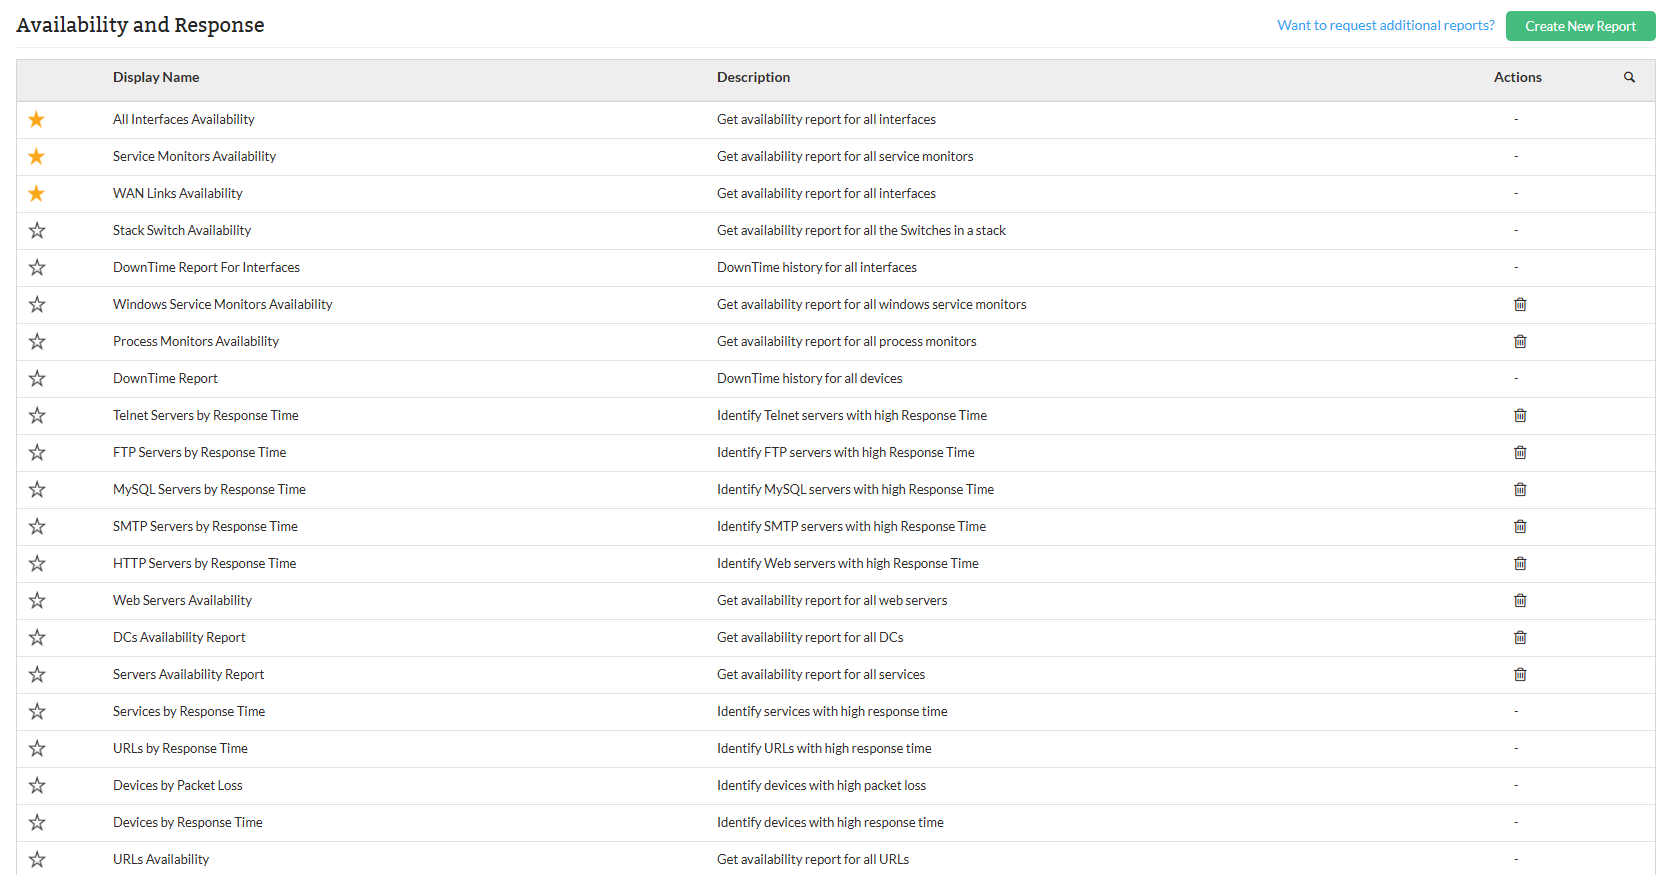
Types of Availability and Response Reports:
| Report Name | Description | Available Columns | Available Filters |
|---|---|---|---|
| All Interfaces Availability | The All Interfaces Availability report provides detailed insights into the operational status of all monitored network interfaces. It helps administrators evaluate uptime, detect outages, and monitor interfaces under maintenance or other states, supporting efficient network performance management. | Name, Up, On Hold, Maintenance, Dependent Down, Parent Down, Down, Not Monitored, Availability (%) | Category, Filter by, Period, Time Window/Business Hour, View Records |
| Service Monitors Availability | The Service Monitors Availability report displays the current status and uptime metrics of all configured service monitors across devices. It helps administrators ensure critical services like SMTP, DNS, MSSQL, and FTP are running reliably and enables quick identification of service outages or maintenance states. | Name, Up, On Hold, Maintenance, Dependent Down, Parent Down, Down, Not Monitored, Availability (%) | Category, Filter by, Period, Time Window/Business Hour, View Records |
| WAN Links Availability | The WAN Links Availability report provides visibility into the operational status and uptime of all WAN interfaces and links across devices. It helps in monitoring link reliability, detecting potential issues, and ensuring uninterrupted connectivity across wide area networks. | Name, Up, On Hold, Maintenance, Dependent Down, Parent Down, Down, Not Monitored, Availability (%) | Category, Filter by, Period, Time Window/Business Hour, View Records |
| Stack Switch Availability | The Stack Switch Availability report provides detailed availability metrics for individual switches within stacked switch configurations. It helps network administrators monitor the status and uptime of each switch in the stack, ensuring that all switches are operational and performing optimally. | Name, Up, On Hold, Maintenance, Dependent Down, Parent Down, Down, Not Monitored, Availability (%) | Category, Filter by, Period, Time Window/Business Hour, View Records |
| DownTime Report For Interfaces | The DownTime Report For Interfaces provides a detailed record of downtime events for network interfaces. It tracks when interfaces go down, the duration of the downtime, and the reason for the outage, helping users analyze and resolve network issues effectively. | Downtime Start, Downtime End, Duration, Reason | Category, Filter by, Period |
| Windows Service Monitors Availability | The Windows Service Monitors Availability report provides detailed availability statistics for Windows services monitored across devices. It tracks the operational status and downtime of services such as FTP, Telnet, and Event Logs, helping users ensure that critical services are consistently available and identify any service interruptions. | Name, Up, On Hold, Maintenance, Dependent Down, Parent Down, Down, Not Monitored, Availability (%) | Category, Filter by, Period, Time Window/Business Hour, View Records |
| Process Monitors Availability | The Process Monitors Availability report provides detailed insights into the operational status and uptime of monitored processes across devices. It helps users track critical system processes like httpd, systemd, and MSSQL, ensuring they remain up and running and are available for the device's smooth operation. | Name, Up, On Hold, Maintenance, Dependent Down, Parent Down, Down, Not Monitored, Availability (%) | Category, Filter by, Period, Time Window/Business Hour, View Records |
| DownTime Report | The DownTime Report provides a summary of downtime events for devices across the network. It helps users identify the start and end times of downtime, the total duration, and the reason for the outage, supporting effective troubleshooting and minimizing downtime impact. | Device Name, Total Downtime, Downtime Start, Downtime End, Duration, Reason | Category, Filter by, Period, View Records |
| Telnet Servers by Response Time | The Telnet Servers by Response Time report displays the response time metrics for monitored Telnet servers. It helps users evaluate the performance and responsiveness of Telnet services by providing the minimum, maximum, and average response times, enabling prompt action on latency issues. | Name, Min (ms), Max (ms), Avg (ms) | Category, Filter by, Period, Time Window/Business Hour, View Records |
| FTP Servers by Response Time | The FTP Servers by Response Time report presents response time statistics for monitored FTP servers. It assists users in assessing FTP service performance by showing the minimum, maximum, and average response times, helping identify latency or connection issues. | Name, Min (ms), Max (ms), Avg (ms) | Category, Filter by, Period, Time Window/Business Hour, View Records |
| MySQL Servers by Response Time | The MySQL Servers by Response Time report provides response time metrics for monitored MySQL servers. It helps users evaluate database performance by displaying the minimum, maximum, and average response times, enabling early detection of latency or performance degradation. | Name, Min (ms), Max (ms), Avg (ms) | Category, Filter by, Period, Time Window/Business Hour, View Records |
| SMTP Servers by Response Time | The SMTP Servers by Response Time report displays performance metrics for monitored SMTP servers. It enables users to assess the responsiveness of email services by showing the minimum, maximum, and average response times, helping to identify delays in mail server communication. | Name, Min (ms), Max (ms), Avg (ms) | Category, Filter by, Period, Time Window/Business Hour, View Records |
| HTTP Servers by Response Time | The HTTP Servers by Response Time report provides key response time statistics for monitored HTTP servers. It helps users evaluate the performance and responsiveness of web services by displaying minimum, maximum, and average response times. | Name, Min (ms), Max (ms), Avg (ms) | Category, Filter by, Period, Time Window/Business Hour, View Records |
| Web Servers Availability | The Web Servers Availability report tracks the operational status of monitored web servers. It provides insights into uptime and potential downtimes, helping users ensure continuous availability of web-based services. | Name, Up, On Hold, Maintenance, Dependent Down, Parent Down, Down, Not Monitored, Availability (%) | Category, Filter by, Period, Time Window/Business Hour, View Records |
| DCs Availability Report | The DCs (Domain Controllers) Availability Report provides the availability status of domain controllers in the network. It helps users monitor the uptime and health of these critical infrastructure components to ensure reliable authentication and directory services. | Name, IP Address, Up, On Hold, Maintenance, Dependent Unavailable, Down, Not Monitored, Availability (%) | Category, Filter by, Period, Time Window/Business Hour, View Records |
| Servers Availability Report | The Servers Availability Report provides uptime statistics for all monitored servers, helping users ensure continuous availability and detect potential disruptions across critical systems. | Name, IP Address, Up, On Hold, Maintenance, Dependent Unavailable, Down, Not Monitored, Availability (%) | Category, Filter by, Period, Time Window/Business Hour, View Records |
| Services by Response Time | The Services by Response Time report displays the latency metrics for various monitored services across servers. It helps users identify potential delays in service responsiveness and assess overall performance trends. | Name, Service Name, Min (ms), Max (ms), Avg (ms) | Category, Filter by, Period, Time Window/Business Hour, View Records |
| URLs by Response Time | This section provides performance insights based on response time statistics for various URLs accessed through monitored hosts. It helps users evaluate network latency and web resource availability. | Name, Device Name, Min, Max, Avg (ms) | Category, Filter by, Period, Time Window/Business Hour, View Records |
| Devices by Packet Loss | This section provides details about the packet loss observed on different devices. Packet loss can occur due to network issues, leading to degraded performance or disrupted services. The data presented here includes the minimum, maximum, and average packet loss percentages. | Name, Min %, Max %, Avg % | Category, Filter by, Period, Time Window/Business Hour, View Records |
| Devices by Response Time | The Devices by Response Time report provides a detailed overview of the response times for various monitored devices. It enables administrators to evaluate the minimum, maximum, and average response times of devices, which is crucial for identifying performance issues and ensuring smooth network operations. | Name, Min (ms), Max (ms), Avg (ms) | Category, Filter by, Period, Time Window/Business Hour, View Records |
| URLs Availability | The URLs Availability report provides insights into the availability of various URLs being monitored. It helps administrators track the status of different URLs by showing their up time, any downtime, and the overall availability percentage. This is crucial for ensuring that critical URLs are consistently accessible. | Name, Device Name, URL, Up, On Hold, Maintenance, Dependent Unavailable, Down, Not Monitored, Availability (%) | Category, Filter by, Period, Time Window/Business Hour, View Records |
| Devices Availability | The Devices Availability report provides insights into the availability of network devices by tracking their operational status. It helps administrators monitor whether devices are up and accessible, under maintenance, or facing issues such as being down or unavailable. This ensures the network’s infrastructure remains operational and identifies devices that may need attention. | Name, IP Address, Up, On Hold, Maintenance, Dependent Unavailable, Down, Not Monitored, Availability (%) | Category, Filter by, Period, Time Window/Business Hour, View Records |
| Devices Availability Dashboard | The Devices Availability Dashboard provides a high-level overview of the availability of network devices, focusing on their total downtime and overall availability percentage. This helps administrators quickly assess the health of the network by reviewing how long devices have been down and their availability over time. | Device Name, Total Down Time, Availability Percentage | Category, Filter by, Data Type, Period |
To know more about the Available Filters in various reports of OpManager, Click here.
Click here to know more about other report types in OpManager.