Meraki Reports
The Meraki Reports are a set of comprehensive reporting tools within the Cisco Meraki dashboard. They help administrators monitor, analyze, and manage various Meraki devices—such as access points, security appliances, switches, and cameras—from a single, unified interface. These reports can show device status, inventory information, performance metrics, and help with troubleshooting and capacity planning. By leveraging Meraki Reports, network operators gain insights into network health and usage patterns, enabling more informed decisions and proactive maintenance.
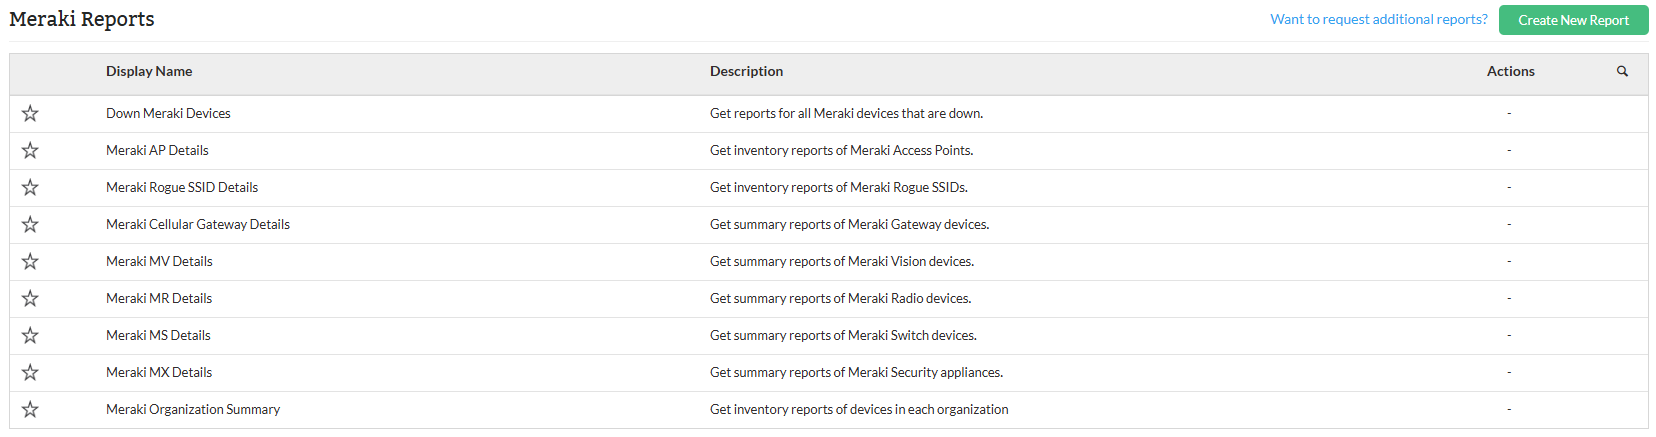
To access Meraki Reports, navigate to Reports → Meraki Reports from the main menu.
Meraki Report Types
| Report Name | Description | Available Columns | Available Filters |
|---|---|---|---|
| Down Meraki Devices Report | This report lists Meraki devices that are currently down, indicating connectivity or operational issues. | Organization Name, IP Address, Network Name, Device Name, Device Type, Down Since | Category, Organization Name, Filter by, Period, and Time Window/Business Hour |
| Meraki Access Point (AP) Details Report | This report provides details about Meraki access points across an organization. | Organization Name, AP Name, SSID, Number of Clients | Organization Name, Filter by |
| Meraki Rogue SSID Details Report | This report identifies rogue SSIDs detected within Meraki-managed networks. | Organization, Network Name, SSID Name, Channels, Detected Time | Organization Name, Filter by |
| Meraki Cellular Gateway Details Report | This report provides information about cellular gateways managed through Meraki, including their power state and network-related details. | Organization Name, Power State, Device Name, DNS Name, IP Address, MAC Address, Network | Category, Organization Name, Filter by, Period, and Time Window/Business Hour |
| Meraki MV Details Report | This report lists details of Meraki MV deployed across networks. | Organization Name, Power State, Device Name, DNS Name, IP Address, MAC Address, Network | Organization Name, Filter by |
| Meraki MR Details Report | This report provides detailed information about Meraki MR wireless access points. | Organization Name, Power State, Device Name, DNS Name, IP Address, MAC Address, Network | Organization Name, Filter by, Show UnManaged APs, Show Down APs |
| Meraki MS Report | This report lists Meraki MS switches within the organization, along with their operational and network details. | Organization Name, Power State, Device Name, DNS Name, IP Address, MAC Address, Network | Organization Name, Filter by |
| Meraki MX Details Report | This report shows data related to Meraki MX security appliances, including their power and network status. | Organization Name, Power State, Device Name, DNS Name, IP Address, MAC Address, Network | Organization Name, Filter by |
| Meraki Organization Summary Report | This report provides a high-level overview of Meraki device deployments across an organization. | Organization Name, Number of Networks, Meraki Security (MX), Meraki Switch (MS), Meraki Radios (MR), Meraki Vision (MV), Meraki Cellular Gateway (MG) | Organization Name, Filter by |
| Meraki Sensors Report | This report provides detailed information on Meraki Sensors deployed across networks. | Organization Name, Power State, Device Name, DNS Name, IP Address, MAC Address, Network | Organization Name, Filter by |
Meraki Organization Summary: Compile inventory reports for each organization to gain insights into device distribution and overall network health.
Users can apply various filters to narrow down reports, such as filtering by category, device, or time period. You can also export reports to PDF or Excel, schedule them for automated generation within defined business hours or time windows.
Click here to know more about other report types in OpManager.
To know more about the Available Filters in various reports of OpManager, Click here.