How to generate customized device and interface inventory reports from the Inventory page?
You can generate customized device and interface reports form the Inventory page. The Report Builder option allows you to generate instant availability and performance reports for the needed time interval.
To generate inventory reports for devices or interfaces,
- Go to Inventory -> Devices (for device reports) or Inventory -> Interfaces (for interface reports).
- Select the devices or interfaces for which you would like to generate a report and click on the Generate Reports option on the top right.
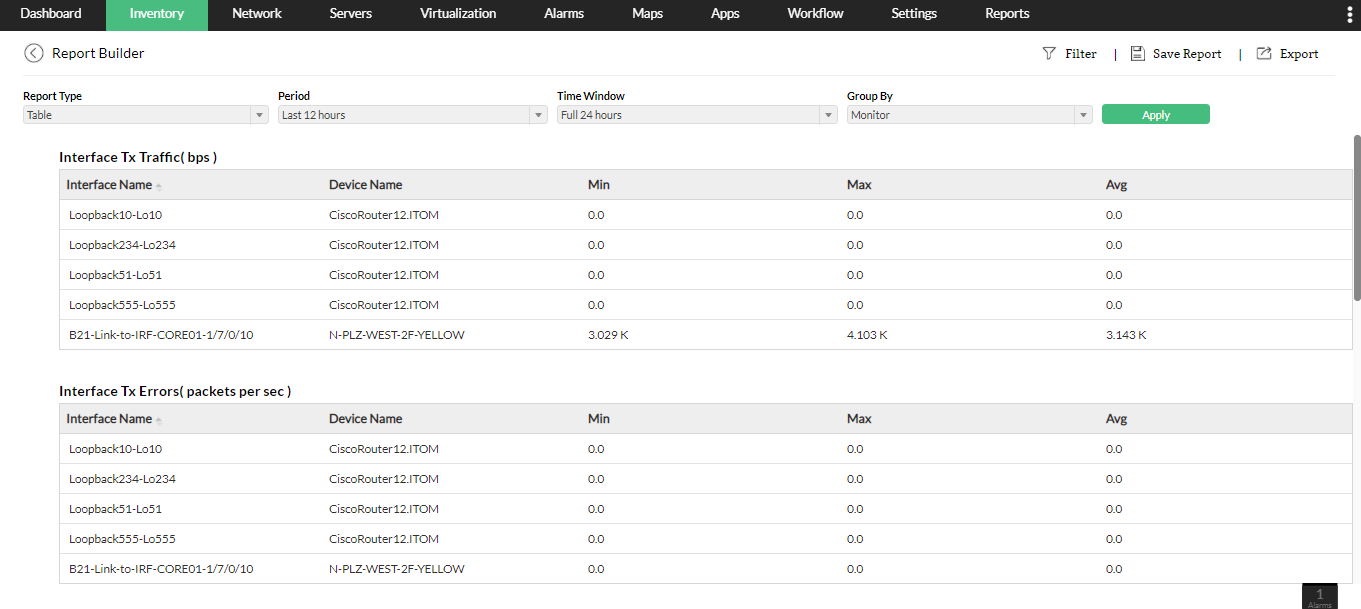
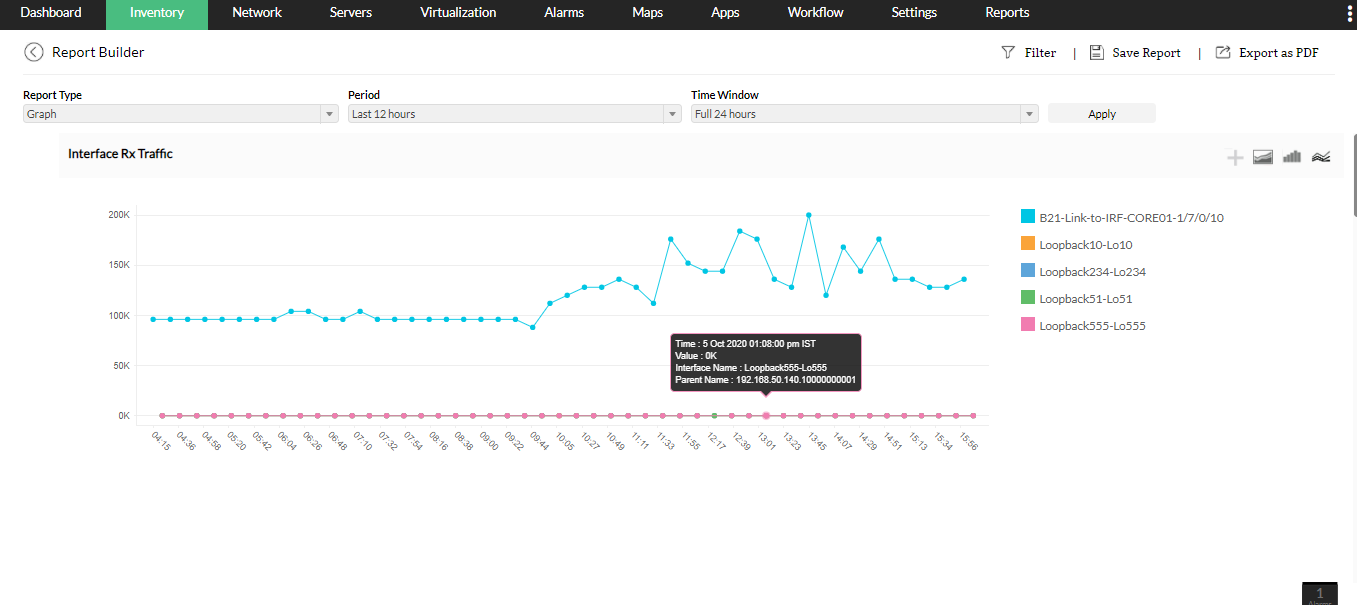
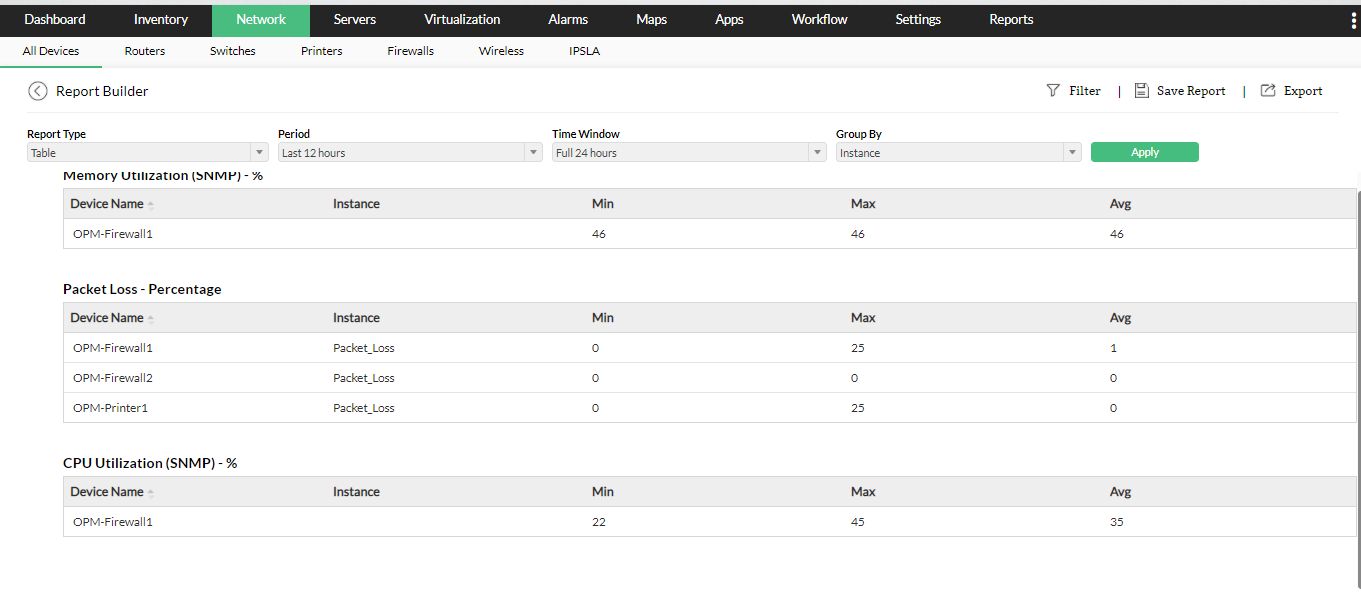
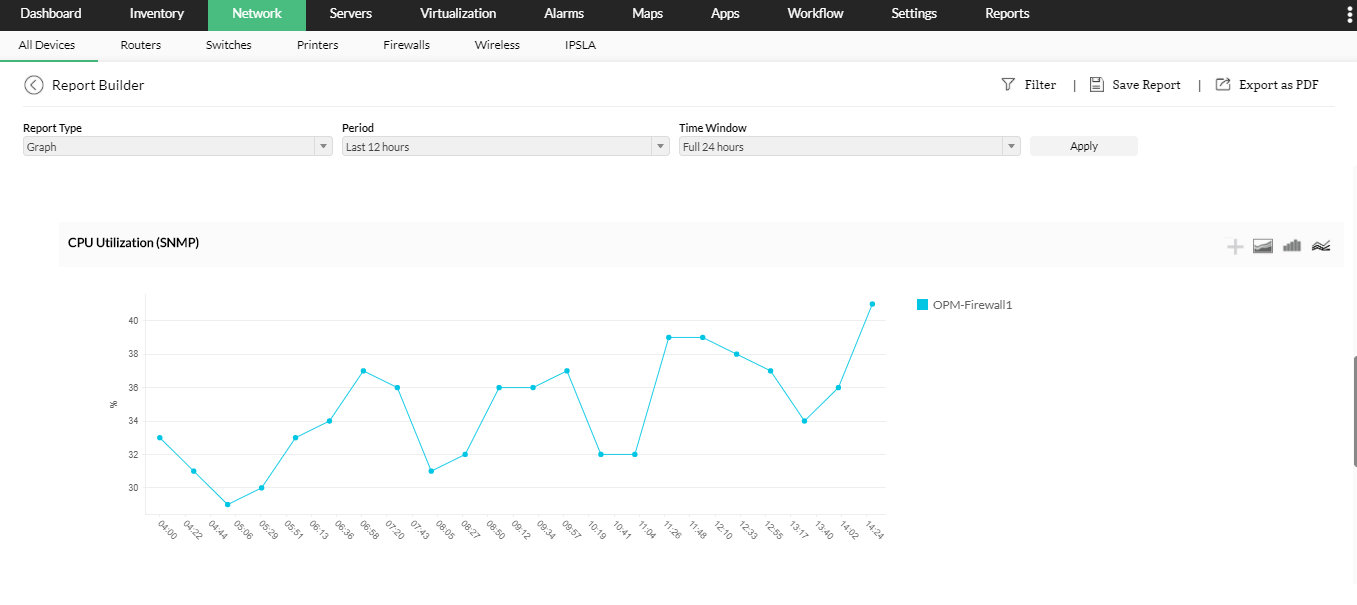
- Select the report type (Graph view or table view) and time interval. You can choose from the available types of graphs such as area, bar or line chart graph.
- Now, choose from the available list of monitors for which the report is required.
- Once done, click on Generate Reports on the bottom. The customized report will now be generated by OpManager. You can further edit the time window for which the report is generated in the Report Builder page.
- Export: You can either export the generated report as PDF or XLS file.
- Save Report: You can also save this report for future references. The saved report will be listed under 'Integrated Reports' menu under the Reports tab. In addition, these reports can also be scheduled periodically if necessary.
Available performance monitors (Devices): Listed below are the default monitors available. Also, all performance monitors associated with the discovered devices will be listed here for report generation
| Monitor Name | Description |
| Device Availability | The availability of the selected devices. |
| Packet Loss | Details on pack loss for the selected devices. |
| Response time | The response time of the selected set of devices. |
| CPU Utilization | Details on the utilization of CPU in the selected devices. |
| Memory Utilization | Details on how much memory is consumed by the devices |
Available performance monitors (Interfaces)
| Monitor Name | Description |
| Rx Traffic, | Details on the In speed of the selected interfaces. |
| Tx Traffic, | Details on the Out speed of the selected interfaces. |
| Rx Discards | The discard rate of the interfaces |
| Tx Discards | The discard rate of the interfaces |
| Rx Errors | |
| Tx Errors | |
| Rx Utilization | The bandwidth utilization of the selected interfaces. |
| Tx Utilization | The bandwidth utilization of the selected interfaces. |