SD-WAN Monitoring in OpManager
OpManager's SD-WAN (Software-Defined Wide Area Network) monitoring feature helps users track the health, availability, and performance of their SD-WAN devices. This document provides step-by-step instructions on the following:
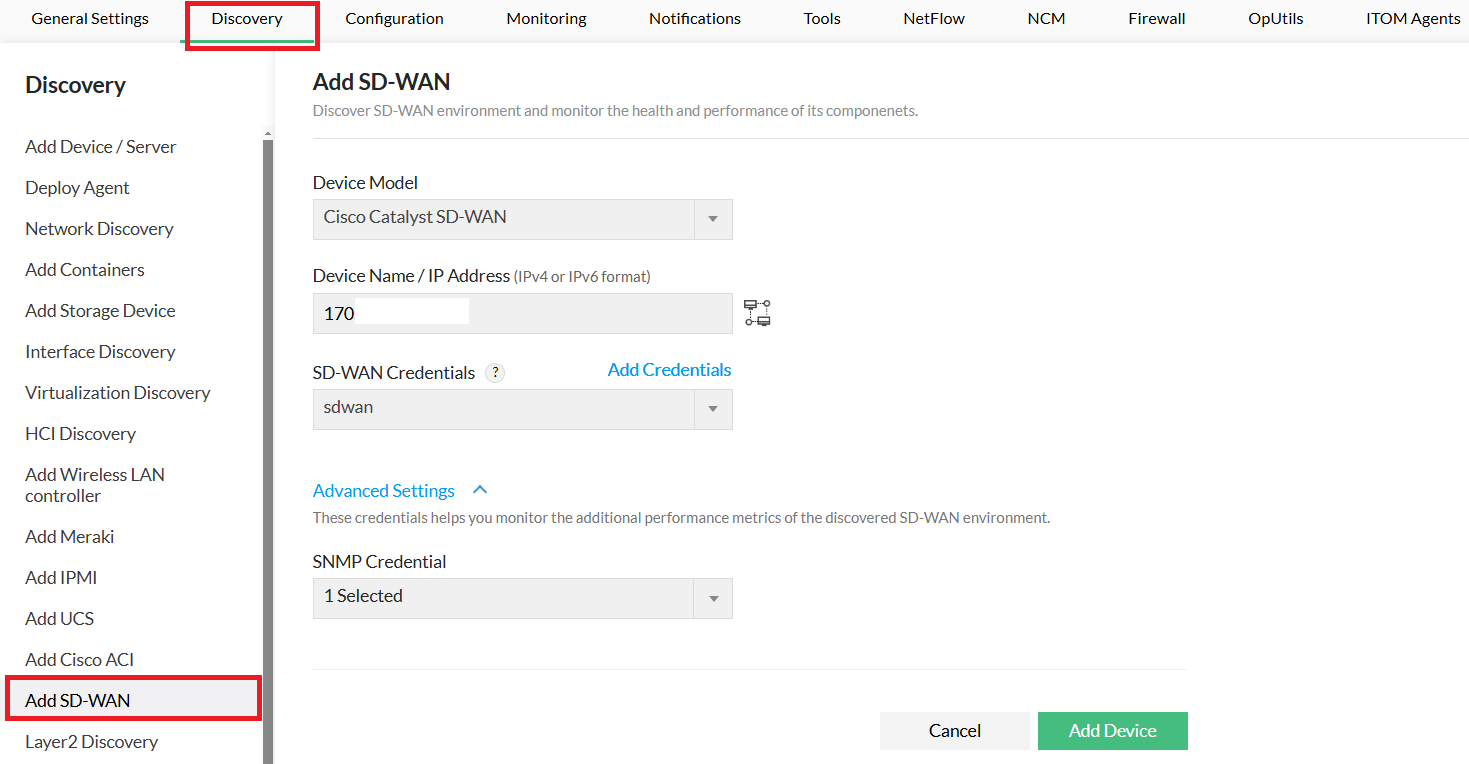
Discovering SD-WAN devices in OpManager
To add and monitor an SD-WAN device in OpManager, follow these steps:
- Navigate to Settings > Discovery > Add SD-WAN.
- Select the SD-WAN device model from the list.
- Provide the SD-WAN IP address or hostname.
- Select the SD-WAN credentials from the drop-down menu or click Add Credentials.
- (Optional) Under Advanced Settings, configure authentication details for child devices.
- Click Discover to initiate the SD-WAN discovery process.
- Once discovery is complete, the controller, sites, and edge devices will be added to OpManager’s inventory.
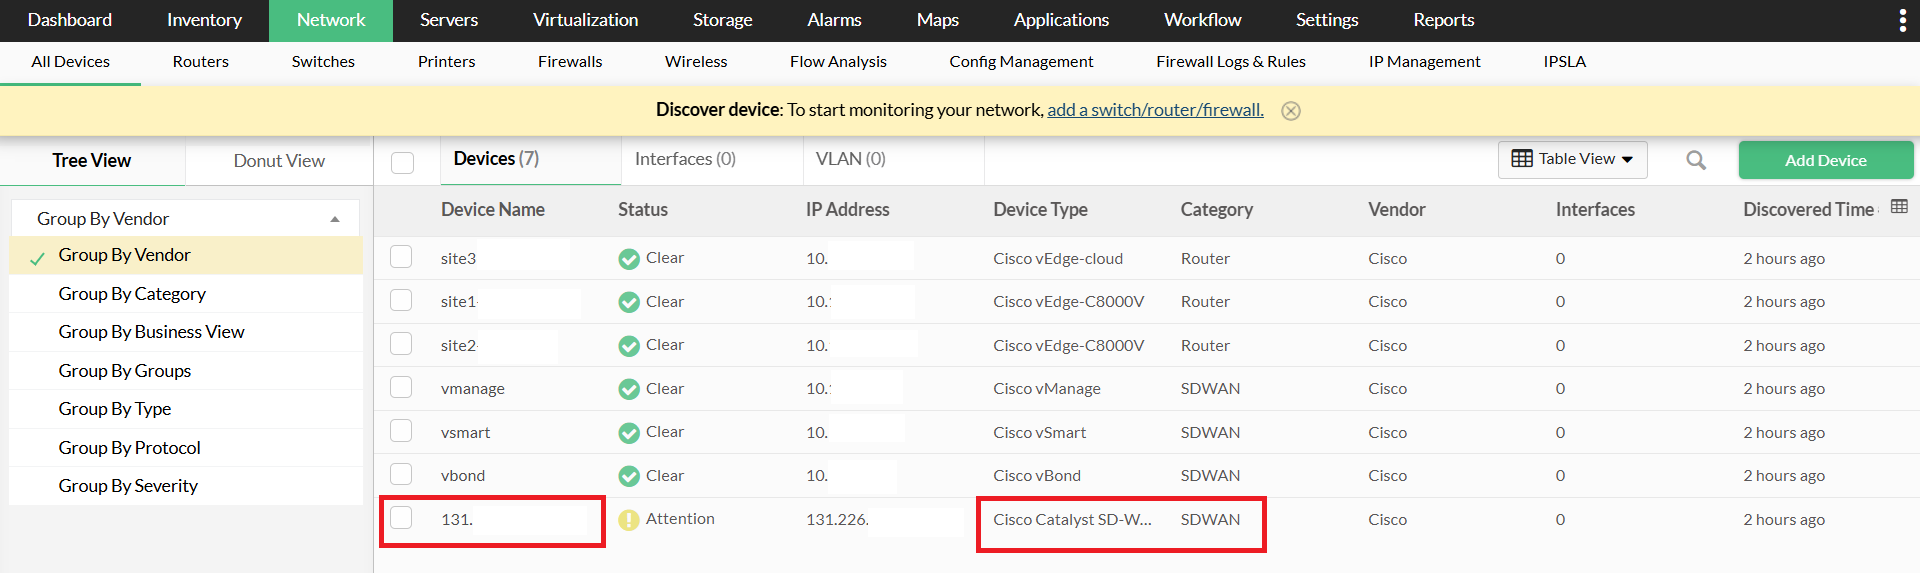
SD-WAN snapshot page
Once the SD-WAN devices are discovered, they will be added to the inventory. Follow these steps to access their details:
- Navigate to Inventory or Network in OpManager.
- Locate and click on the SD-WAN device to open its snapshot page.
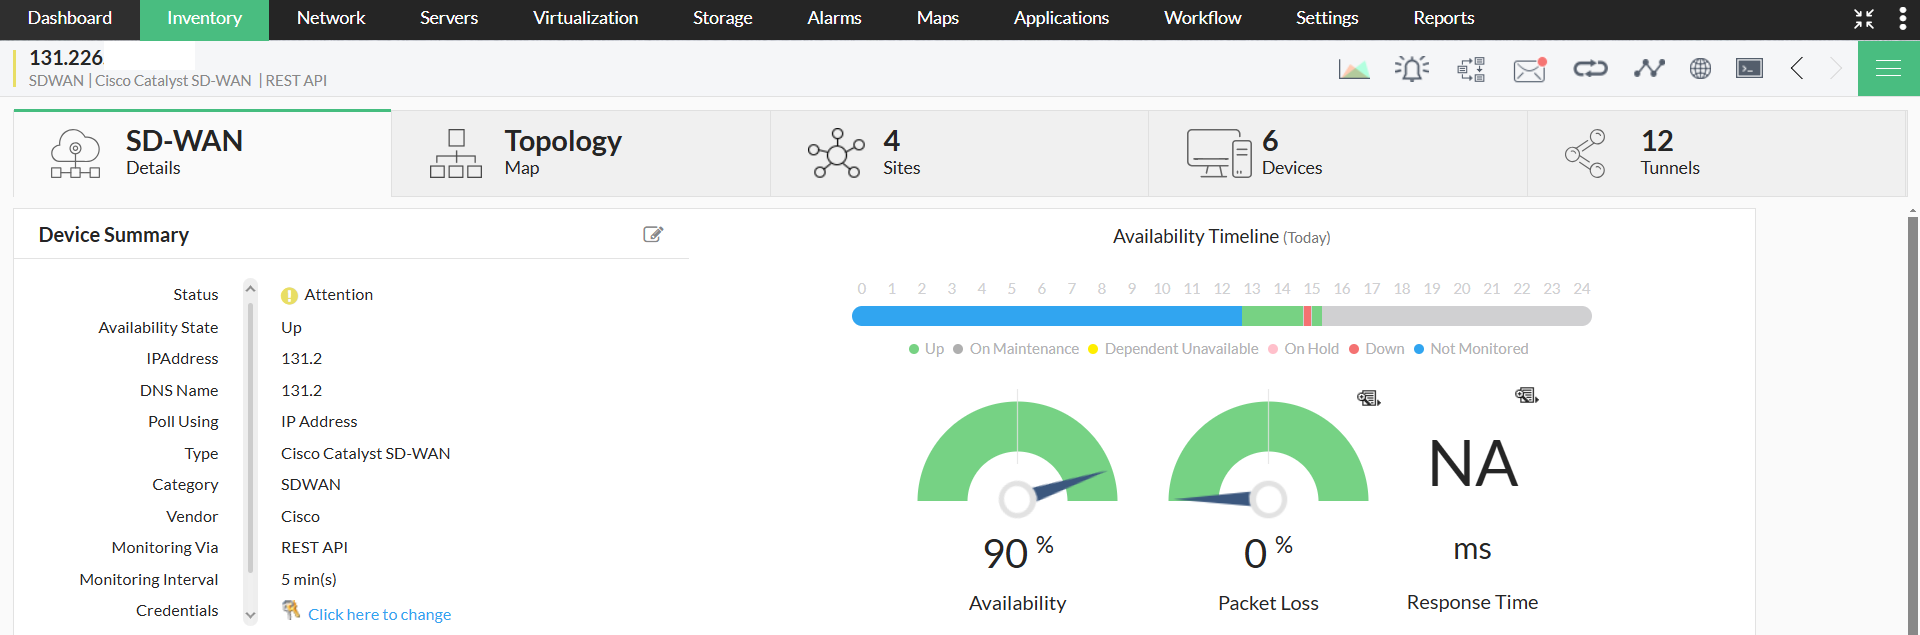
- The snapshot page provides:
- Status & Availability – Displays the current state of the SD-WAN device.
- SD-WAN Summary – Offers an overview of key performance metrics.
- Basic Device Details – Includes model, serial number, and IP address.
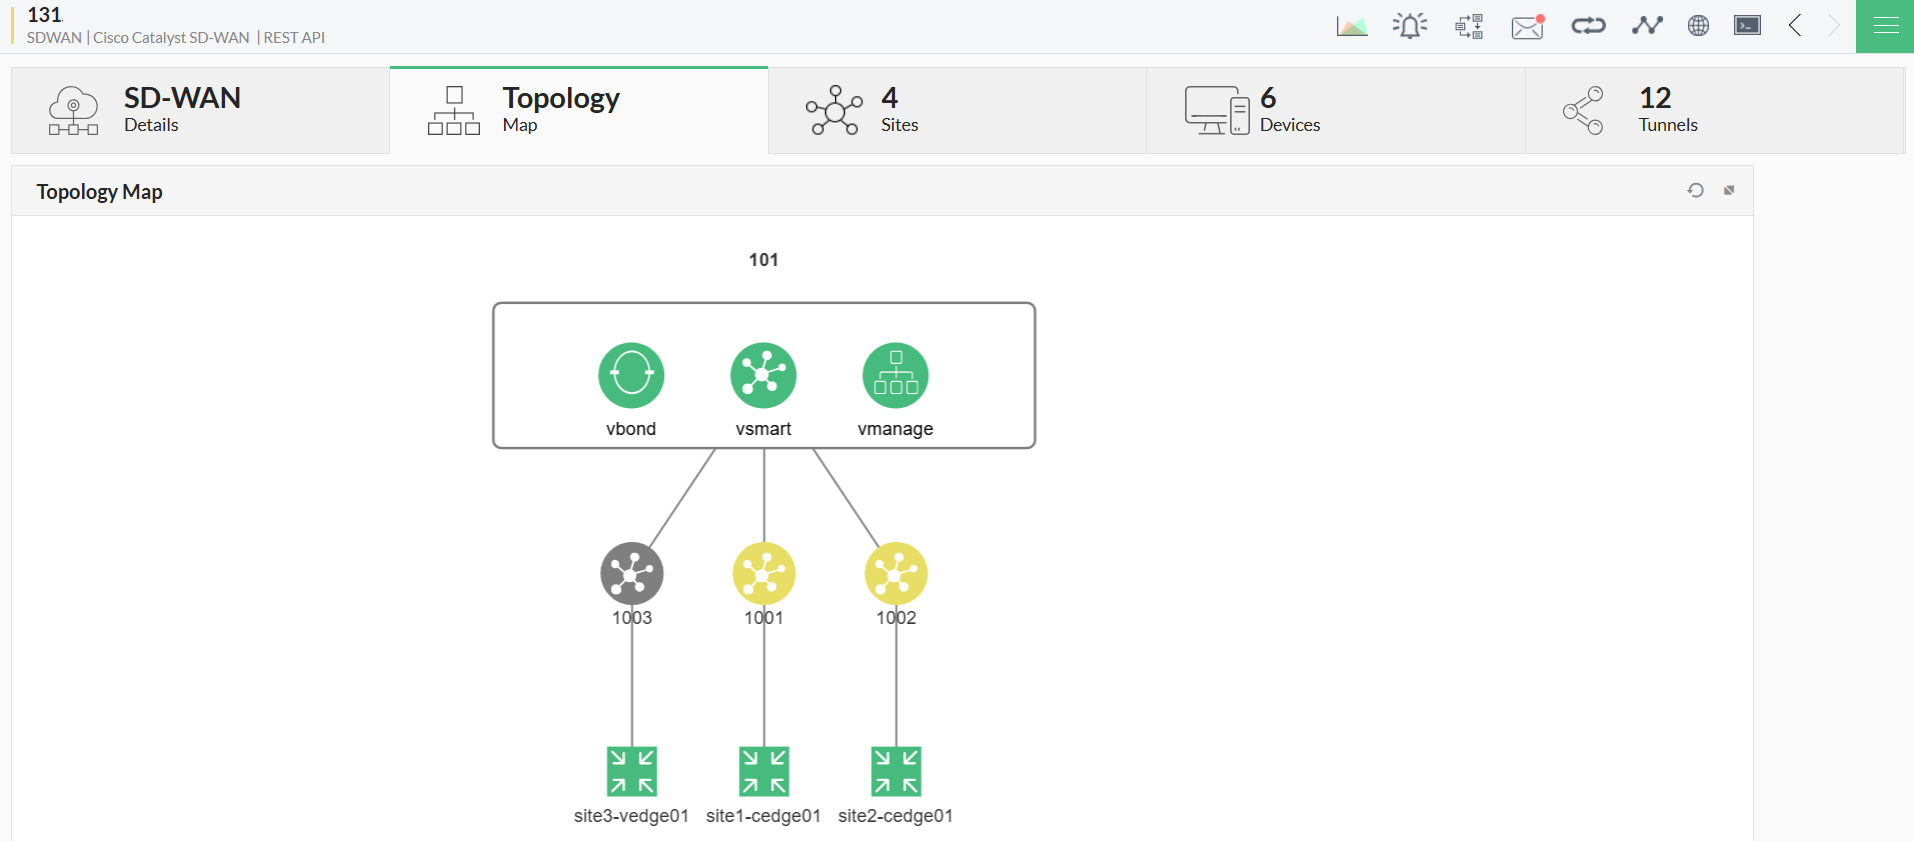
SD-WAN topology map
The Topology Map provides an interactive view of SD-WAN components, including controllers, sites, and edge devices. To access the topology map:
- Open the SD-WAN snapshot page.
- Click on the "Topology Map" tab.
- The topology map displays:
- Controllers – Centralized components (vManage, vSmart, and vBond) that manage and control SD-WAN operations.
- Sites – Individual network locations managed under vManage.
- Edge Devices – Hardware or virtual appliances deployed at sites.
Managing SD-WAN sites
A site represents a physical or logical location within an SD-WAN network, such as branch offices or data centers, where SD-WAN devices are deployed.
Managing and monitoring sites
To efficiently manage and monitor sites, users can take the following bulk actions using the Actions button at the top-right corner:
- Manage or unmanage sites.
- Suppress or unsuppress alarms.
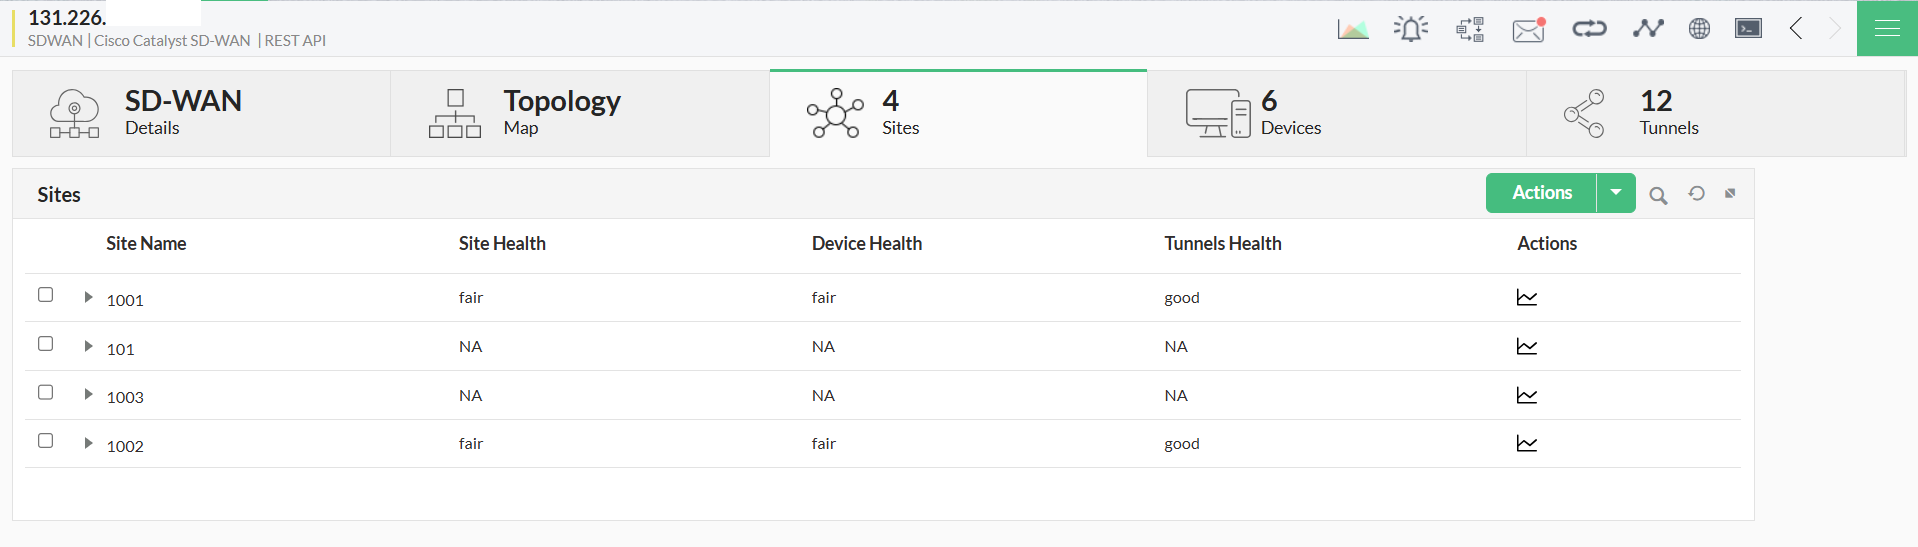
Viewing site details
- Open the "Sites" tab on the SD-WAN snapshot page.
- The Sites section displays the following details:
- Site Name – The designated name of the SD-WAN site.
- Site Health – Reflects the overall operational condition of the site.
- Device Health – Shows the status of all devices associated with the site.
- Tunnel Health – Displays the performance status of network tunnels.
- Actions – Provides options to view device-specific performance graphs.
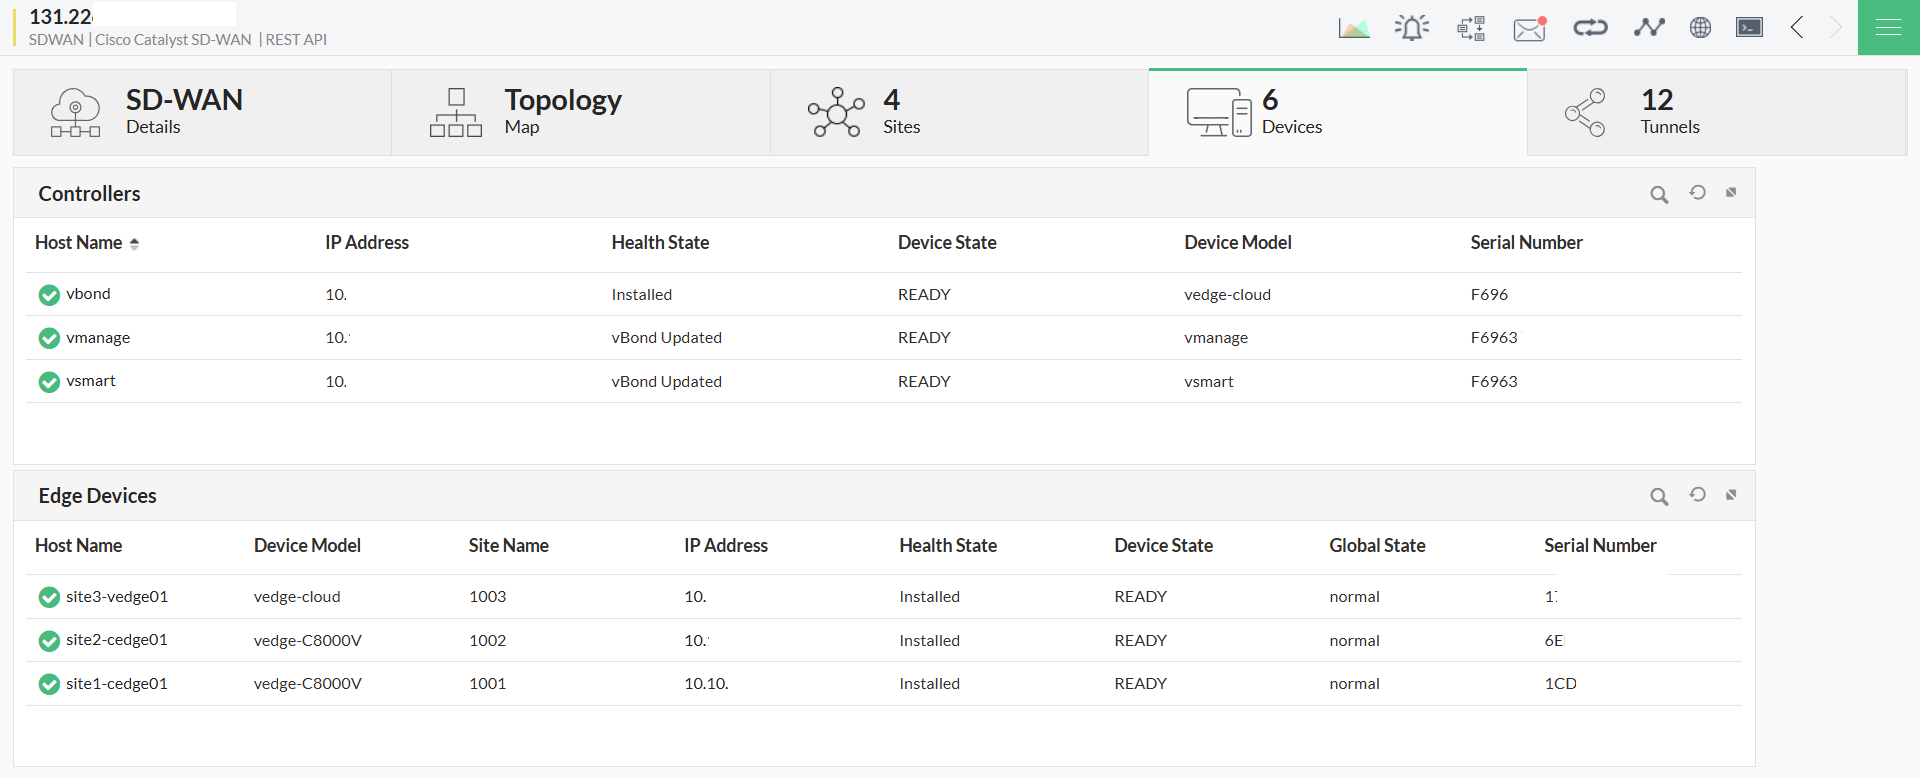
SD-WAN devices
You can find details about SD-WAN devices, including controllers and edge devices in the Devices tab. To access SD-WAN device details:
- Open the "Devices" tab from the SD-WAN snapshot page.
- The following key metrics common for Controllers and Edge Devices are displayed:
- Host Name – The name of the SD-WAN controller or edge device.
- IP Address – The unique network address assigned to the device.
- Health Status – Indicates whether the device is functioning normally or experiencing issues.
- Device State – Displays the current operational status (e.g., Active, Inactive, Down).
- Device Model – Specifies the hardware or software version of the SD-WAN device.
- Serial Number – A unique identifier assigned by the manufacturer.
- In addition to the above, the Edge devices section also contain,
- Site Name – Identifies the SD-WAN site to which the edge device belongs.
- Global State – Represents the overall status of the device within the SD-WAN network.
Managing SD-WAN tunnels
Tunnels are secure, virtual communication links between SD-WAN devices that ensure efficient data transmission by optimizing traffic flow across multiple network paths.
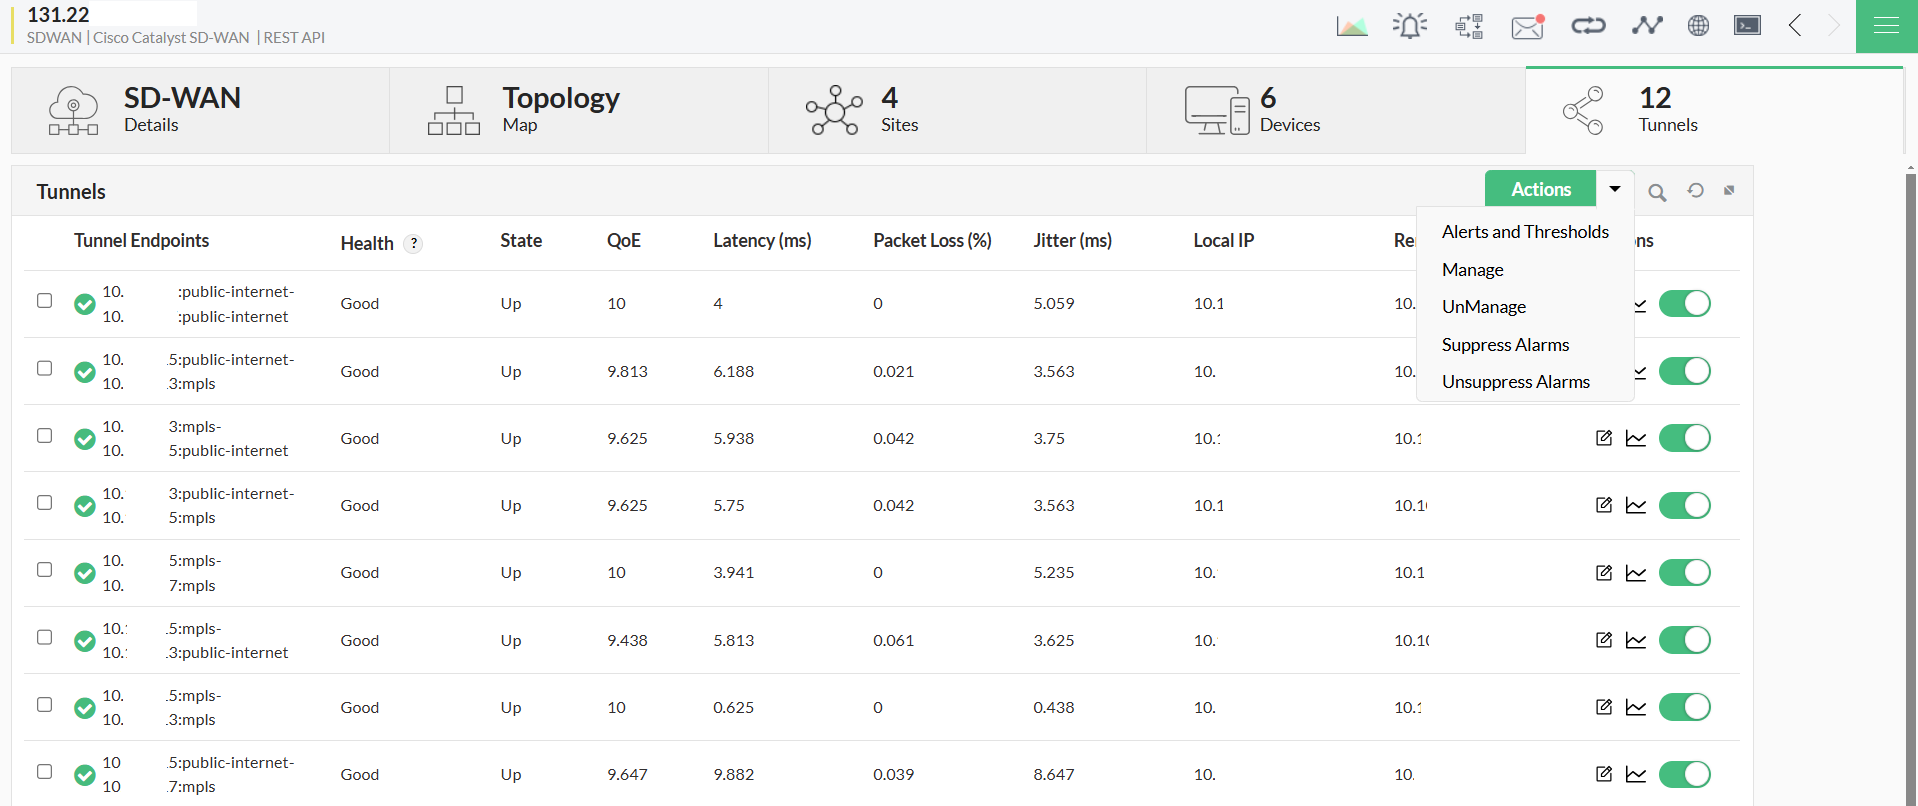
Manage tunnels
To manage tunnel performance, users can perform bulk actions via the Actions button in the top-right.
- Set performance thresholds and alert rules.
- Manage or unmanage tunnel endpoints in bulk.
- Suppress or unsuppress alarms in bulk.
- Edit thresholds and view tunnel-specific performance graphs.
To view tunnel performance:
- Open the "Tunnels" tab from the SD-WAN snapshot page.
- The Tunnels section provides key metrics, including:
- Tunnel Endpoints – Specifies the source and destination endpoints of the SD-WAN tunnel.
- Health Status – Reflects the operational state of the tunnel.
- State – Displays the current activity level (e.g., Active, Inactive, Degraded).
- Quality of Experience (QoE) – Measures overall performance based on network conditions.
- Latency (ms) – The time delay (in milliseconds) for data to travel across the tunnel.
- Packet Loss (%) – The percentage of data packets lost during transmission.
- Jitter (ms) – The variation in latency affecting data consistency.
- Local IP – The IP address of the tunnel’s local endpoint.
- Remote IP – The IP address of the tunnel’s remote endpoint.
Decommissioning SD-WAN devices
If an SD-WAN device reaches End of Life (EOL) or is no longer in use:
- The device can be marked as unmanaged in OpManager.
- A decommissioning alert will notify administrators of the status change.
ReDiscovering SD-WAN
Rediscovery is performed when there are significant changes to a device, such as hardware modifications, interface updates, or adjustments to its associated configuration. To redicover SD-WAN
- Go to the snapshot page, and click on the menu icon on the top right
- Click on ReDiscover device.
- Select an existing Credential, or add a new one and click ReDiscover Now.
- The SD-WAN device will be redicovered and added into OpManager
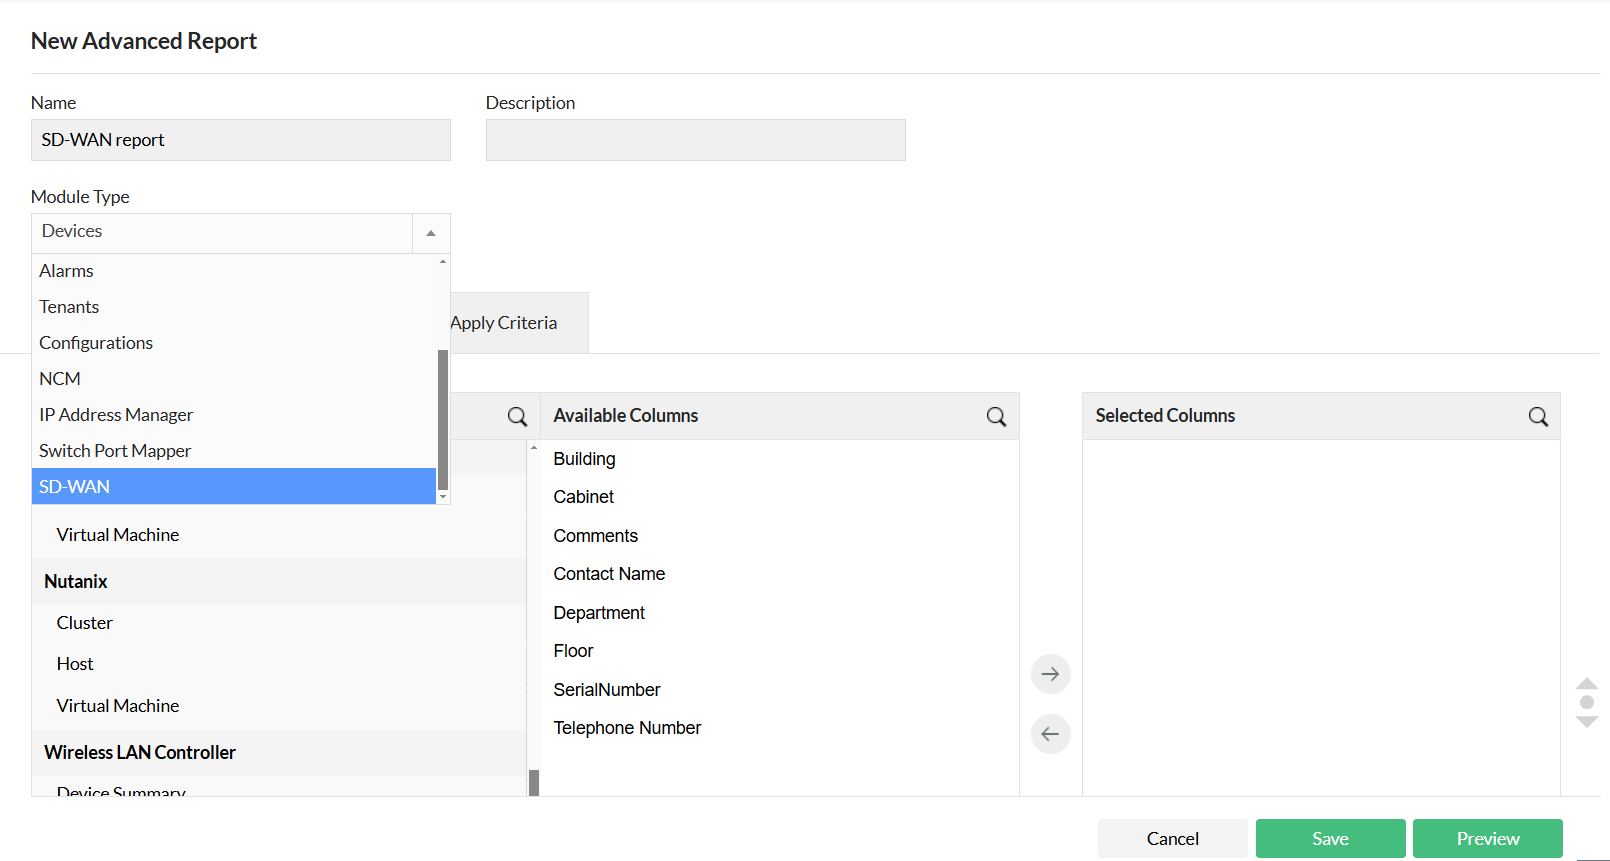
Generating advanced reports
OpManager’s Advanced Reports enable users to create customized reports by selecting specific performance monitors, applying criteria, and grouping data. To create an Advanced Report for SD-WAN:
- Go to Reports > OpManager > Advanced Reports.
- Click on the "Create New Report" button in the top-right corner. Select SD-WAN in the module type.Click here for detailed steps on creating an advanced report in OpManager.
Thank you for your feedback!