|
|||||||||||
Amazon Web Services Monitoring
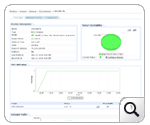
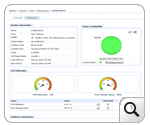
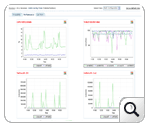
• Monitor availability, health and performance of Amazon EC2, RDS instances and attached EBS volumes. Metrics shown include CPU utilization, storage space, network traffic, network latency, disk reads/writes, etc.
• Plan capacity and make educated decisions about allocating cloud resources.
• Get a single console to monitor your physical, virtual and cloud environments.
|
|||||||||||
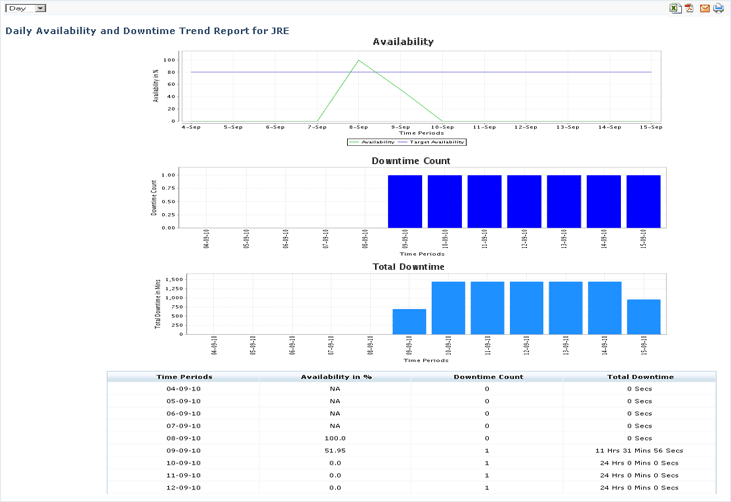
Availability Trend Report for Business Services
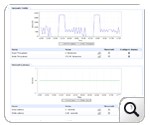
Get an overall idea of the availability and downtime trend of a monitor group. Charts available include the availability of the monitor group in percentage, the downtime count, and the total downtime of the monitor group for the specified time period.
 |
|
|||||||||||
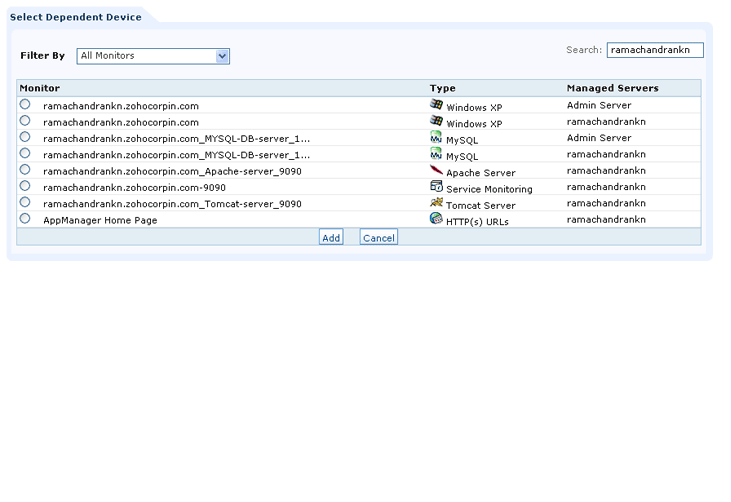
Associate Dependent Devices across Managed Servers
In the Enterprise Edition, you can now organize your monitors more effectively and reduce redundant checks by associating dependent devices across managed servers.
 |
|
|||||||||||
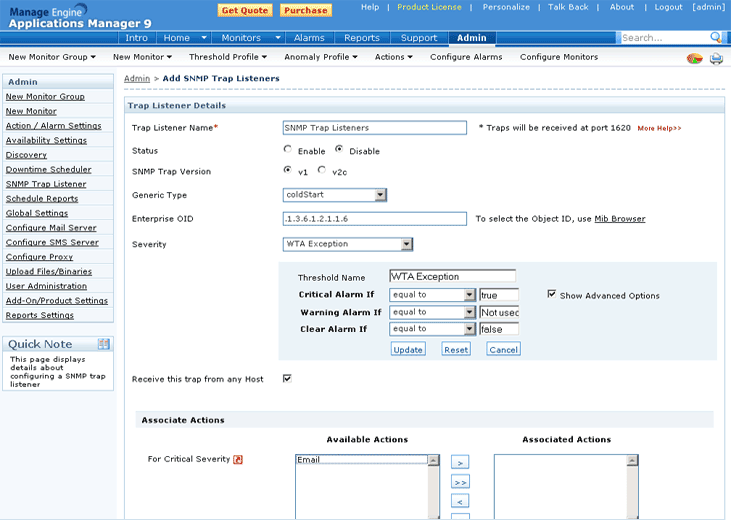
Set alarm severity during runtime
New enhancements to the SNMP trap listener feature including the ability to ability to detect trap severity at runtime based on content check of SNMP varbinds.
 |
|
|||||||||||
Other Enhancements
• Support for monitoring Exchange server 2010.
• Option to monitor WebSphere Application Server through secure SSL mode.

