|
|||||||||||
Support for monitoring Redis key-value store
Understand and optimize the usage of Redis and Redis-powered apps. Key performance metrics monitored include memory, connection statistics, keyspace, data size, replication, slow queries and persistence of Redis dataset.
|
|||||||||||
Support for monitoring Nginx Web Server
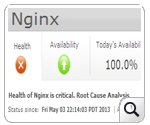
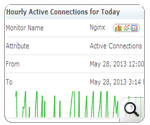
Monitor Nginx server availabilty and gain insight into performance of your Nginx server. Perform effective troubleshooting by monitoring key metrics like response time, requests served, active connections.
|
|||||||||||
Enhancements to Microsoft IIS Web Server Monitor
• Monitor health and availability status of different application pools in IIS server. Get notified when the status of the application pools becomes critical. Execute custom scripts to start an application pool when it stops or crashes.
• View details of .NET web transactions running on the IIS server. Metrics tracked include CLR performance, drill-down from URL to SQL queries, Apdex scores for user satisfaction, transaction trace details and database operations.
• Ensure health and availability of websites hosted on the IIS server by tracking key metrics such as availability, response time, bytes and files transferred per second, connection statistics, etc.
|
|||||||||||
Other Enhancements
• Now download all reports in Applications Manager as a pdf or csv file.
• Associate thresholds and actions with the attributes of a monitor type. This is an enhancement to the Global Alarm Configuration option.
• Option to Execute Actions both within and outside Business Hours.
• Option to send a single consolidated mail to multiple recipients with different Email actions but associated to the same attribute.
• Business Hours is now supported in Monitor Group's Availability Percentage Report.
• Option to export threshold and action in CSV format.
• Support to customize time and date in Webservices operation.
• Threshold and action template for Monitor type.

