Select the default authentication method for Firewall Analyzer from the dropdown list.
Use the respective Enable, Disable button to enable or disable the following settings.
Use this to allow alert notifications
Use this to add, remove widgets from default dashboard
Use this to remove help cards from the UI
Use this to query Firewall Analyzer database
Use this to show or hide product promotions
Use this to get notification for product assistance
Use this to permit operator user to create custom dashboard
Use this to allow chat support in the product
Use this to allow product recommendation from ManageEngine
Click Save button to save the settings.
Enabling logging for a longer duration degrades application performance. To avoid this, disable logging when debugging is done
Use the slide button to enable CLI logging. Choose logging duration as 1 day, 7 days, 30 days from the dropdown list.
Use the slide button to enable Debug Prints. Choose Debug Print duration as 1 day, 7 days, 30 days from the dropdown list.
Click Save button to save the settings.
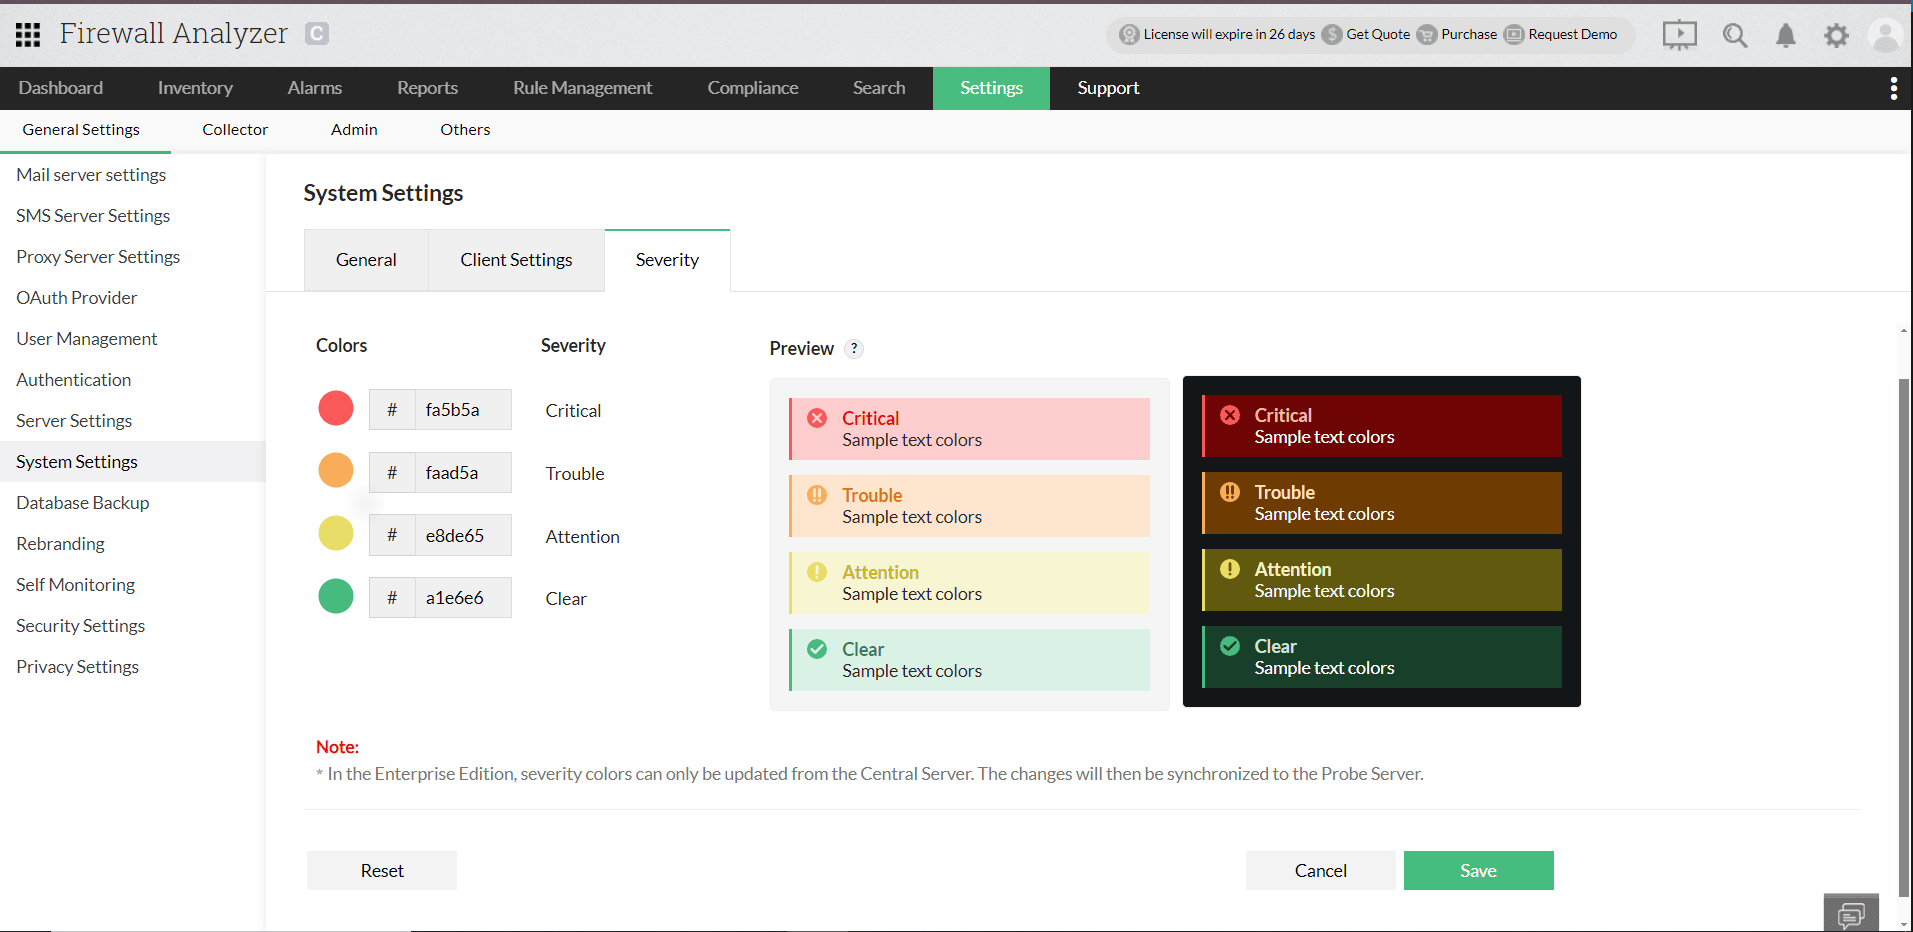
From version 12.8.346 onwards, Firewall Analyzer allows you to customize the colors corresponding to the severity of the events. The colors can be customized for the following Alarm Severities: Critical, Trouble, Attention, and Clear.

Thank you for your feedback!