Discover :
- The time saved by each technician.
- Total Savings.
- Proper Resource Allocation.
Select Your Currency :
Your Business
1. Number of Clients managed
2. Total number of Assets Managed (Total count across multiple clients)
3. Total number of technicians/agents in your Help Desk
Your Help Desk
1. Total number of tickets incoming per day
2. Total number of phone calls incoming per day
3. Average number of tickets closed per day
4. Average time taken to resolve an incident (Normal priority in hours)
Result
1. Total number of tickets per month :
2. Total number of tickets resolved per month:
3. Amount spent on technicians to run the help desk per month :
4. Total number of tickets resolved by each technician per month:
5. Average time spent on a ticket by each technician in hours :
See how you can improve your Help Desk´s performanceKnow how?
Your Savings
| Features | Benefits | Savings |
|---|---|---|
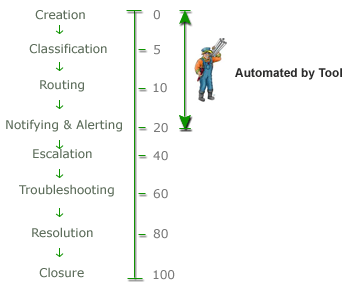
1. Ticket Life Cycle | Save 20% of Technician's productivity by automating : Approximately 20% of technician's productivity is spent on (Routing,Classifying, Notifying,Escalating etc)which can be automated by tool. | $ |
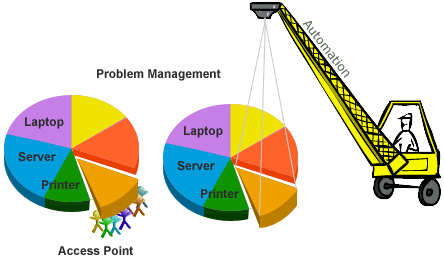
2. ITSM Automation | Save 10% by ITSM Automation ($) : Based on the analysis on more than 10000 customer base of ServiceDesk Plus, every help desk tends to fall while handling repetitive incidents or same incidents that occur multiple times with different technicians. Here is a typical dashboard with tickets resolved per week based on category. There are more than 25 tickets that fall under a single category and they can be considered as a single problem, thereby saving resource and time spent on large volume of tickets. | $ |