Resource Inventory Report
CloudSpend's Resource Inventory Report provides a detailed overview and analysis of all cloud resources being used within an organization’s cloud environment. This report is crucial for cost management, resource optimization, and ensuring effective governance of cloud resources.
The Resource Inventory report is currently available for billed resources of the respective cost account. Resources with zero charges will not be captured in this report.
Why the Resource Inventory Report?
The Resource Inventory Report generates an up-to-date inventory containing all cloud resources from all accounts and across all providers and enables you to identify unused or costly resources. Here are some of the key benefits of CloudSpend's Resource Inventory Report:
- Get a detailed cost breakdown across three key categories: accounts, services, and regions.
- Identify cost drivers with resource-level cost insights
- Obtain a comprehensive inventory report to identify unused or underutilized resources, enabling you to optimize your cloud spend by eliminating unnecessary costs.
- Get a detailed overview of your cloud infrastructure, facilitating better resource allocation and planning for future needs.
- Gain critical insights about all your resources, enhancing visibility into the cloud infrastructure. Ensures transparency in resource utilization and costs, making it easier to justify cloud spending.
Interpreting the Resource Inventory Report
The Resource Inventory Report provides a complete view of your cloud resources and enables you to achieve greater control over your cloud spending.
Follow the steps below to view the Resource Inventory Report:
- Log in to CloudSpend and go to Reports.
- Select Resource Inventory.
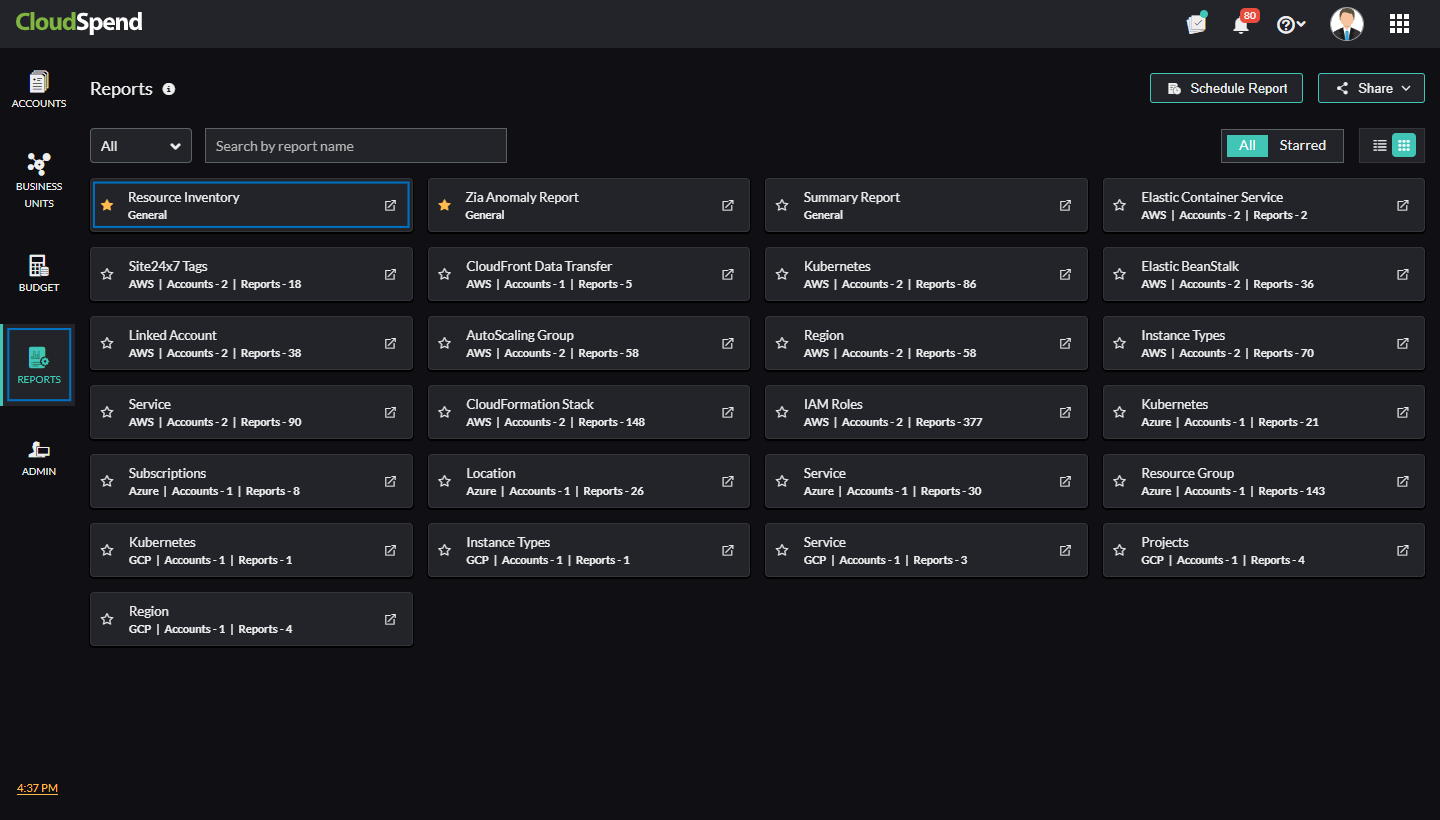
Resource Inventory
In the Resource Inventory page, you can filter the resources based on the cost account, specify a tag to filter, select the required Accounts/Subscriptions/Projects, and also set a custom date range. You can also view the following details for different cost accounts in a tabular or pie chart format:
- Trend: View the overall resource trend for the selected cost accounts and their linked accounts. You can view the total number of resources used for a selected date range. If you select a date range within 30 days, resources used per day will be displayed.
- Accounts/Subscriptions/ Projects: View the top 10 Accounts (AWS)/Subscriptions(Azure)/Projects(GCP) based on the cloud type. You can view the total number of resources and its usage for the selected cost account.
This field will be displayed as Accounts for AWS cost accounts, Subscriptions for Azure cost accounts, and Projects for GCP cost accounts.
- Regions/Locations: View the top 10 regions or locations used by the highest number of resources.
For AWS and GCP cloud type this field will be displayed as Regions and for Azure cloud type, it will be displayed as Locations.
- Services: Provides a breakdown of total resources by service. Additionally, you can view the top 10 services with resource utilization details (count and usage).
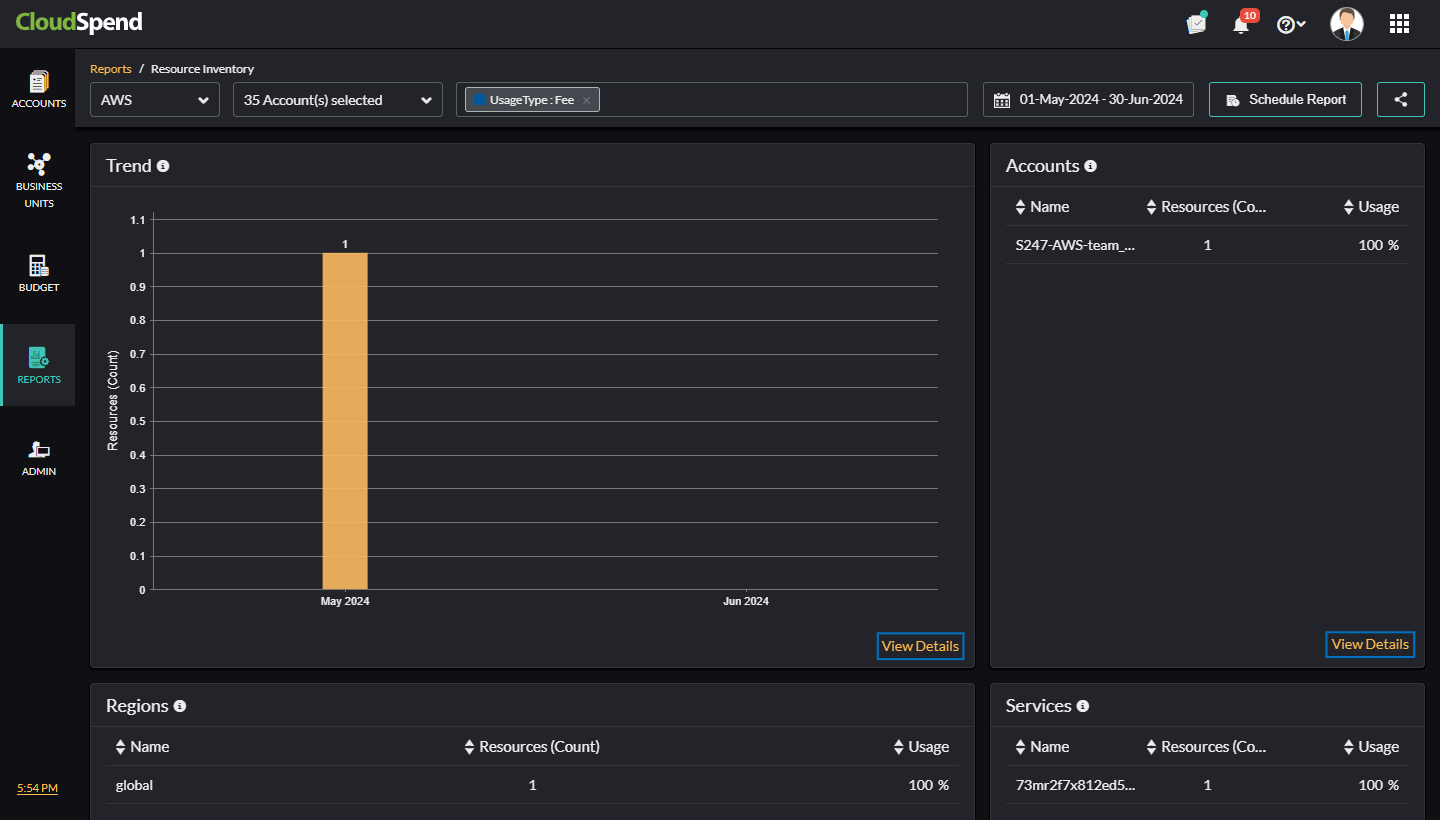
If you click View Details in each section, the Resources page will be displayed with details such as Resource Name, Location, Service, and Resource Group.
Resources
In the Resources page, view the grouped data for Trend, Accounts/Subscriptions/ Projects, Regions/Locations, and Services based on the selected widget. To schedule a report, click Schedule Report. To share the report with your team, click Share to share it in CSV format.
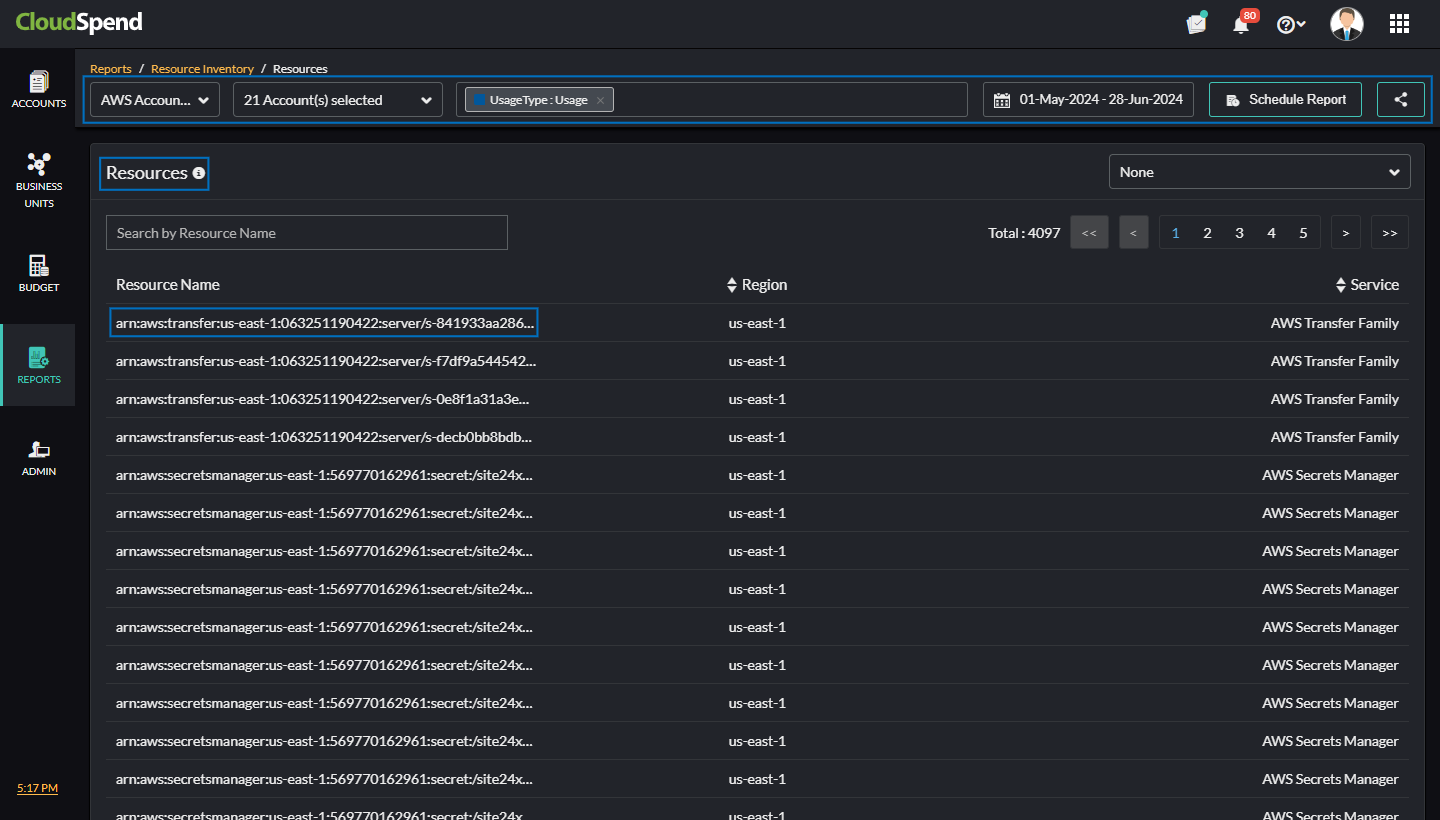
Click the applicable resource name to get critical insights about the respective resource and view the following details:
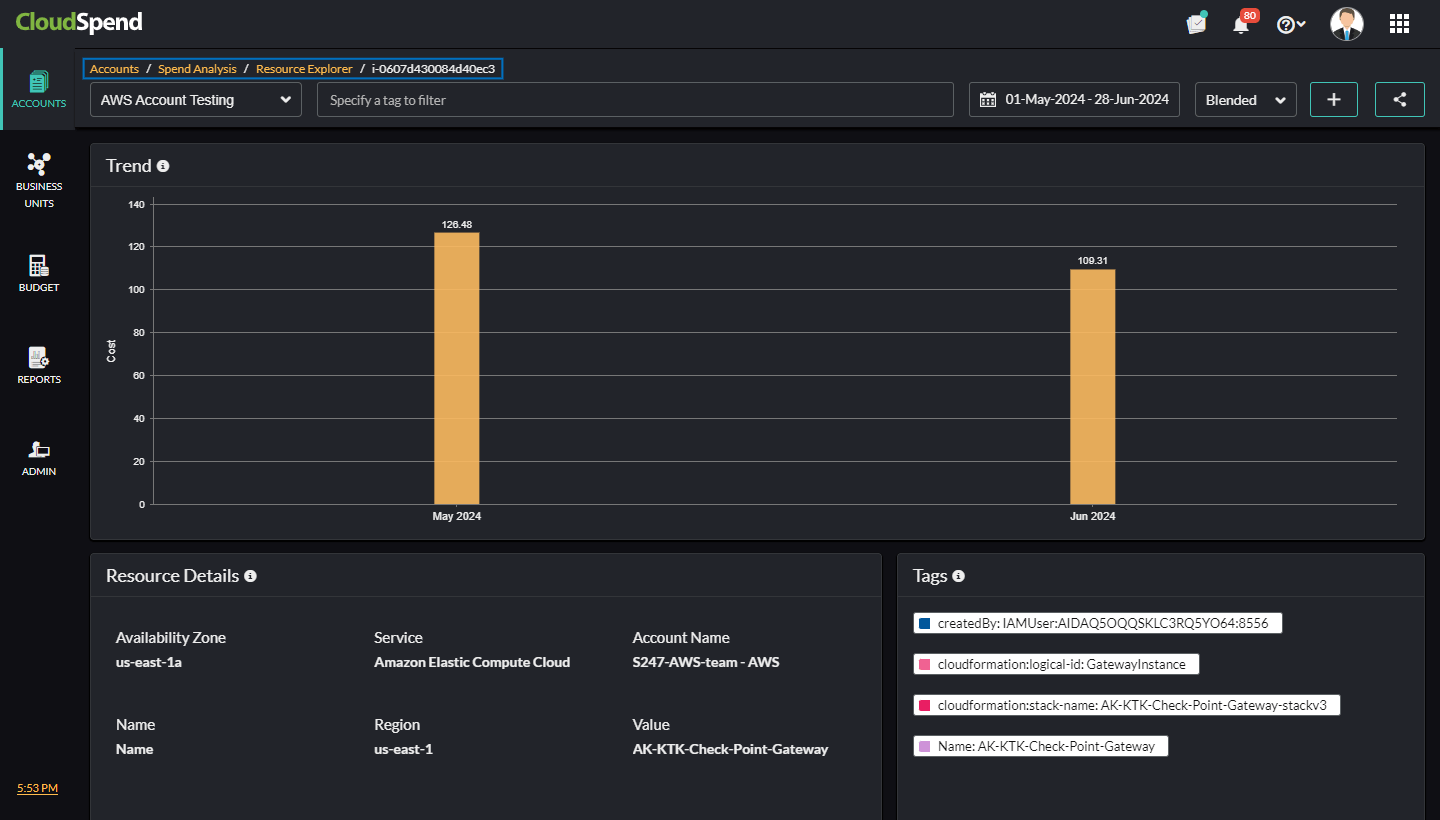
- Trend: View the overall resource trend for the selected cloud type. The Trend chart displays the cost accrued for the resources for a particular period.
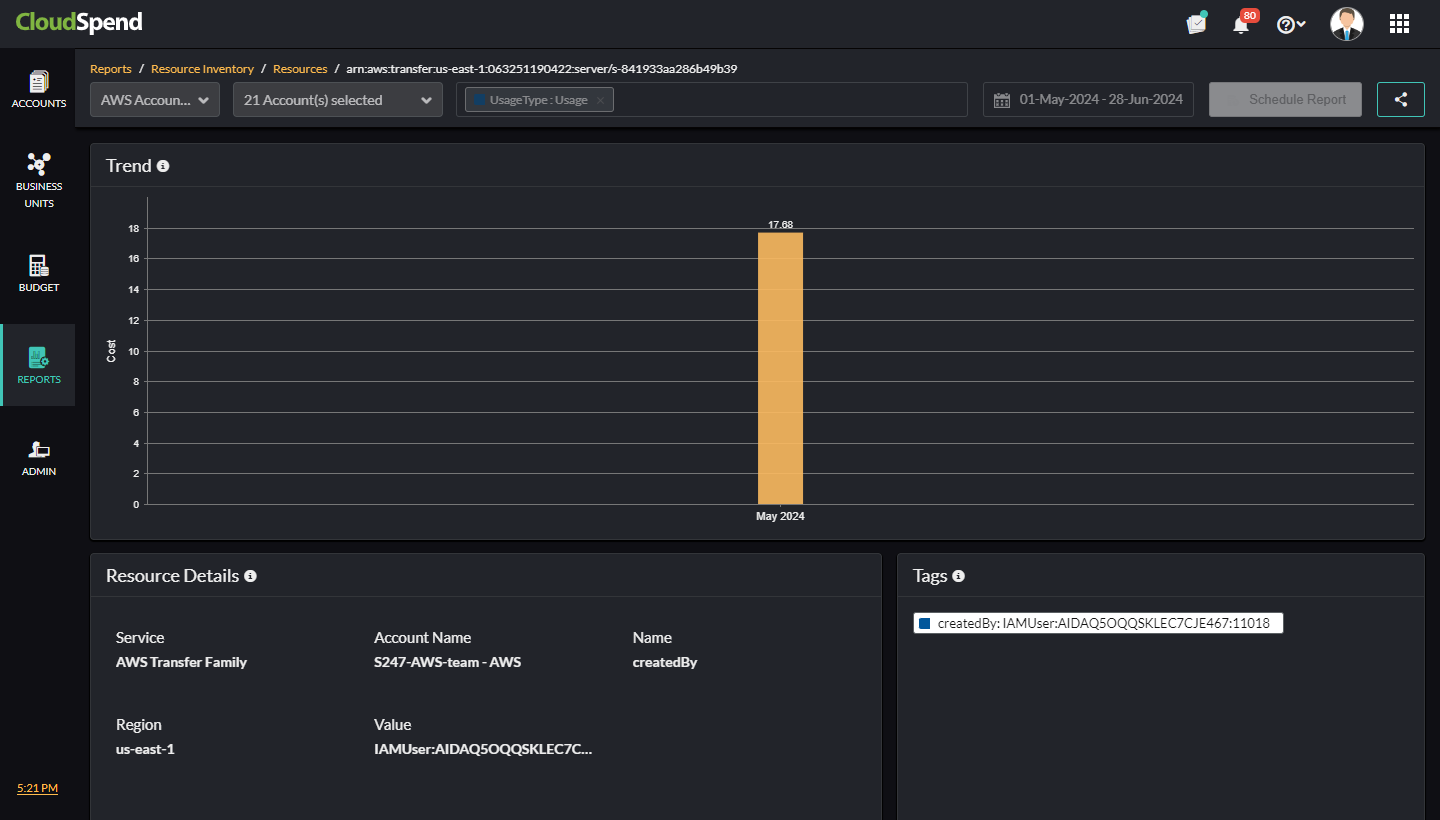
- Resource Details: Obtain the resource details such as Account Name, Service, and Region. It also displays resource details specific to each cost account.
- Tags: Displays the tags configured for the selected resource.
- Operations: This widget is available only for AWS cloud. It provides you with resource-level operation details. For example, a value of RunInstances indicates the operation of an Amazon EC2 instance. This tag will be displayed in the Operations widget for the selected resource.
- Data Transfer: You can obtain the cost details associated with data transfer activities within your AWS environment. This widget helps you monitor and manage the expenses related to data movement between different AWS services and regions.
Suppose you have multiple AWS services interacting with each other, such as EC2 instances in different regions, S3 storage, and RDS databases. The Data Transfer widget allows you to track and visualize the costs incurred from data being transferred across these services and regions.
By using this widget, you can identify high data transfer costs, analyze patterns, and optimize your data transfer strategies to reduce expenses. For instance, you might discover that transferring data between specific regions is significantly more expensive and decide to adjust your architecture or data flow to minimize these costs.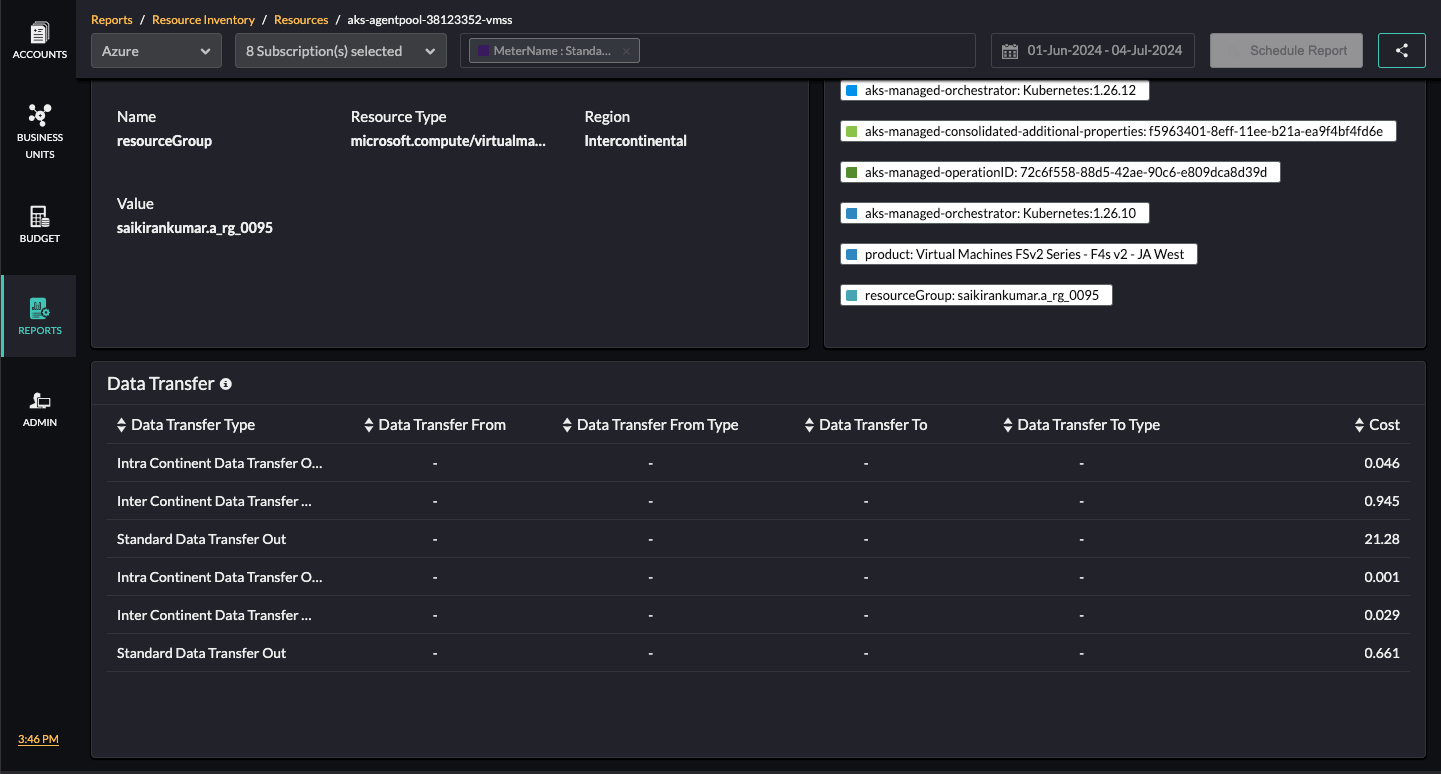
You can also view the above resource details from the AccountSpend AnalysisResource Explorer as well.
Related Topics