Savings Report
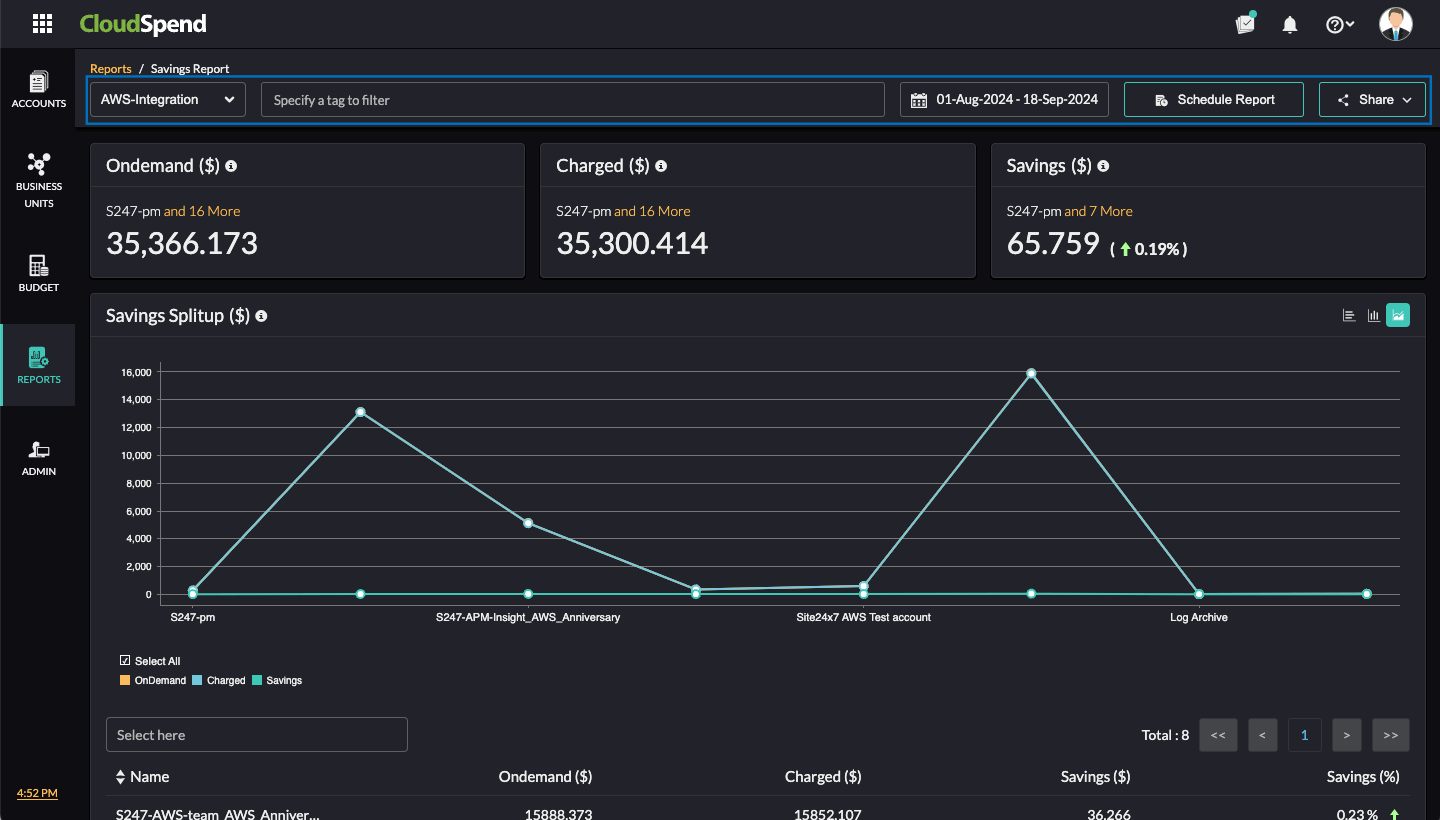
The Savings Report in CloudSpend provides an in-depth view of your cloud savings across AWS, Azure, and GCP accounts. It breaks down your cloud costs as:
- On Demand: The cost of running resources without any discount.
- Charged: The actual amount charged after applying savings mechanisms such as Reserved Instances or Savings Plans, Committed Use Discounts, and Credits.
- Savings: The difference between the on-demand and charged costs.
You can track and manage your cloud expenses effectively by identifying savings opportunities and cost optimization strategies with the Savings Report.
Why use the Savings Report?
See how the Savings Report can transform your cloud spend strategy:
- Gain a comprehensive view of savings across AWS, Azure, and GCP accounts in a single dashboard.
- Understand how much you saved through Reserved Instances, Savings Plans, and other cost-saving measures, helping you fine-tune your cloud strategies.
- By tracking savings, you can better forecast cloud spending and optimize your cloud budgets.
- Easily compare on-demand costs with charged costs to see the impact of savings strategies.
- Obtain insights that support strategic decisions on resource management and additional savings plans purchases.
Interpreting the Savings Report
The Savings Report provides data-driven decisions to improve cost efficiency across your multi-cloud environment. Follow the steps below to view the report:
- Log in to CloudSpend and navigate to Reports.
- Select Savings Report.
- On the Savings Report page, select the applicable cloud service.

- Choose the desired date range to view the cost details. You can also filter the accounts based on tags.
- To schedule a report, click Schedule Report. You can schedule a report to be generated as a CSV or PDF. To share the report with your team immediately as a PDF, click Share.
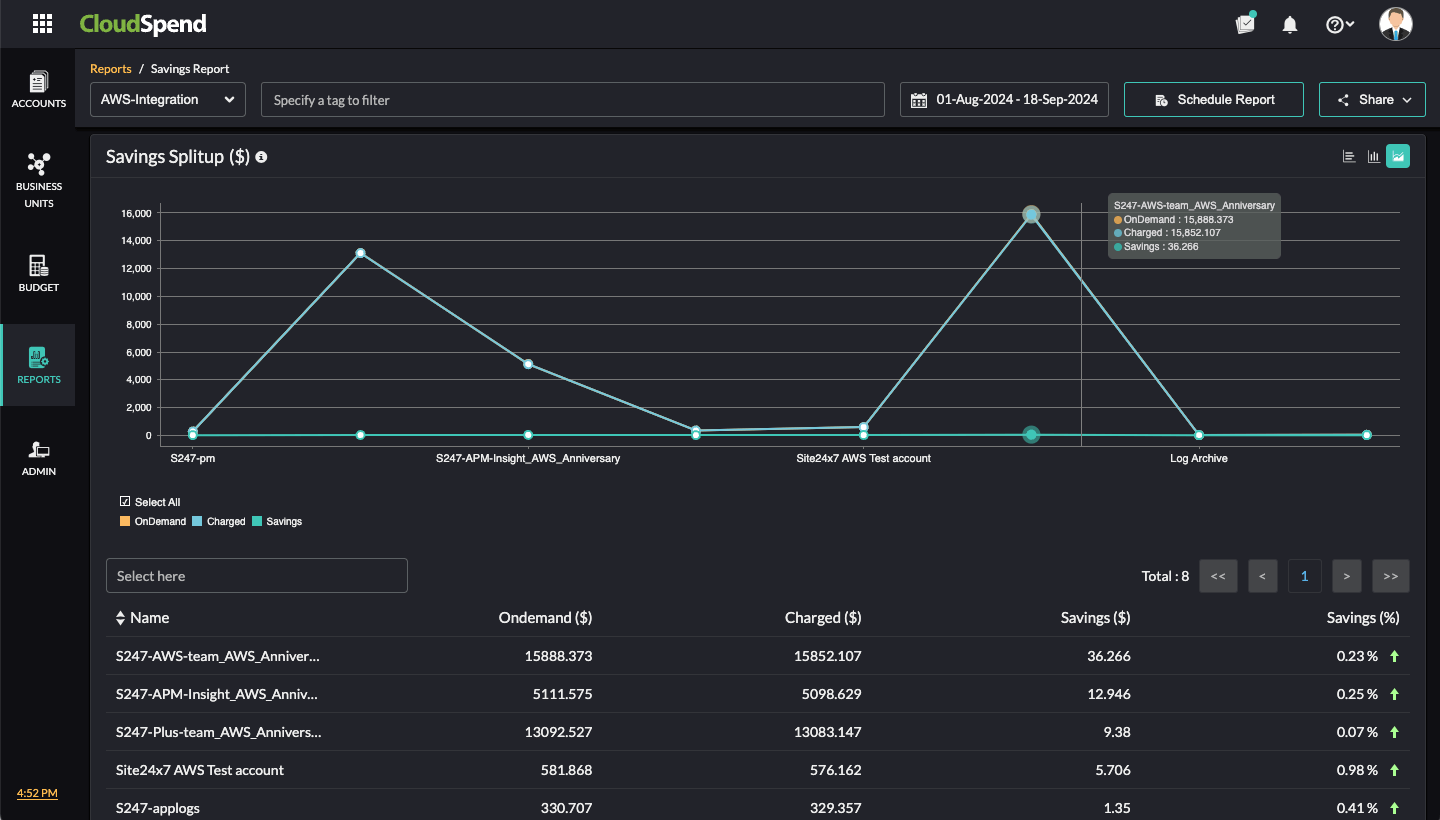
Savings Splitup
Visualize your savings breakdown with the Savings Splitup chart. Choose from horizontal, vertical, or aerial charts to analyze on-demand, charged, and saved costs.

You can also view account-level savings details for each account below the graphs, which includes the account Name, On Demand ($) cost, Charged ($) cost, Savings ($) amount, and Savings (%) percentage.