Network infrastructures seem to be getting more complex and advanced by the day, forcing network admins to cast off traditional management approaches. Application-aware network performance management, a newer, holistic approach to monitoring network performance, offers admins powerful management capabilities over their IT resources. Application-aware network performance management showers IT admins with benefits like granular views, dynamic resource allocation, proactive fault management, tightened network security, performance bench-marking, optimized user experience, and the list goes on. In this white paper, we'll explore the key capabilities and benefits of an application-aware performance management solution.
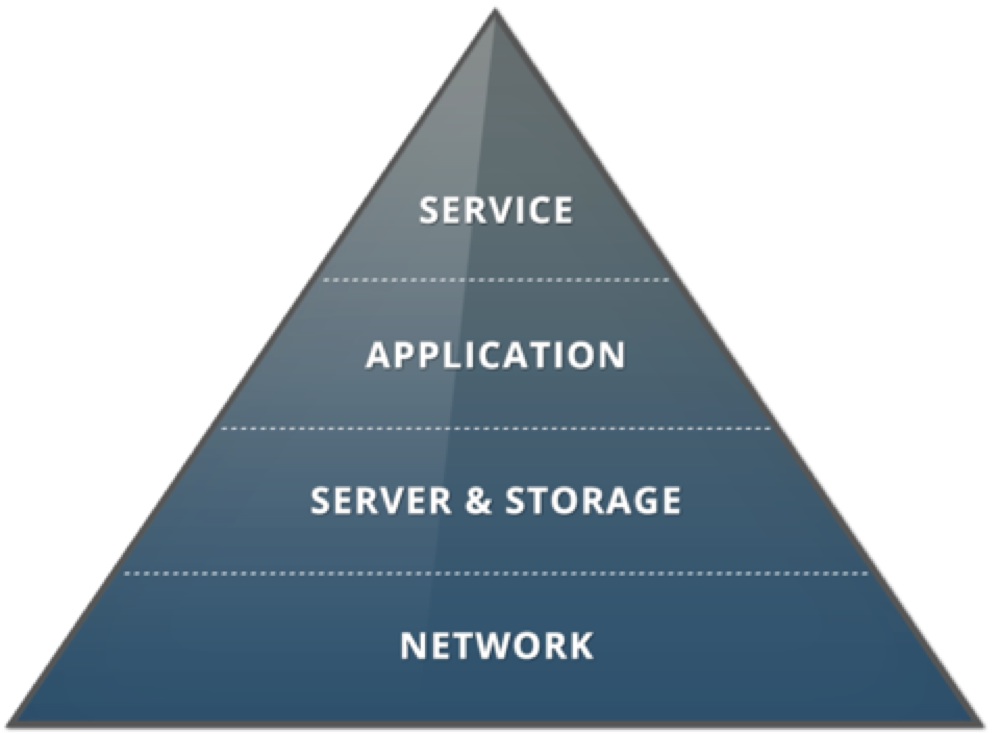
Conventional practices are no fit for today's businesses that are driven by cloud technology and datacenters. Now, IT is more dynamic and provisioned quickly with technologies such as virtualization and elastic computing. The reach of networks extends beyond office boundaries. With more and more applications being served in the cloud from all around the world, it is imperative for businesses to ensure seamless access to mission-critical applications and provide a good end-user experience. This is why networks and applications can no longer be managed as disparate entities. The problem with a traditional IT model is it keeps all the performance data and events separate, leaving an admin to manually correlate them to get a clear picture of overall network performance. This leads to slower troubleshooting. By the time a fault is traced and fixed, users have already started to receive 404 errors.

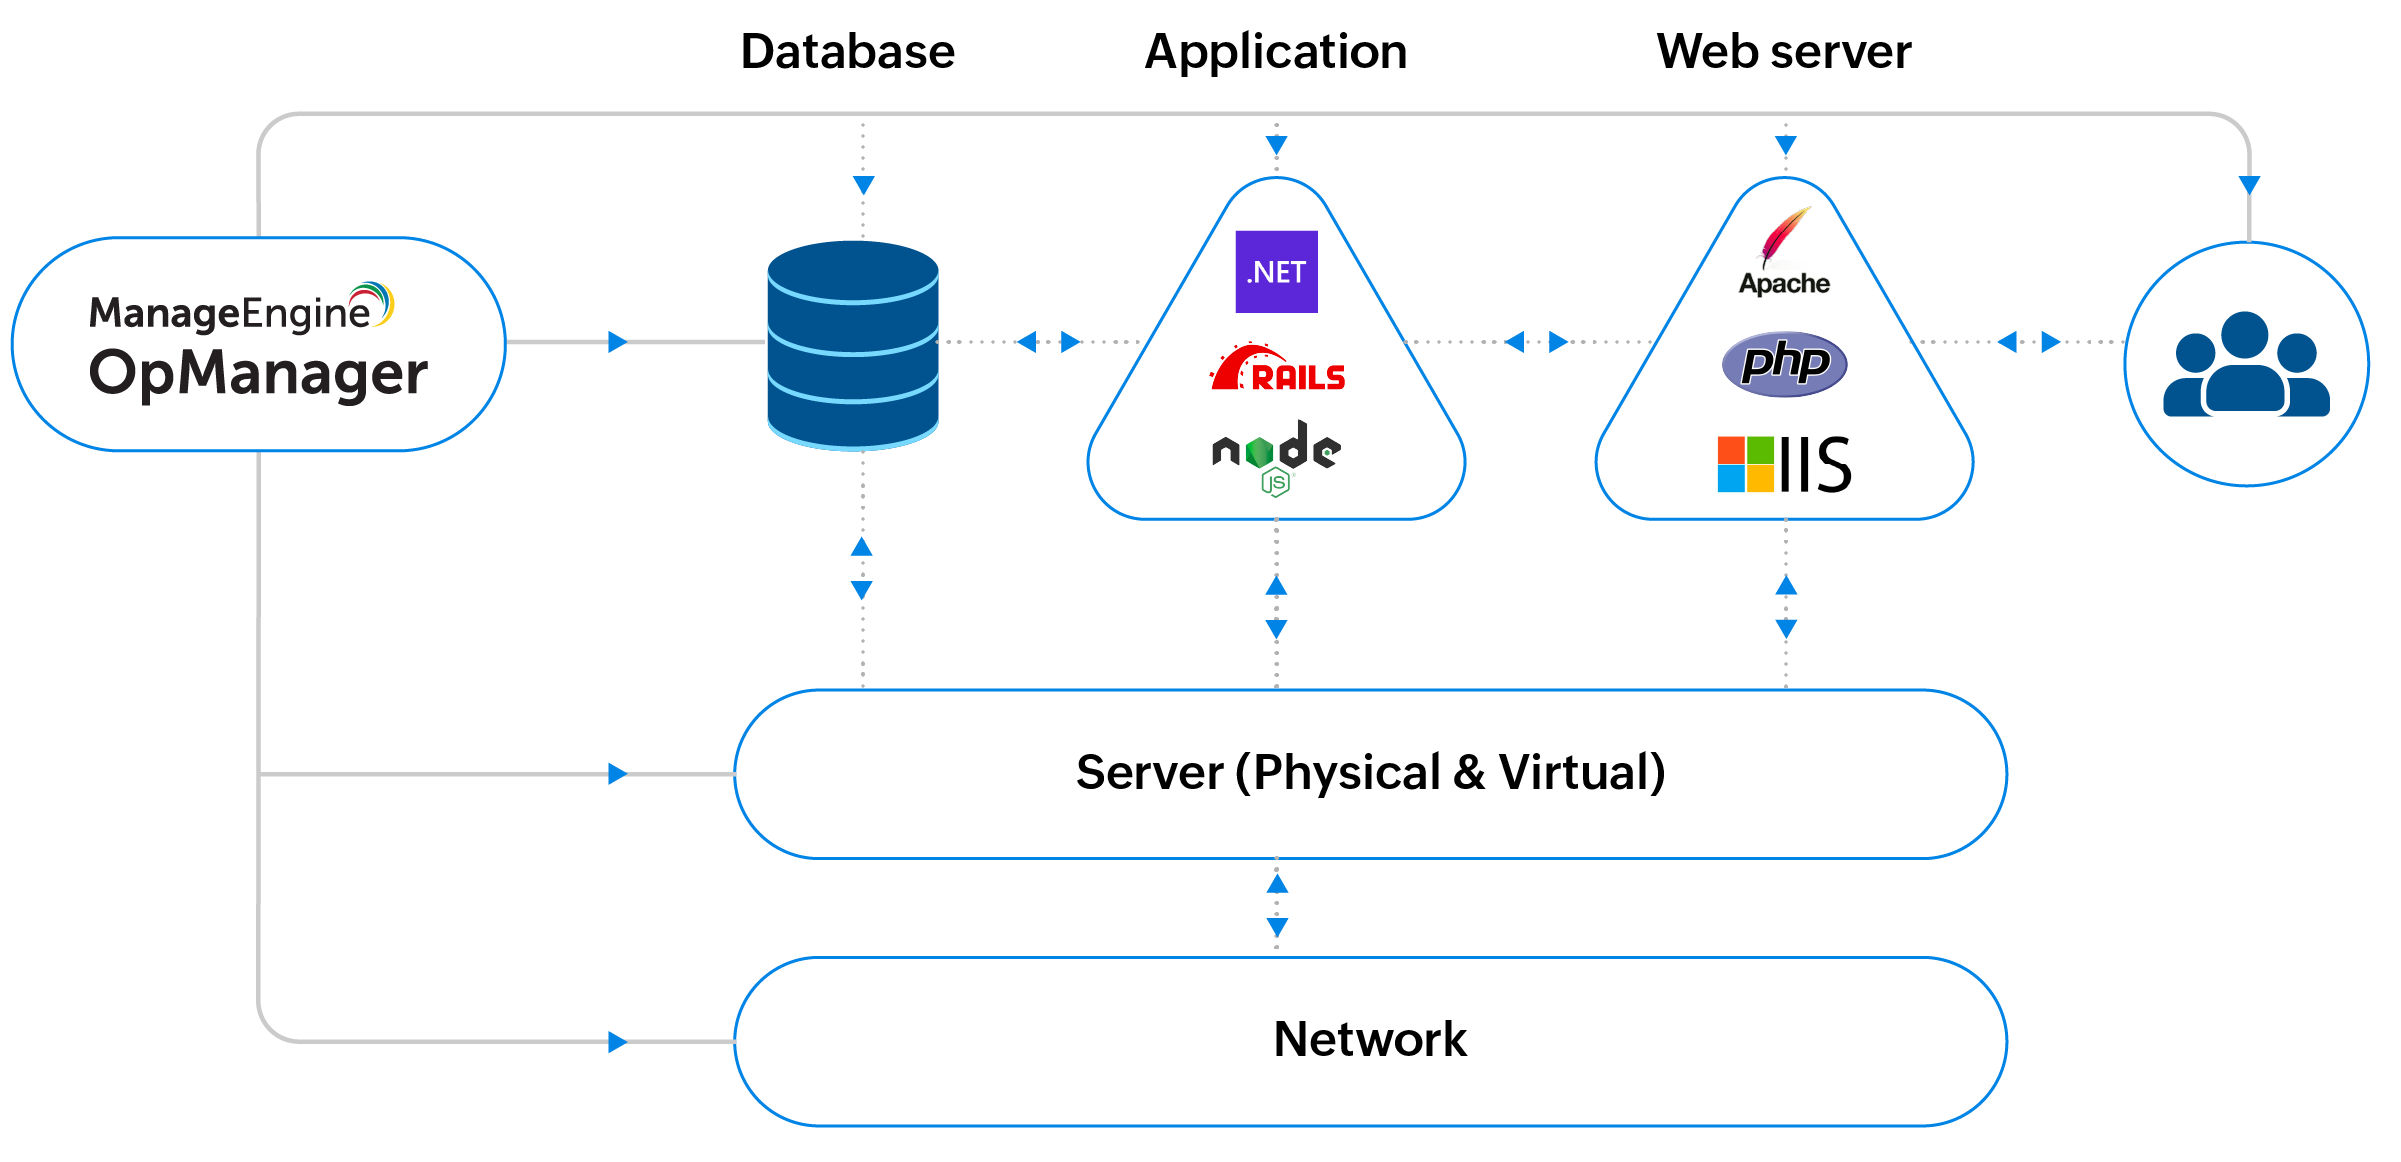
OpManager has expanded its scope by integrating comprehensive application monitoring capabilities that let admins conduct application-aware network performance management. This feature enables the monitoring of crucial applications, such as .Net, Ruby on rails, node.js, and more, in addition to overseeing networks and servers, all through a unified interface. Whenever an application experiences reduced speed or a loss of accessibility, OpManager provides the necessary insight into the network, server, and application layers. This allows for a seamless transition from the end-user experience perspective to the network perspective, facilitating swift and effortless root cause analysis of any issue. 
The application performance management (APM) plugin in OpManager provides:
OpManager's APM Plugin empowers network administrators to monitor a range of applications and infrastructure components effortlessly and continuously, encompassing application servers, databases, websites, cloud resources, containers, and more. This serves to provide useful data about both network and application layers present in your network infrastructure, sparing your team from wasting time navigating between tools or screens in order to gather and correlate information. With OpManager's APM Plugin, you can discover applications in the network infrastructure and map their dependencies automatically.
Oversee critical metrics of application performance such as response times, transaction rates, error rates, and more in your network infrastructure to spot and mend performance issues promptly. Keep track of the health of databases, plus monitor application servers, web servers, and web services 24/7 to ward off anomalies. Gain visibility into websites and their critical metrics, and improve security. This plugin also offers cloud and container monitoring for complete management of your entire IT infrastructure.
OpManager's APM Plugin will send instant alarms when an anomaly is detected indicating the severity of the alert so technicians or admins can prioritize them accordingly. Alarms can be sent through any preferred channels: SMS, email, Slack, etc. You can correlate the alarms received, understand if it is a network or application issue, and get to the root cause—all in just a few seconds.
The built-in reports offer a way to delve into the details, helping you to comprehend and optimize your networks for enhanced performance and a seamless user experience. Additionally, historical data on application performance helps you analyze trends, fluctuations in performance, and more to enable data-driven decision-making.
ManageEngine OpManager is a network management platform that helps large enterprises, service providers and SMEs manage their data centers and IT infrastructure efficiently and cost effectively. Automated workflows, intelligent alerting engines, configurable discovery rules, and extendable templates enable IT teams to quickly setup a 24x7 monitoring system within hours of installation. Do-it-yourself plug-ins extend the scope of management to include network change and configuration management and IP address management as well as monitoring of networks, applications, databases, virtualization and NetFlow-based bandwidth. For more information on ManageEngine OpManager, please visit https://www.manageengine.com/network-monitoring/
To download a free 30-day trial, visit: https://www.manageengine.com/network-monitoring/download.html