Viewing Interface Reports

Interface reports help you to determine the health of the interface by generating detailed reports on In and Out Traffic, In and Out Errors and Discards, Bandwidth & Outage Report, At-a-Glance Report etc. The reports can be exported to PDF format, taken printouts or emailed by clicking the respective icons. To generate the interface reports, follow the steps given below:
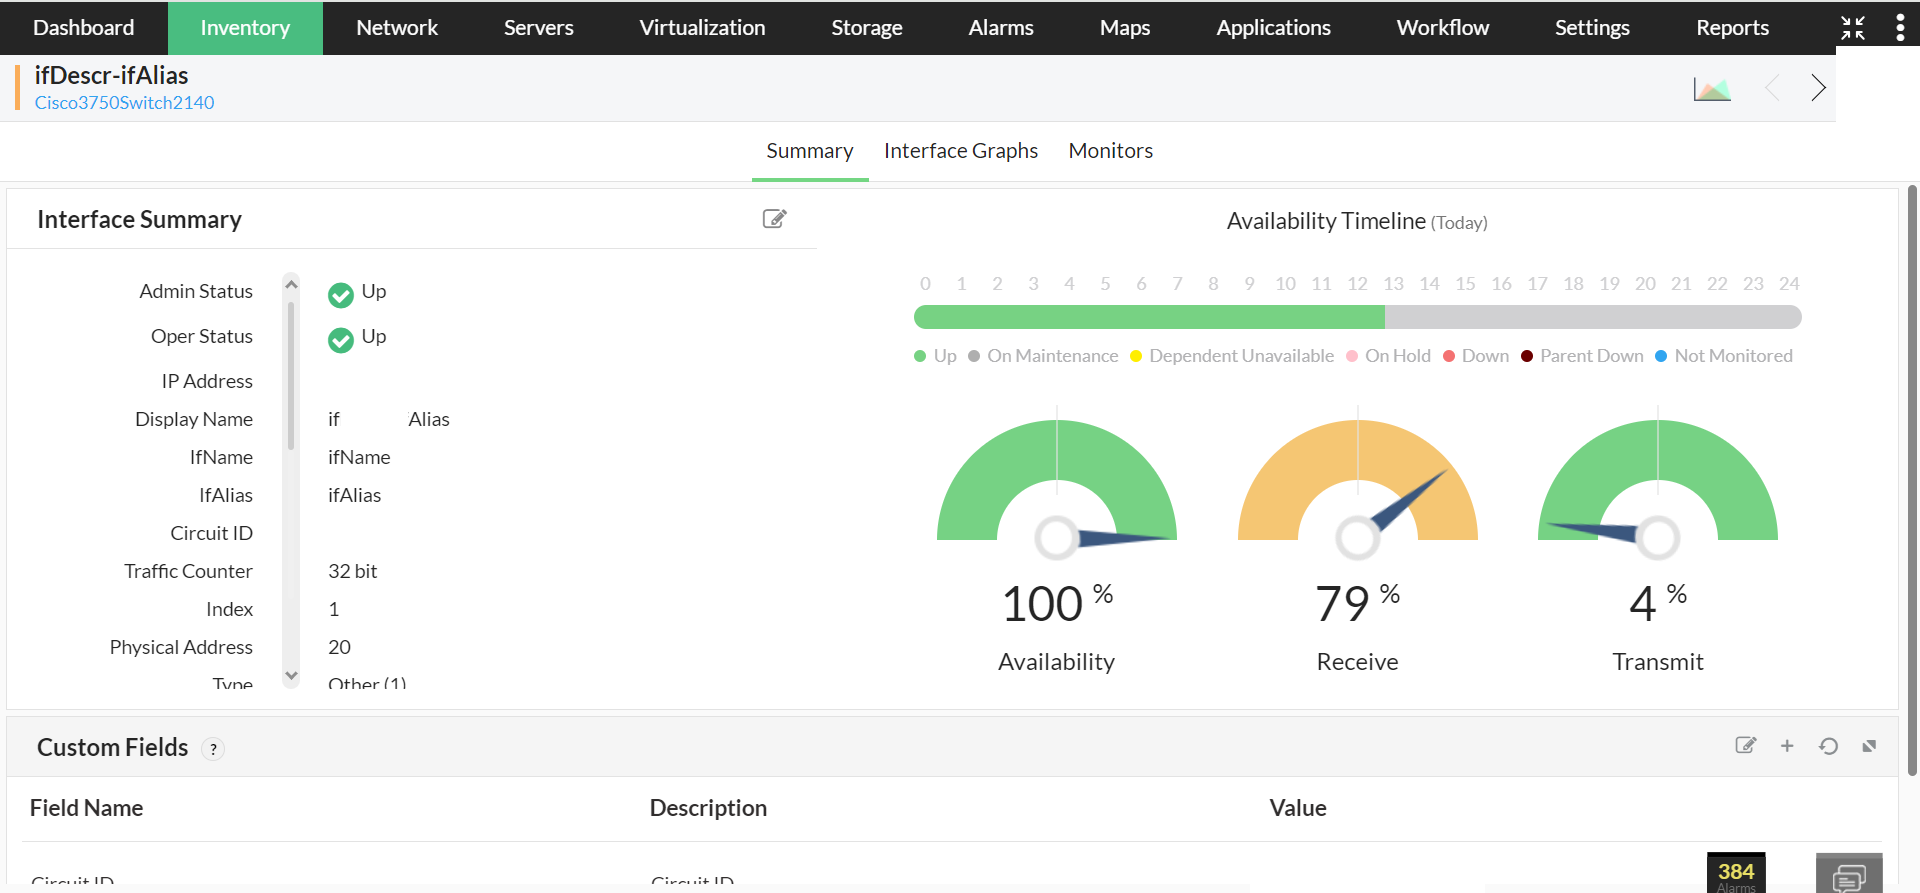
  1. Navigate to Inventory>Interfaces and click on the interface whose health report you want to view.
  2. Interface reports
  3. On the top right corner, click on the more icon represented by three horizontal lines.
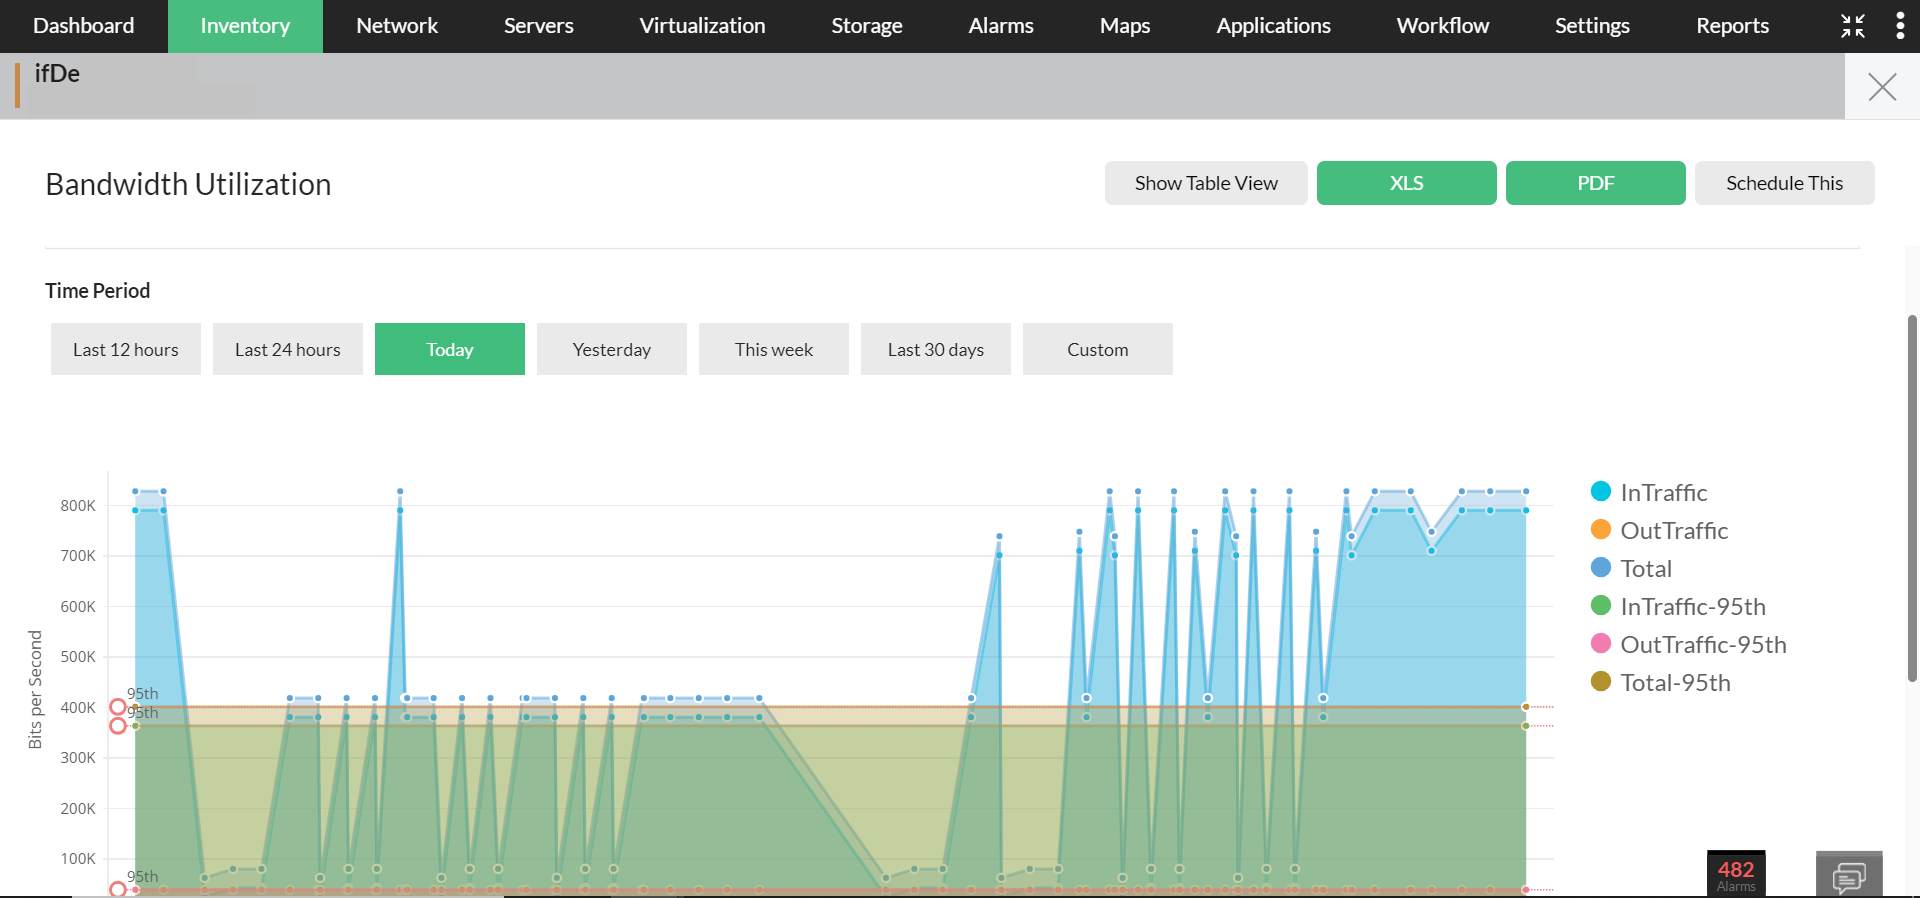
  4. Choose the report that you want to view.
  5. Click on the preferred time window for which you want to view the report. The default Time Window available in OpManager are follows: Interface reports
    • Last 12 hours
    • Last 24 hours
    • Today
    • Yesterday
    • This week 
    • Last 30 days
    • Custom

Note: The reports can be exported in XLS or PDF format. It can also be scheduled for report generation.

Thank you for your feedback!

Was this content helpful?

We are sorry. Help us improve this page.

How can we improve this page?
Do you need assistance with this topic?
By clicking "Submit", you agree to processing of personal data according to the Privacy Policy.