APM Insight .NET Agent - Custom Instrumentation Manager Tool
APM Insight .NET Agent Custom Instrumentation Manager is a configuration tool specifically designed for custom instrumentation released as part of the .NET agent version 2.5.4 and above. It helps in configuring a web application's methods (framework methods as well as user defined ones) for instrumentation in just a few clicks.
It is designed to:
- Give you visibility into your own application DLLs by showing the necessary classes and its methods.
- Help you configure custom instrumentation methods like adding or removing methods and renaming component for each method.
- Recycle running application pools for custom instrumentation to take effect.
Installing Custom Instrumentation Manager tool
Custom Instrumentation Manager is bundled with .NET Agent MSI and will be installed along with the agent.
- For details on downloading and installing the agent, check out the installation instructions.
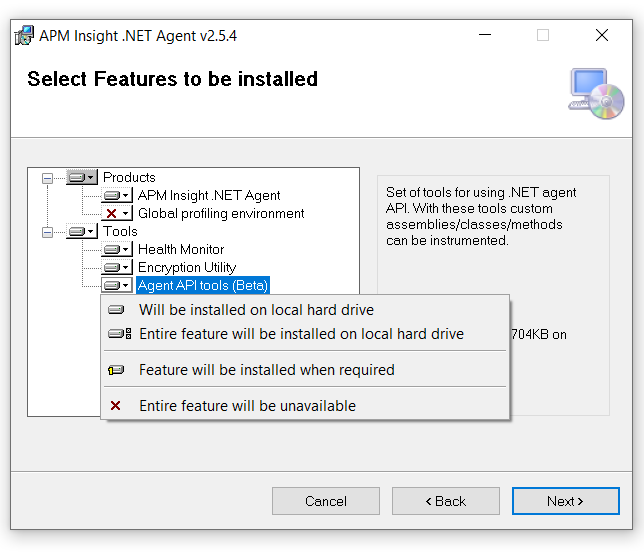
- In the feature selection page, ensure that Custom Instrumentation feature is selected for installation.

Working with Custom Instrumentation Manager Tool
- From the Windows Start menu or Start screen (Windows 8/Windows Server 2012), launch the Custom Instrumentation Manager tool.
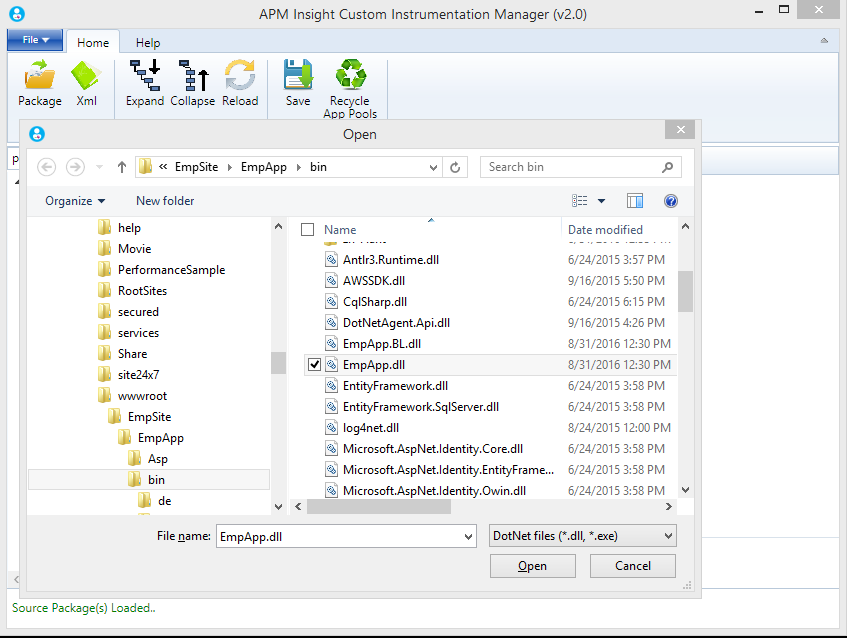
- Load an application DLL from the bin directory of a web application. The below image shows loading a DLL.

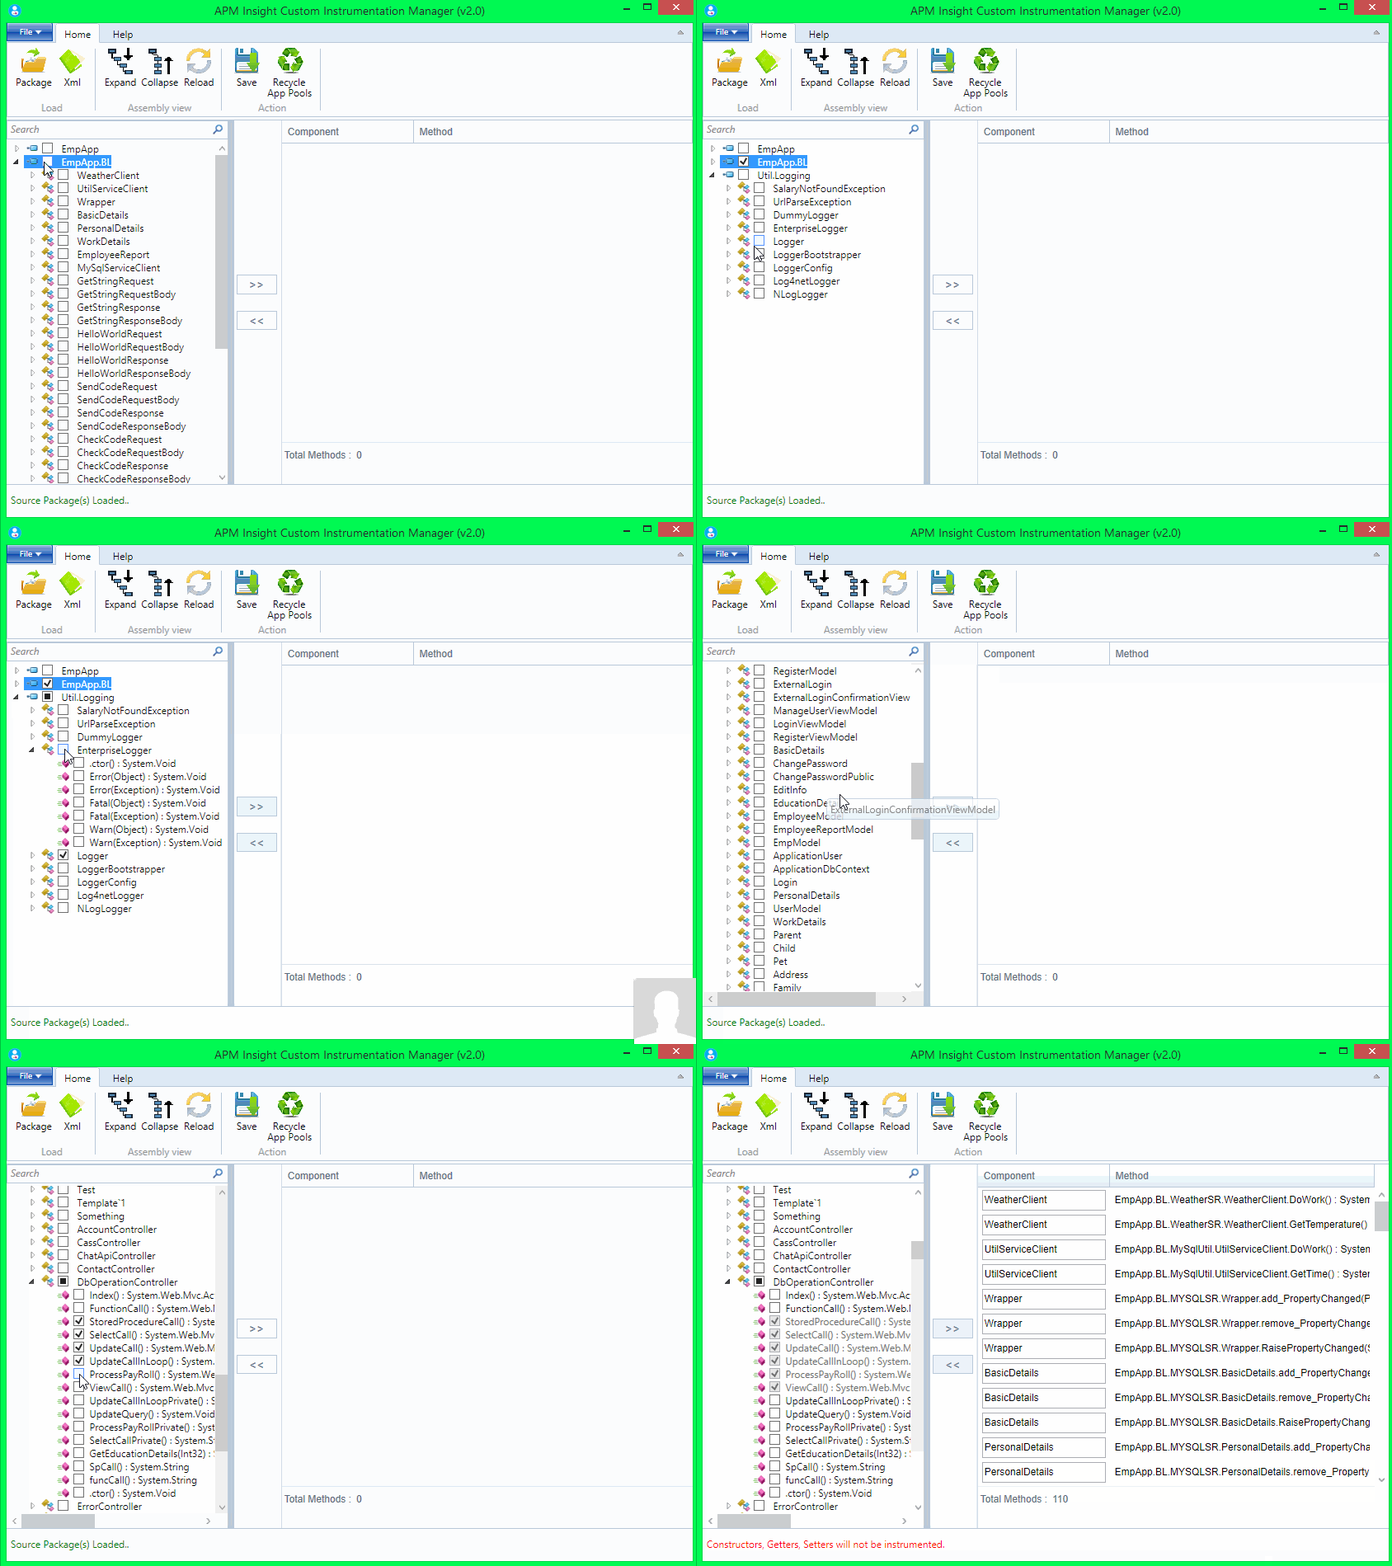
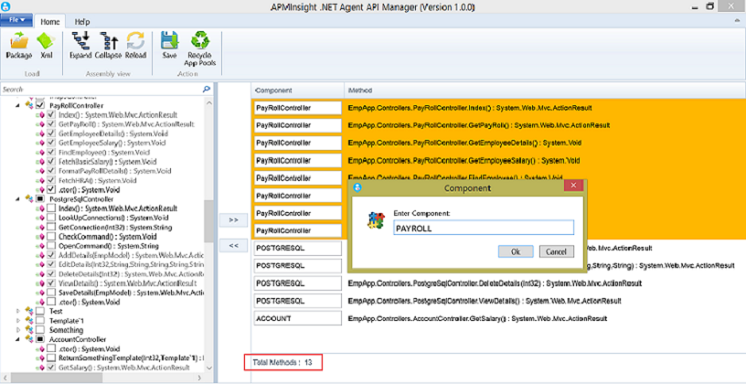
- Choose required methods / classes or even entire assemblies from left pane and add it to the right pane for monitoring. The number of methods selected will be shown at the bottom.

- The component names can be set by editing the component text box individually.
- Alternatively select a group of components, right click and select "Set Component Name" option to assign a component for multiple methods.

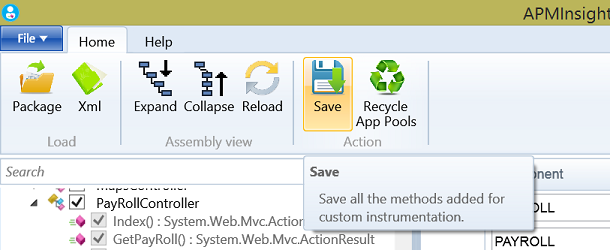
- Click the Save button. After saving, the status bar will show a message "Recycle the application pools to take effect". Note that the message appears only when one or more w3wp processes are running.

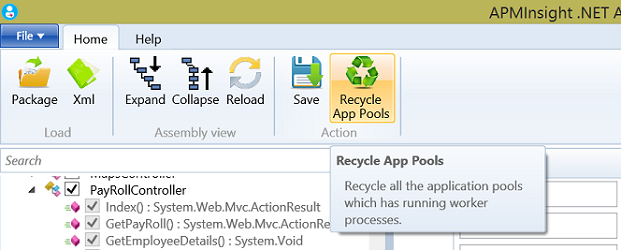
- Clicking "Recycle App pools", recycles the running application pools without resetting IIS. This can be used to avoid application downtime.
- The notification message will disappear after recycling app pools.

- Thats it! In the next polling interval, the selected web application methods will be tracked and listed in the Traces tab in Applications Manager client.
- The added methods will be displayed along with the text [custom].
Note:
- There is no need to restart IIS for using this tool. It can be done when the application is running without suffering downtime.
- Only the first 2000 methods can be instrumented and tracked per application. Therefore, when using the "Custom Instrumentation Manager Tool", it is advisable not to select more than 2000 methods to avoid potential issues.
Thank you for your feedback!
