- Home
- Logging Guide
- What is an IIS server?
What is an IIS server?
On this page
- How IIS works
- IIS server logs and performance monitoring
- Security metrics for IIS servers
- Comprehensive IIS server monitoring with EventLog Analyzer
Internet Information Services (IIS) is a powerful, flexible, extensible web server from Microsoft that is used for hosting websites, services, and applications. With its support for HTTP, HTTPS, FTP, SMTP, and more protocols for serving webpages, IIS is widely used in enterprise environments. It's the backbone of web hosting for Microsoft-based services.
How IIS works
An IIS web server functions as a flexible, modular web server that processes client requests (usually HTTP and HTTPS) and delivers the appropriate responses. Here’s a simplified breakdown of how it works:
- Request handling: An IIS server listens on designated ports (80 for HTTP and 443 for HTTPS) and directs incoming client requests to the appropriate website or application.
- Application pools: Each request is managed by a worker process within an application pool, which isolates different web applications for better security and performance.
- Modules: IIS uses modules for specific tasks like authentication, URL rewriting, and compression. These can be enabled or disabled depending on your server’s configuration.
- Responses: After processing, an IIS server sends the requested content (e.g., HTML, files, or error messages) back to the client’s browser.

IIS server logs and performance monitoring
IIS server logs are a treasure trove of information, capturing every interaction between the web server and its users. These logs provide detailed insights into web traffic, errors, and potential security incidents, making them invaluable for both system administrators and security teams. By default, an IIS server logs several key pieces of information about each request:
- The client IP address: The source IP of the device making the request
- The request timestamp: The exact time the request was made to the server
- The HTTP method: The action being performed (GET, POST, DELETE, etc.)
- The requested URL: The resource or file being requested from the server
- The response status code: The code indicating the success or failure of the request (200 for success, 404 for a missing resource, 500 for server errors, etc.)
The granularity of this data is crucial for both performance analysis and security audits. For example, a high volume of 404 errors might indicate broken links or a misconfigured site, while a spike in 500 errors could be a sign of application instability. Logs also capture client errors and server errors, allowing for the quick diagnosis of system failures or web attacks.
Performance metrics
Monitoring IIS server performance is just as important as reviewing logs for security. Without real-time insights into how your server is performing, even a small issue can spiral into a major problem, impacting website availability and the user experience. IIS provides a variety of performance metrics that, when tracked continuously, can highlight potential bottlenecks and system inefficiencies. Some of the key performance indicators that you can obtain based on IIS server log monitoring are:
- Requests per second: This metric tracks how many requests the server handles per second. Spikes may signal a DDoS attack, while drops could mean server strain.
- Connection timeouts: When requests take too long to process, it can signal performance issues or misconfigurations.
- Response times: The response time measures how fast the server responds. Longer times suggest overloads or resource mismanagement.
- Memory and CPU usage: High resource consumption by IIS processes can lead to slowdowns or crashes, requiring careful monitoring to ensure stability.
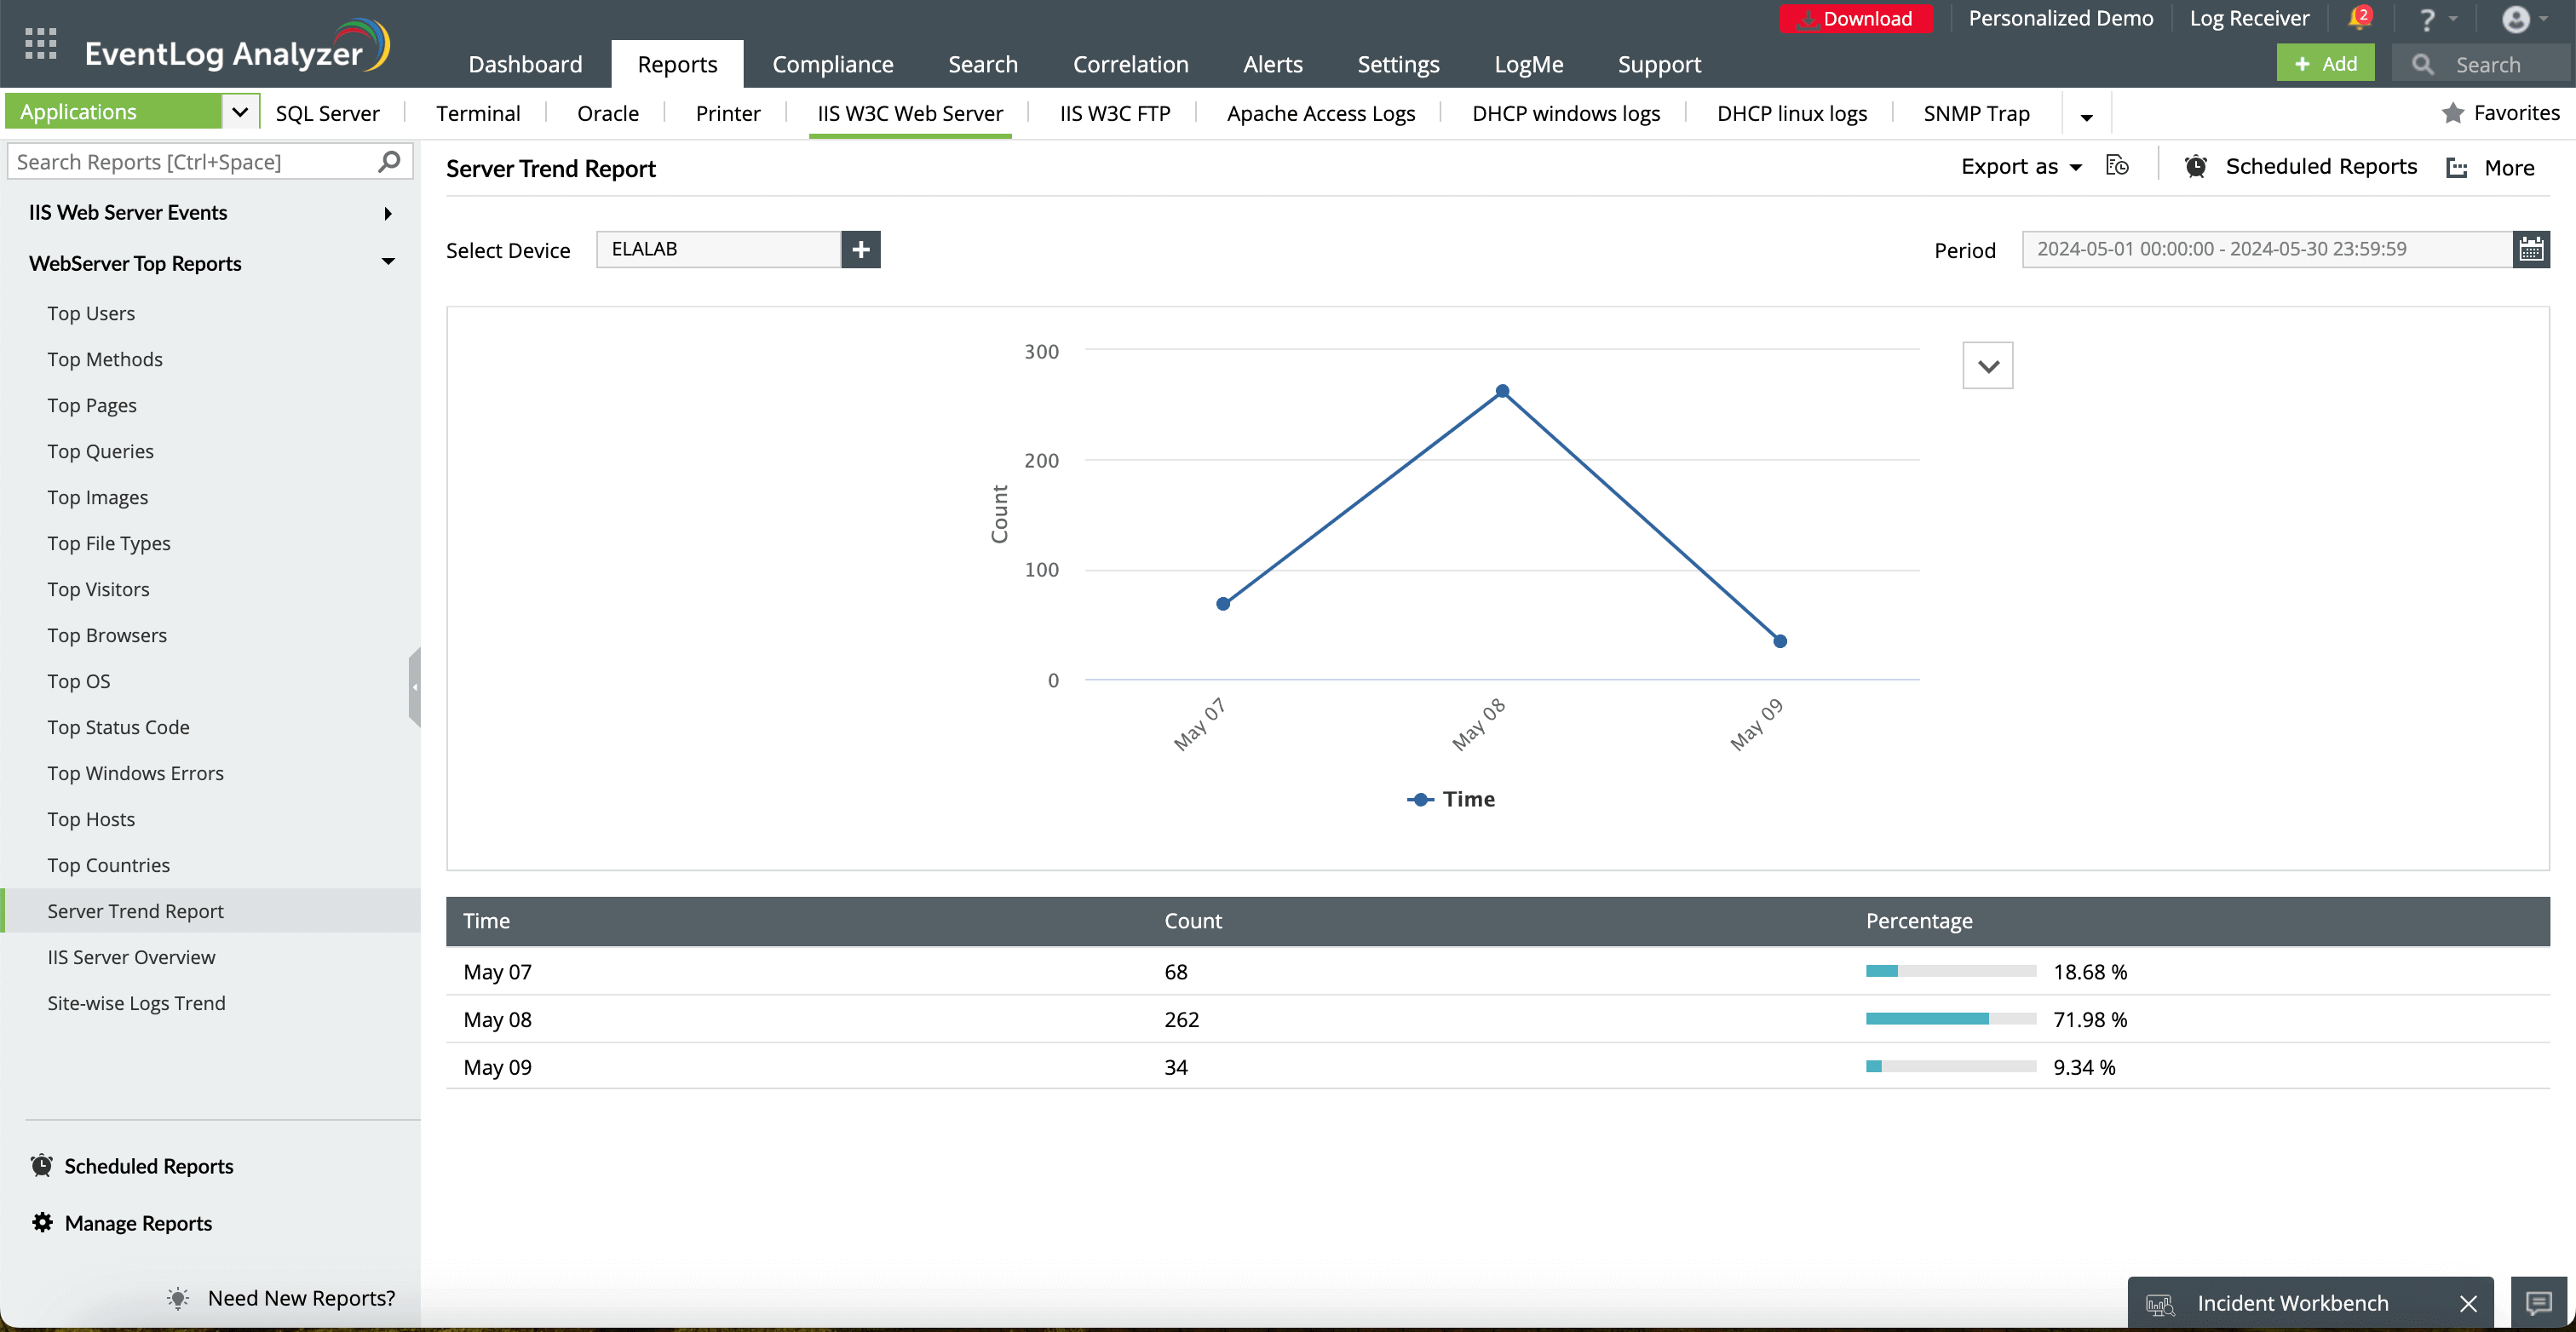
This is a visual representation of the number of server requests over time. Monitor trends to identify spikes or drops in traffic that may indicate performance issues.
This shows the percentage of total server requests for each date. Higher percentages can indicate peak times for server traffic.
View, manage, and create scheduled reports for automated delivery. Set up recurring reports to stay updated without manual effort.
Get quick access to the Incident Workbench to investigate any suspicious server activities identified in the report.
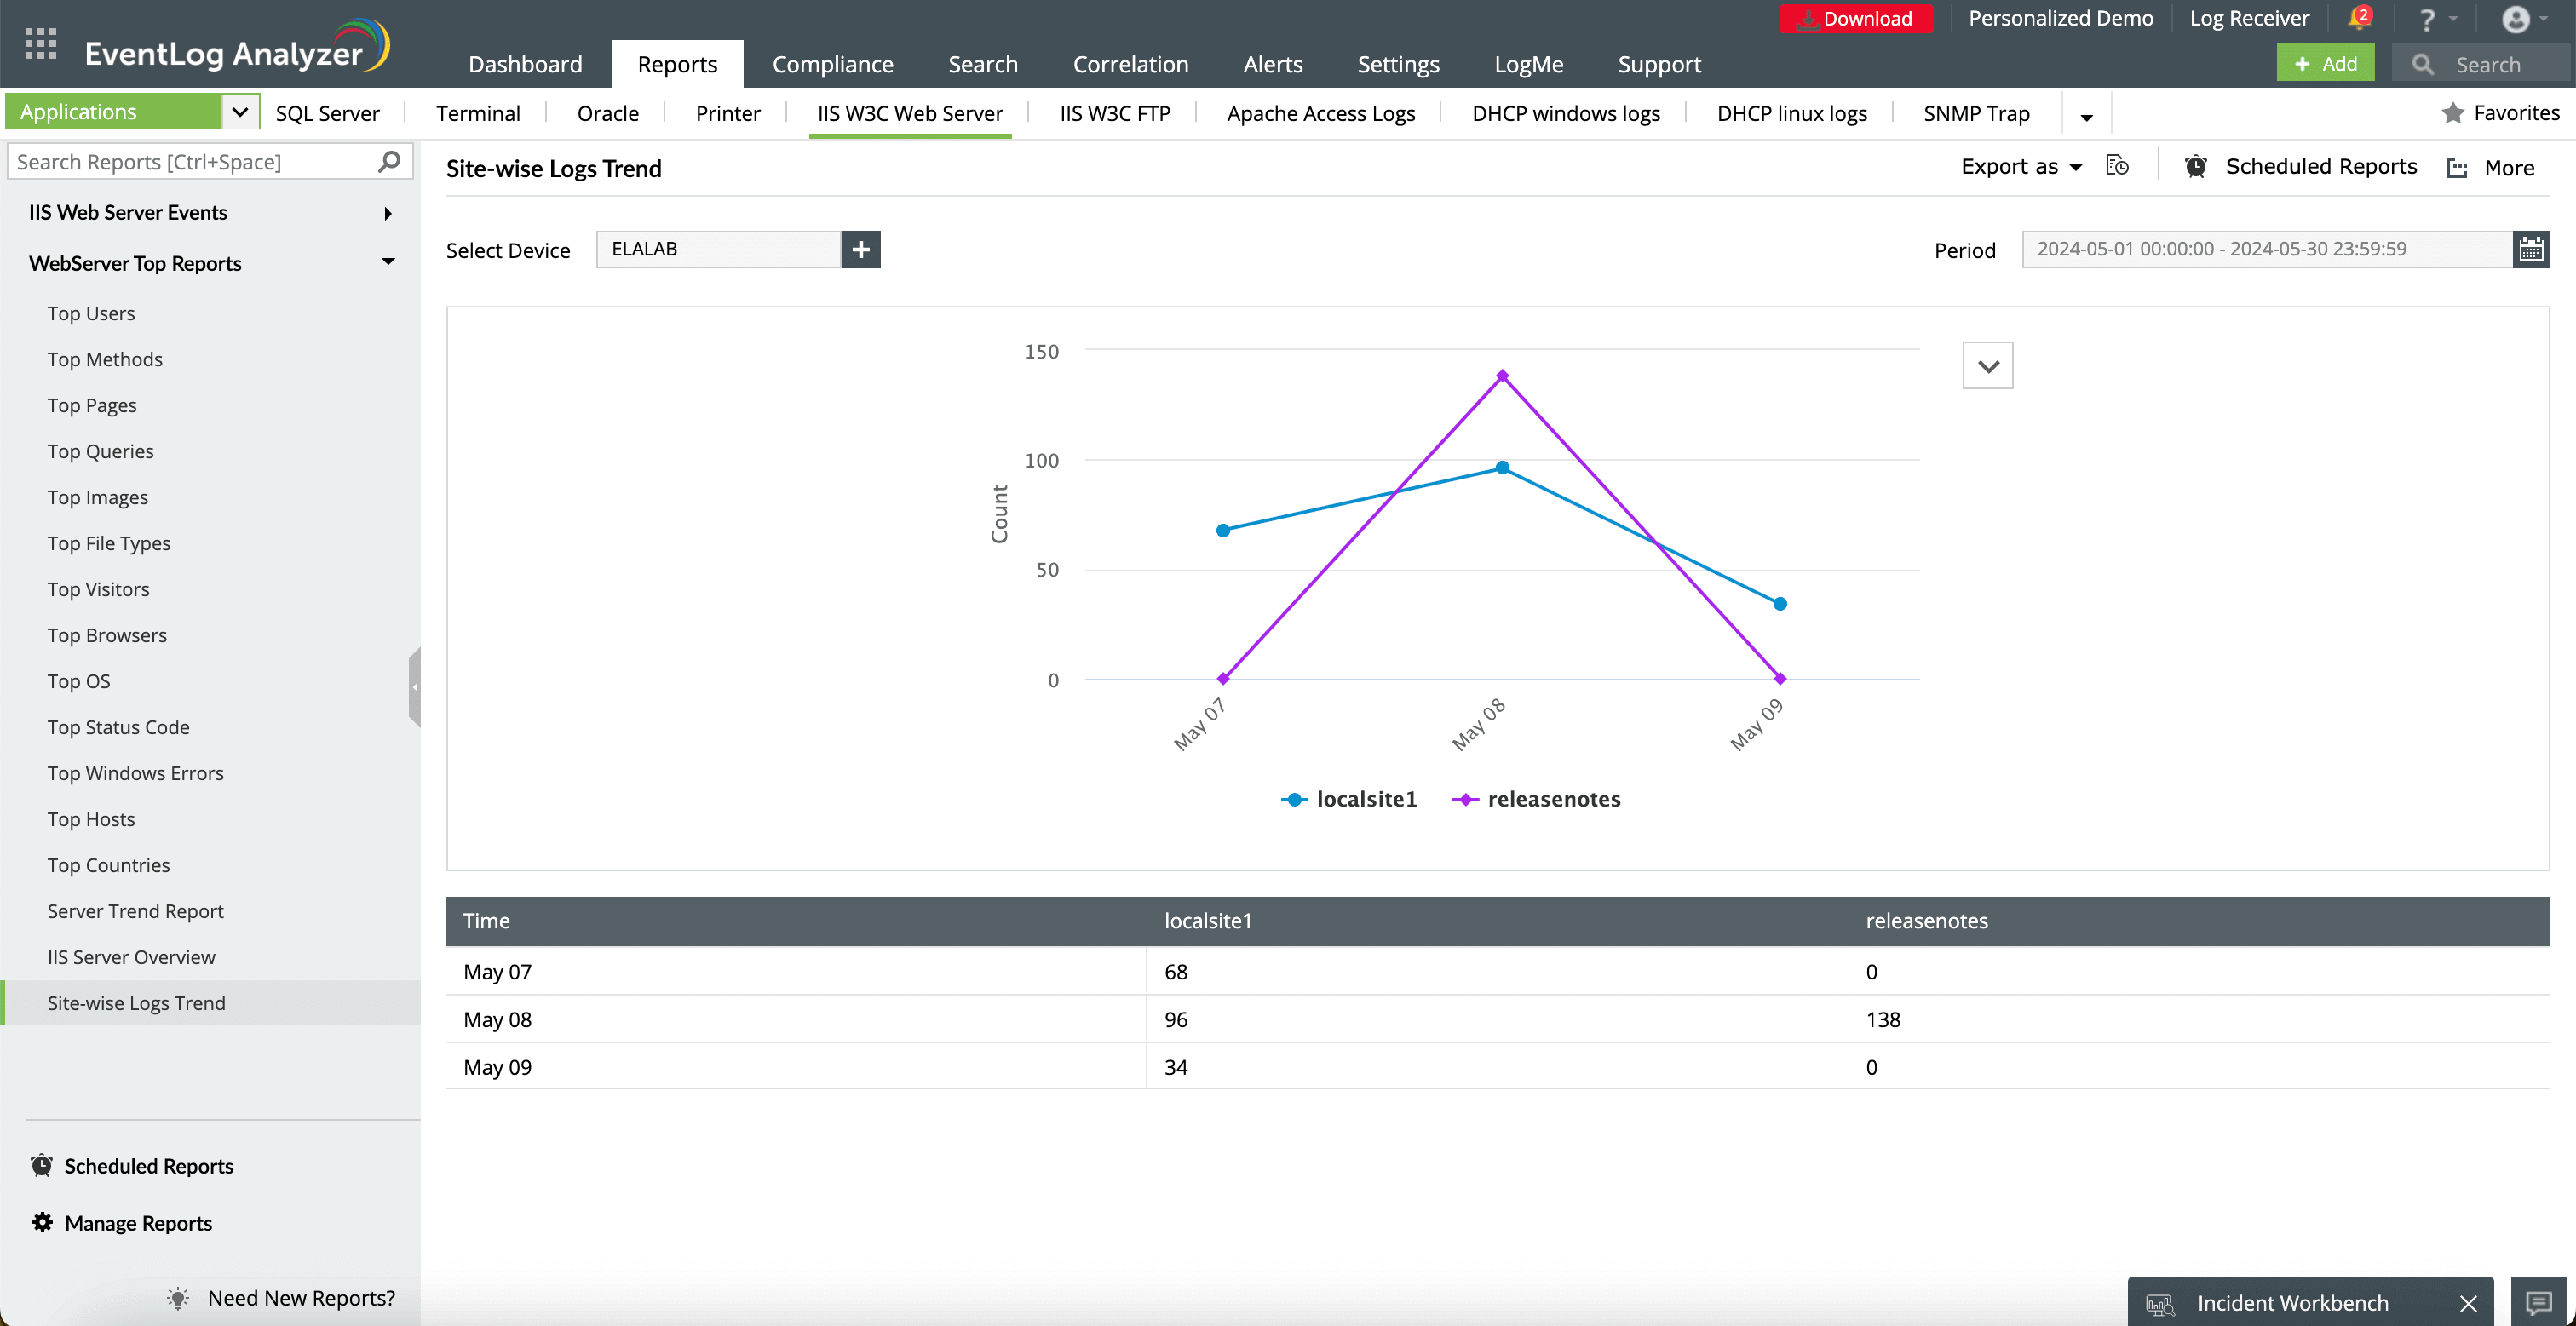
This is a visual representation of log trends across multiple sites. Hover over the points to see specific data for each site and time period.
This tabular data shows the log counts for each site over the selected time period. Compare the raw numbers across sites and dates.
Select your preferred format for viewing the graph: Line, Bar, Column, or Area.
You can choose to pin this report to the dashboard or add it to your favorites.
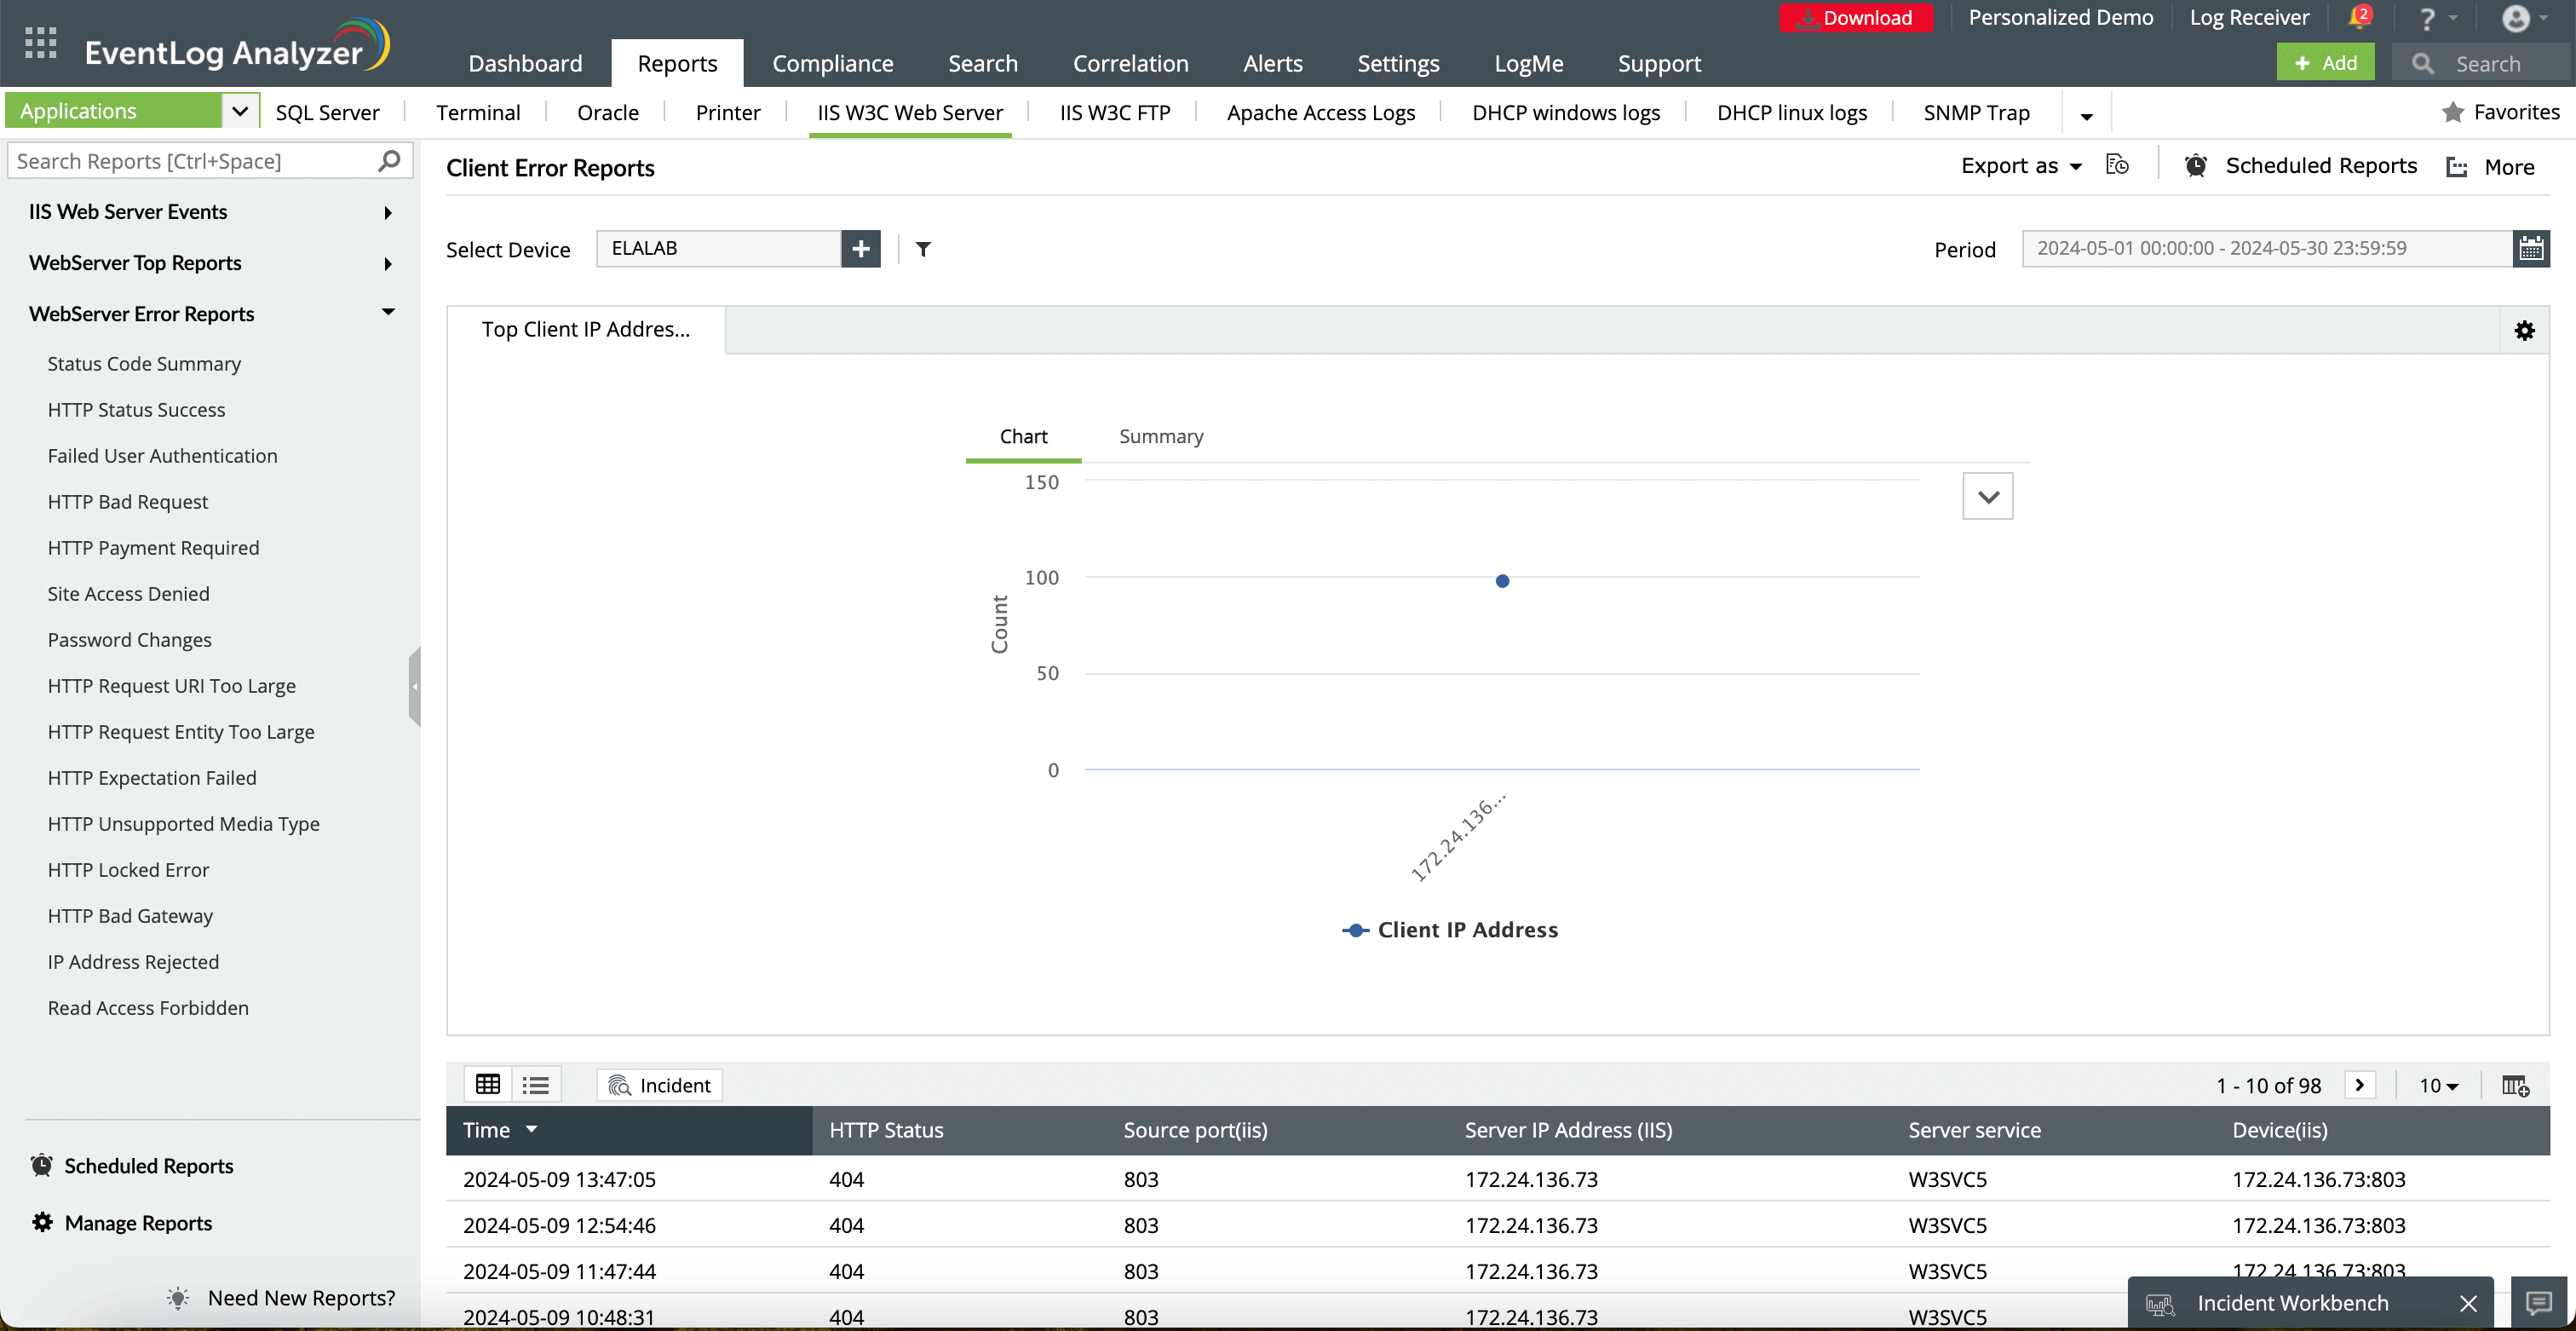
Choose the IIS server or device to monitor client connection errors like timeouts.
This indicates the specific source port from which client requests were sent. A consistent port timeout across multiple requests may point to a misconfiguration or firewall issue.
Export detailed error logs and timeout reports in different formats like PDF or CSV. This is useful for detailed analysis or sharing externally with your teams.
Switch between a graphical overview of connection timeouts and a more detailed tabular summary of the errors, providing both high-level and granular perspectives.
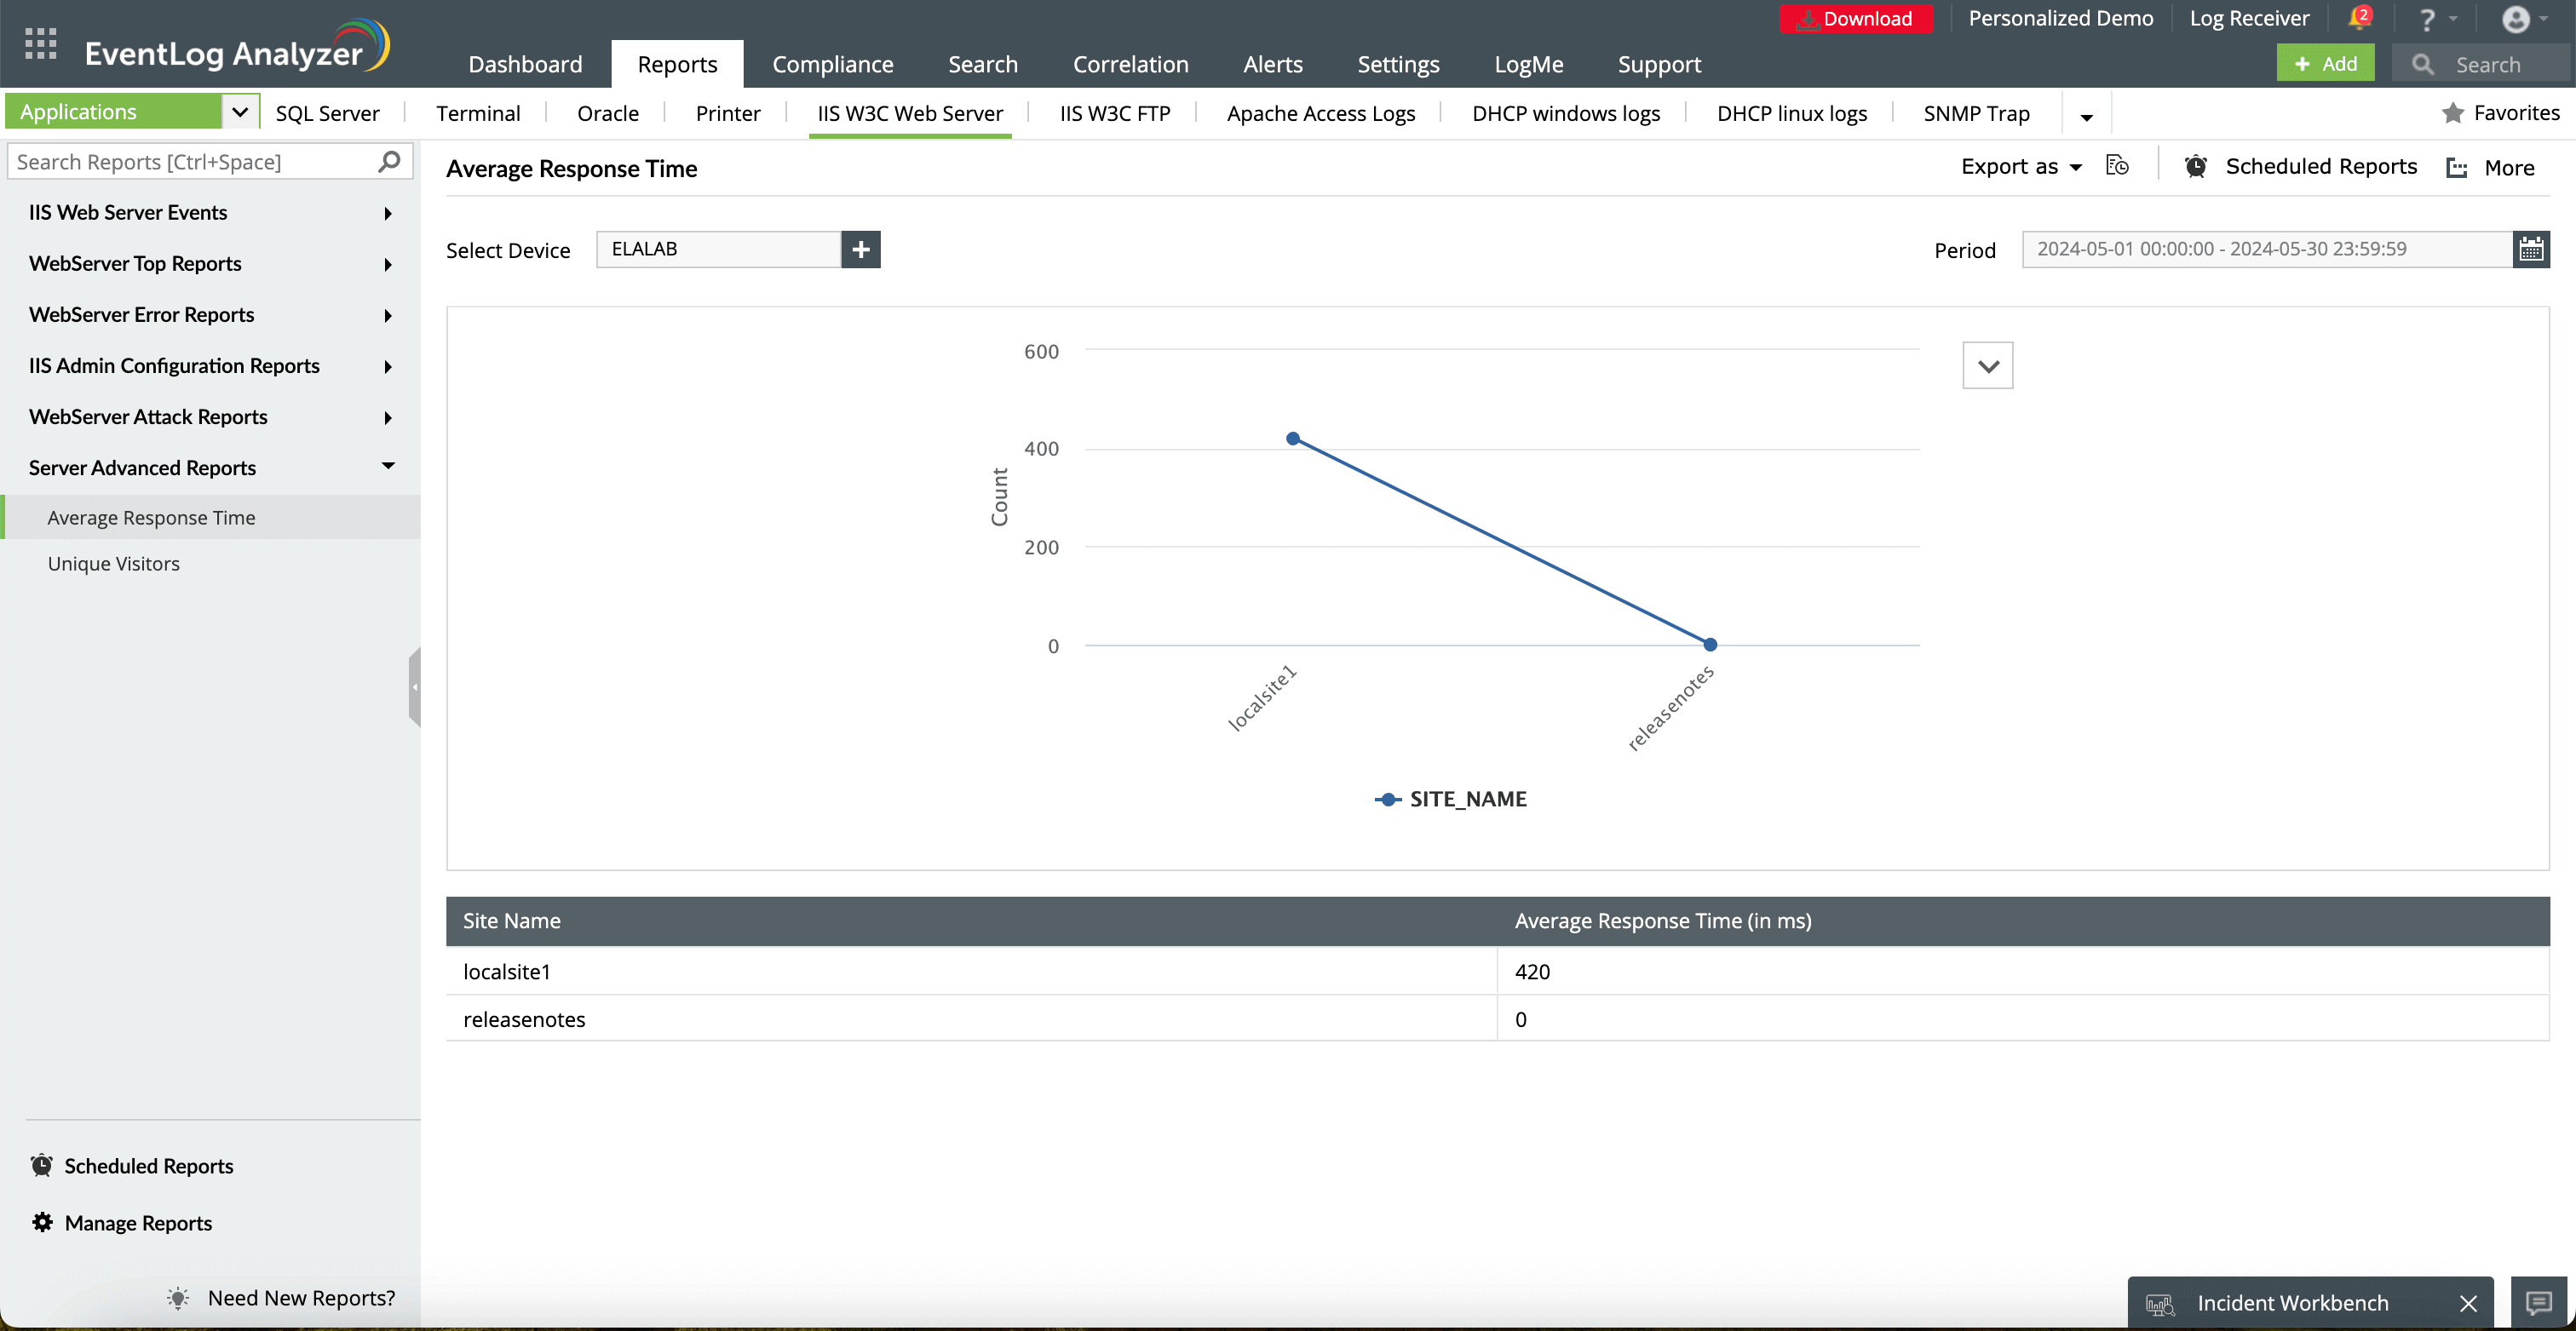
The line indicates the average response time (in milliseconds) for each site. A higher average response time may indicate server overloads or resource mismanagement for that specific site.
This lists the IIS websites or virtual directories being monitored. Monitoring by each site provides granular insights into performance metrics for each hosted resource.
This displays the average time the server takes to respond to requests for each site. This value is crucial for identifying slowdowns and ensuring optimal server performance.
This allows you to select the time period over which the average response times are calculated. Analyzing different time frames can help you identify trends and potential spikes in response times.
ManageEngine EventLog Analyzer plays a crucial role in measuring key IIS server metrics, enabling comprehensive monitoring and management of server performance. By analyzing various metrics, such as requests per second, connection timeouts, and response times, EventLog Analyzer helps IT teams identify trends and anomalies that could indicate potential issues.
Security metrics for IIS servers
When monitoring the security of an IIS server, it's crucial to track a variety of metrics that can indicate potential vulnerabilities or attacks. Below are some key metrics to consider.
Server-level metrics
- Failed login attempts: Track the number of unsuccessful attempts to log in to the server. A sudden spike could indicate a brute-force attack.
- Authentication errors: Monitor for errors related to authentication mechanisms like Windows authentication or basic authentication.
- Unauthorized access attempts: Log instances where users try to access resources they don't have permission to access.
- File and directory changes: Track modifications to critical system files or directories, which could indicate unauthorized access or malware activity.
- Security events: Monitor Windows event logs for security-related events, including security policy changes, account lockouts, and privilege escalation attempts.
Application-level metrics
- Application error events : Examine application logs for errors that might indicate vulnerabilities or attacks, such as SQL injection attempts or cross-site scripting.
- HTTP requests: Analyze HTTP requests for suspicious patterns, such as unusual request methods, large file uploads, or attempts to access hidden or restricted resources.
- Web shells: Monitor for the presence of web shells, which are malicious scripts that allow attackers to gain unauthorized access to the server.
- Critical vulnerabilities : Conduct regular vulnerability scans using tools like Nessus or Open Vulnerability Assessment Scanner to identify potential weaknesses in the server and its applications.
Comprehensive IIS server monitoring with EventLog Analyzer
EventLog Analyzer, a comprehensive log management and IT compliance solution, helps sysadmins monitor IIS servers by providing real-time log collection, analysis, and reporting features for all server events. Its built-in IIS log parsing capabilities allow for deep insights into security events, such as failed login attempts, SQL injection attacks, and DDoS threats. The parsing functionality breaks down complex IIS logs into manageable fields like client IP addresses, request methods, and status codes, making it easier to trace potential issues.
EventLog Analyzer not only tracks usage data like web traffic patterns, user activity, and error events but also helps with security auditing by offering over 50 prebuilt, customizable reports specifically tailored to IIS environments. These reports allow administrators to pinpoint issues like authentication failures and suspicious activity across servers.
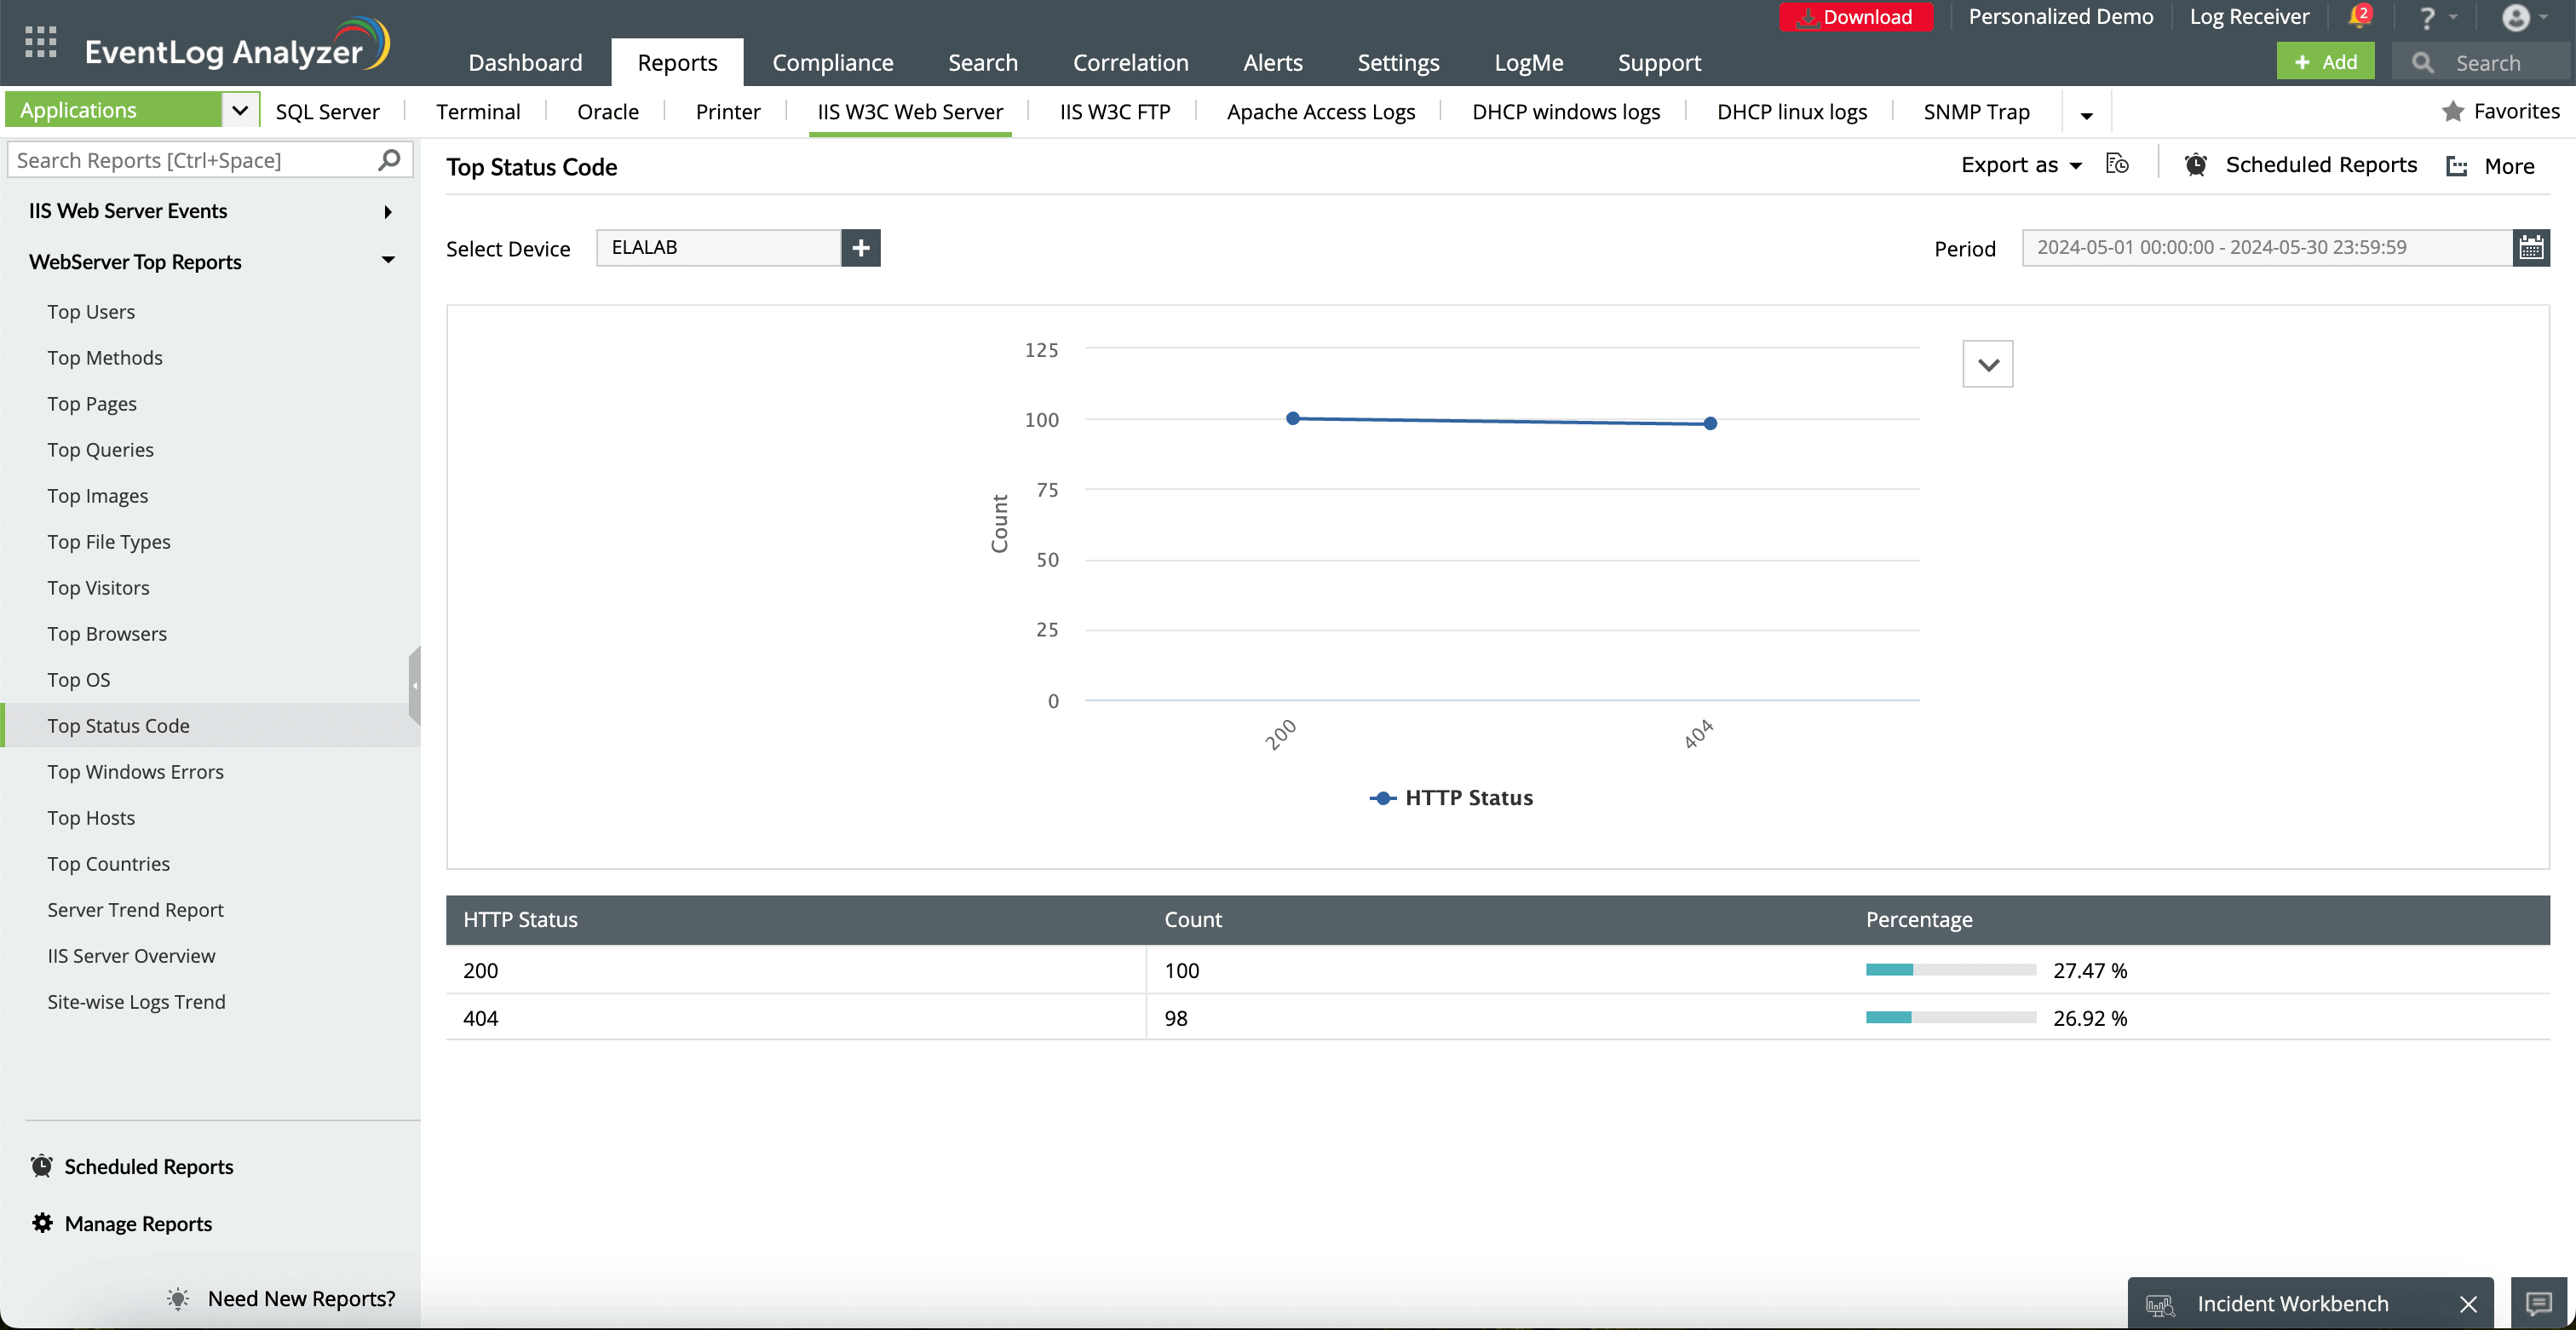
With real-time alerts and automated incident response, the tool detects anomalous behaviors, such as repeated login failures or large HTTP request entities, and implements custom workflows to immediately address them. EventLog Analyzer’s ability to correlate logs from IIS with other sources across the network allows IT teams to detect multi-vector attacks that may span different services or servers. The solution's compliance reporting features also help organizations meet regulatory requirements, offering audit-ready reports for standards such as the PCI DSS and HIPAA.
What's next?
Analyze IIS logs and monitor critical IIS server events in real time with EventLog Analyzer.
Explore the free, 30-day trial now or receive a free, personalized product demo with one of our solution experts.


