Bandwidth is the amount of digital information that can be sent and received from a device over a particular time. The amount of bandwidth consumed is usually dependent on the network plan provided by the internet service provider.
Many organizations depend on the internet for one reason or another. And often, organizations need or utilize more bandwidth than their monthly plan allows. Monitoring network bandwidth is the only way to understand where bandwidth is being used productively and where it's being wasted.
ManageEngine NetFlow Analyzer is flow-based bandwidth monitoring software that shows real-time statistics on bandwidth consumption to highlight network abnormalities, which can then be analyzed and fixed before end users experience any disruptions.
With complete visibility over the network's traffic patterns and bandwidth usage trends, you'll know which areas of the network could benefit from improvements to the network infrastructure. NetFlow Analyzer provides support to all leading vendors, and flows including NetFlow, sFlow, JFlow, IPFIX, and more.
A three-story building has networking devices corresponding to each floor. Since the first floor is the waiting area and reception, this floor has a wireless router. The second floor of the building is filled with engineers and the legal team, and since both are of extreme importance to the company, they are provided with two fast-wired devices with multiple access points. The third floor has a support team, which has a wired connection for secure communication, and a wireless network so they can make VoIP calls even while away from their desks.
Not only can network admins efficiently monitor bandwidth consumption on network of all these devices and the network in its entirety using NetFlow Analyzer, but they can also create groups of access points to monitor each team separately, their bandwidth consumption by application, and generate reports on the amount of bandwidth consumed.

NetFlow Analyzer proactively collects and analyzes your device bandwidth information at all times, so you know exactly how much bandwidth each of your networking devices consumes at any given time.
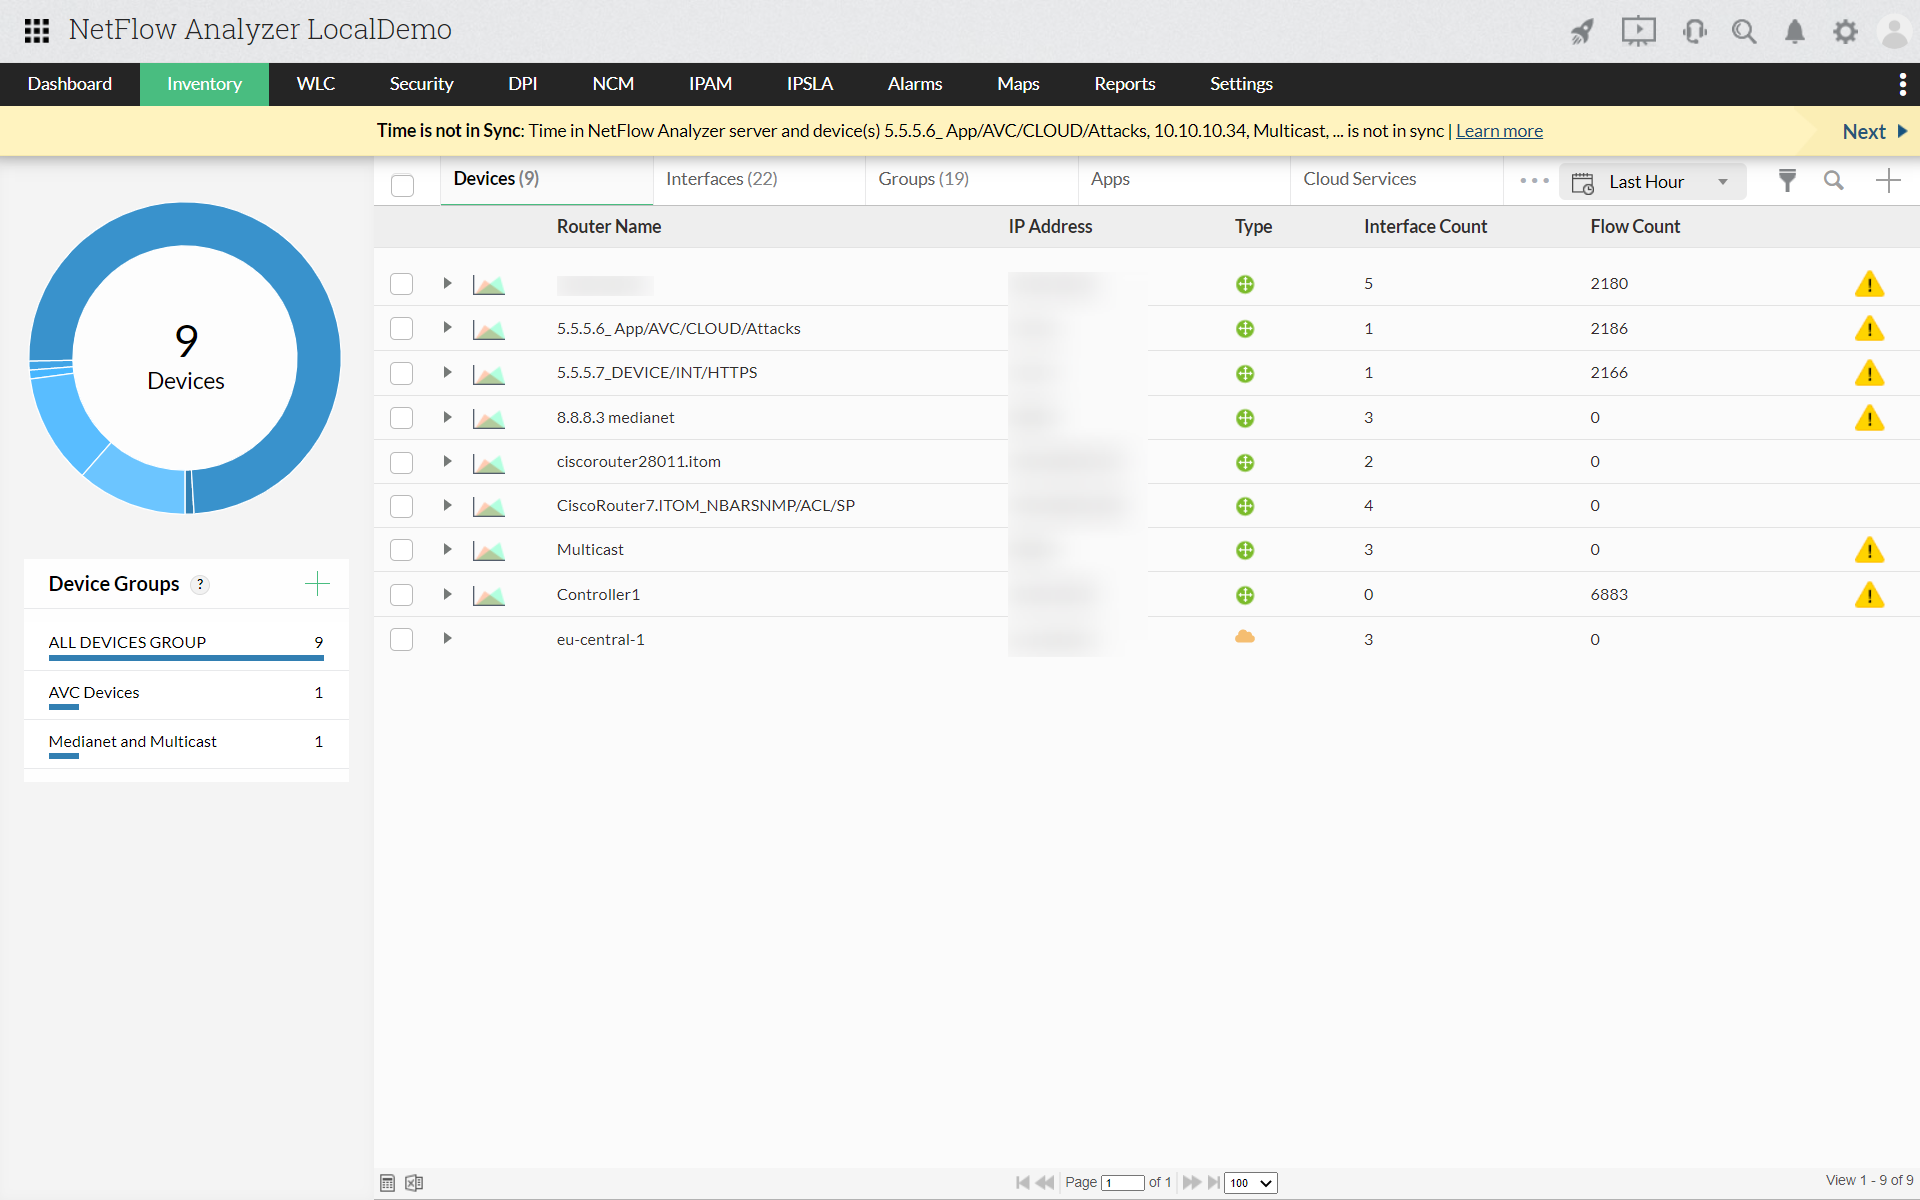
Navigate to Inventory > Devices to open the list of discovered devices. Clicking on one of these devices shows all the device's stats including Summary, Traffic, Interface, Application, Source, Destination, QoS, Conversation, AS View, and Attacks. You can click on any of these tabs to generate a more detailed report. All the reports in NetFlow Analyzer can be exported as CSV or PDF and can be emailed.

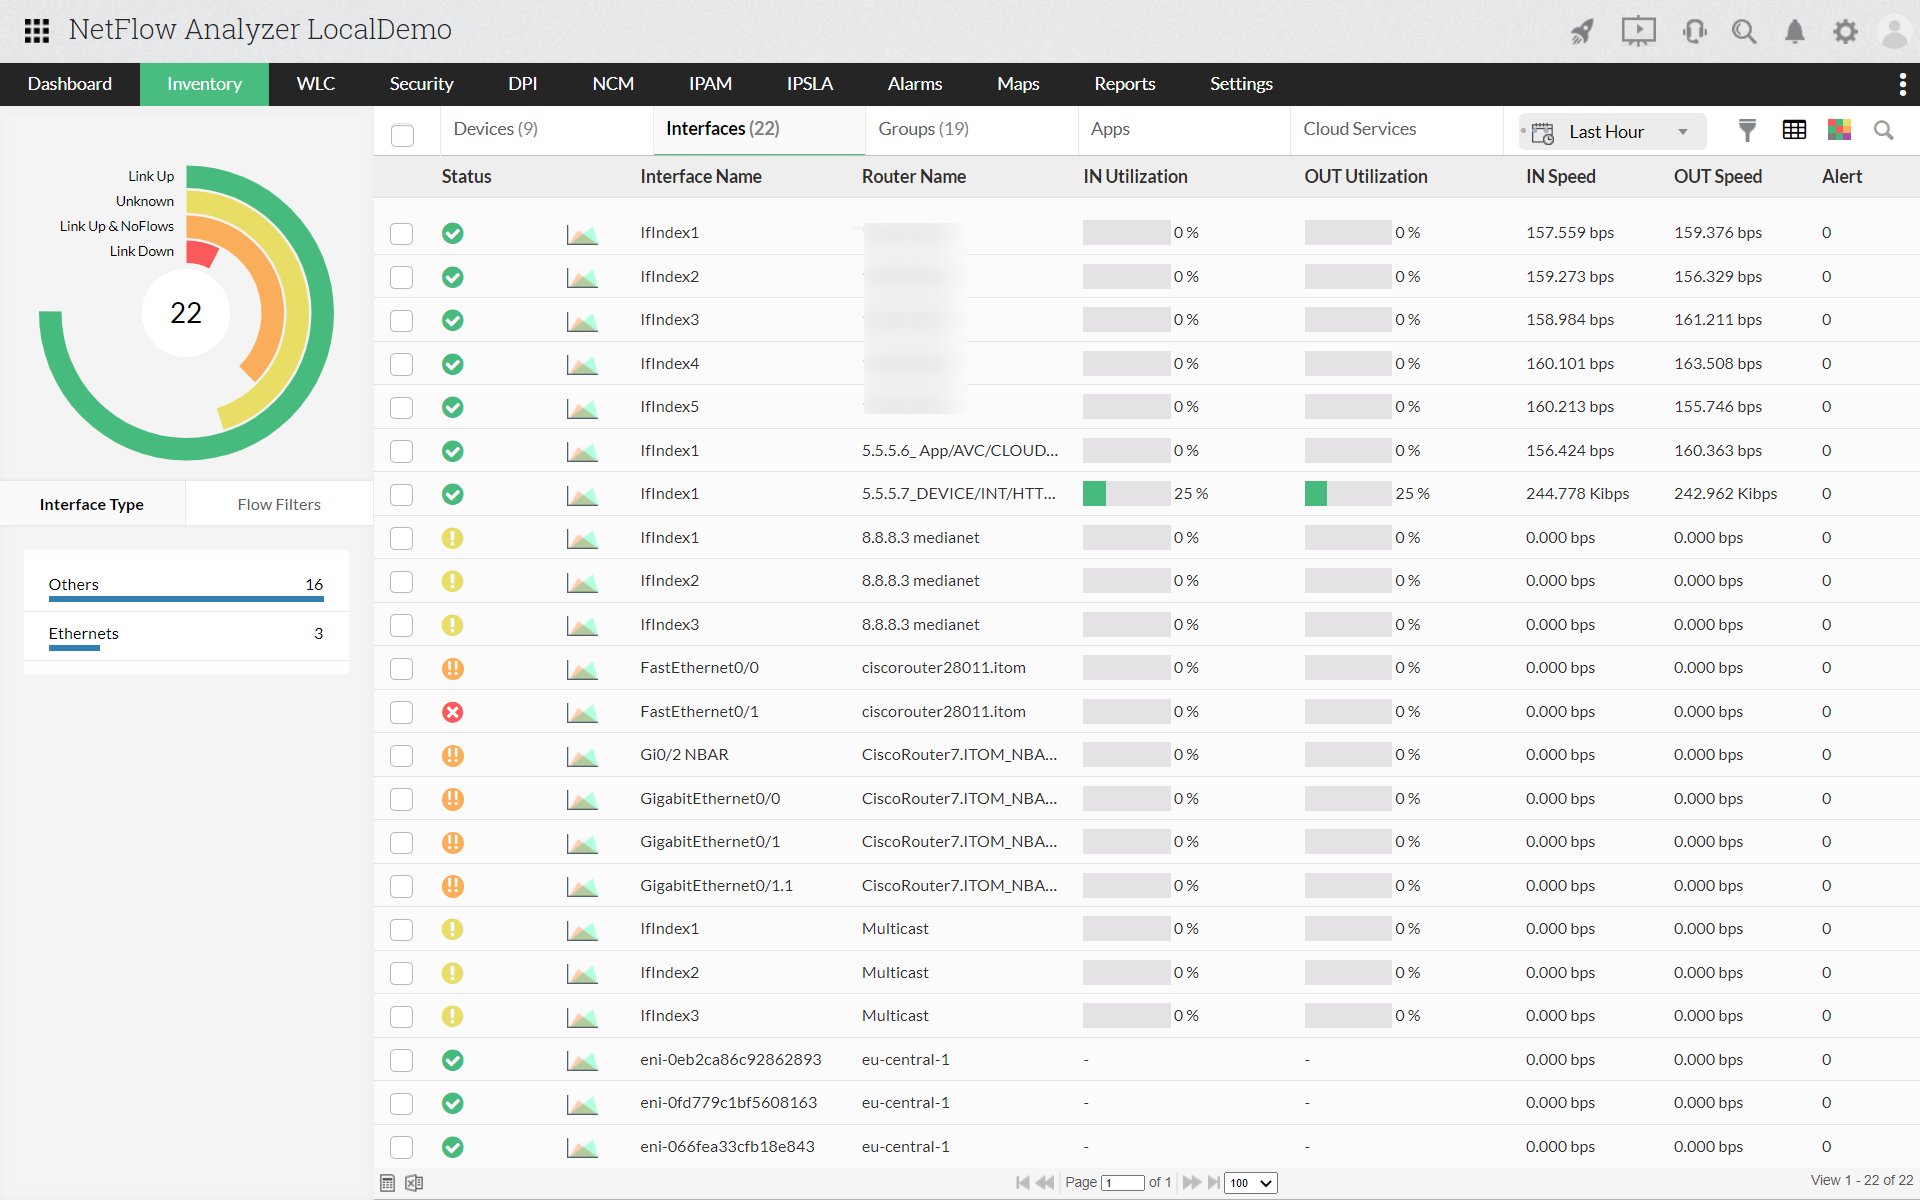
To open the list of interfaces that are evaluated by NetFlow Analyzer, navigate to Inventory > Interfaces. In addition to the list of interfaces, NetFlow Analyzer also shows Status, Interface Name, Router Name, IN Utilization, OUT Utilization, IN Speed, OUT Speed, and Alerts. By clicking on these headings, you can sort this list by ascending and descending order, which makes it easier to calculate the bandwidth usage.

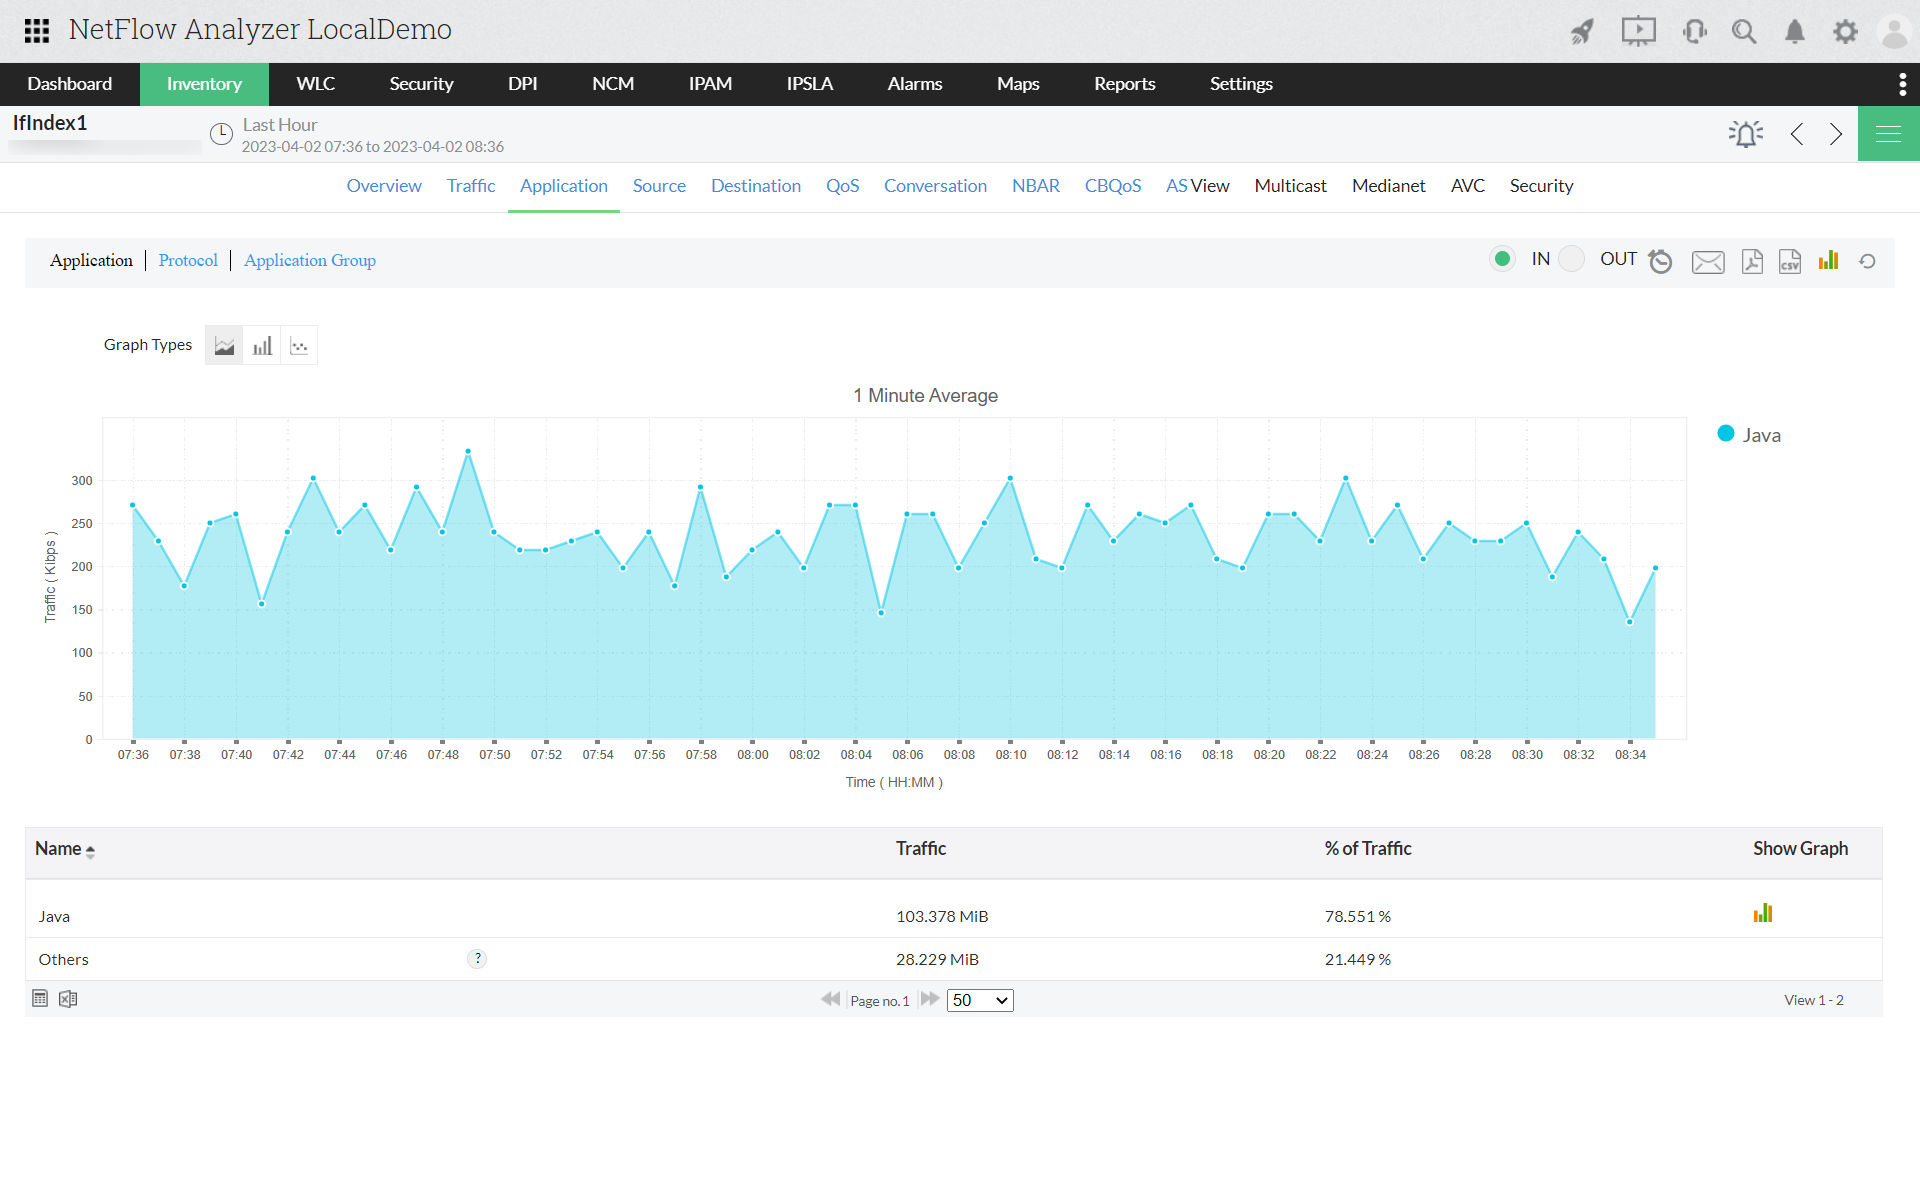
Get a detailed list of all the applications used by the device or interface in their corresponding tabs along with the traffic information and a graph for visual aide. In addition to this, NetFlow Analyzer provides a separate section in the inventory for layer-4 and layer-7 applications. To view these, navigate to Inventory > Layer 4 Application or Inventory > Layer 7 Application respectively.

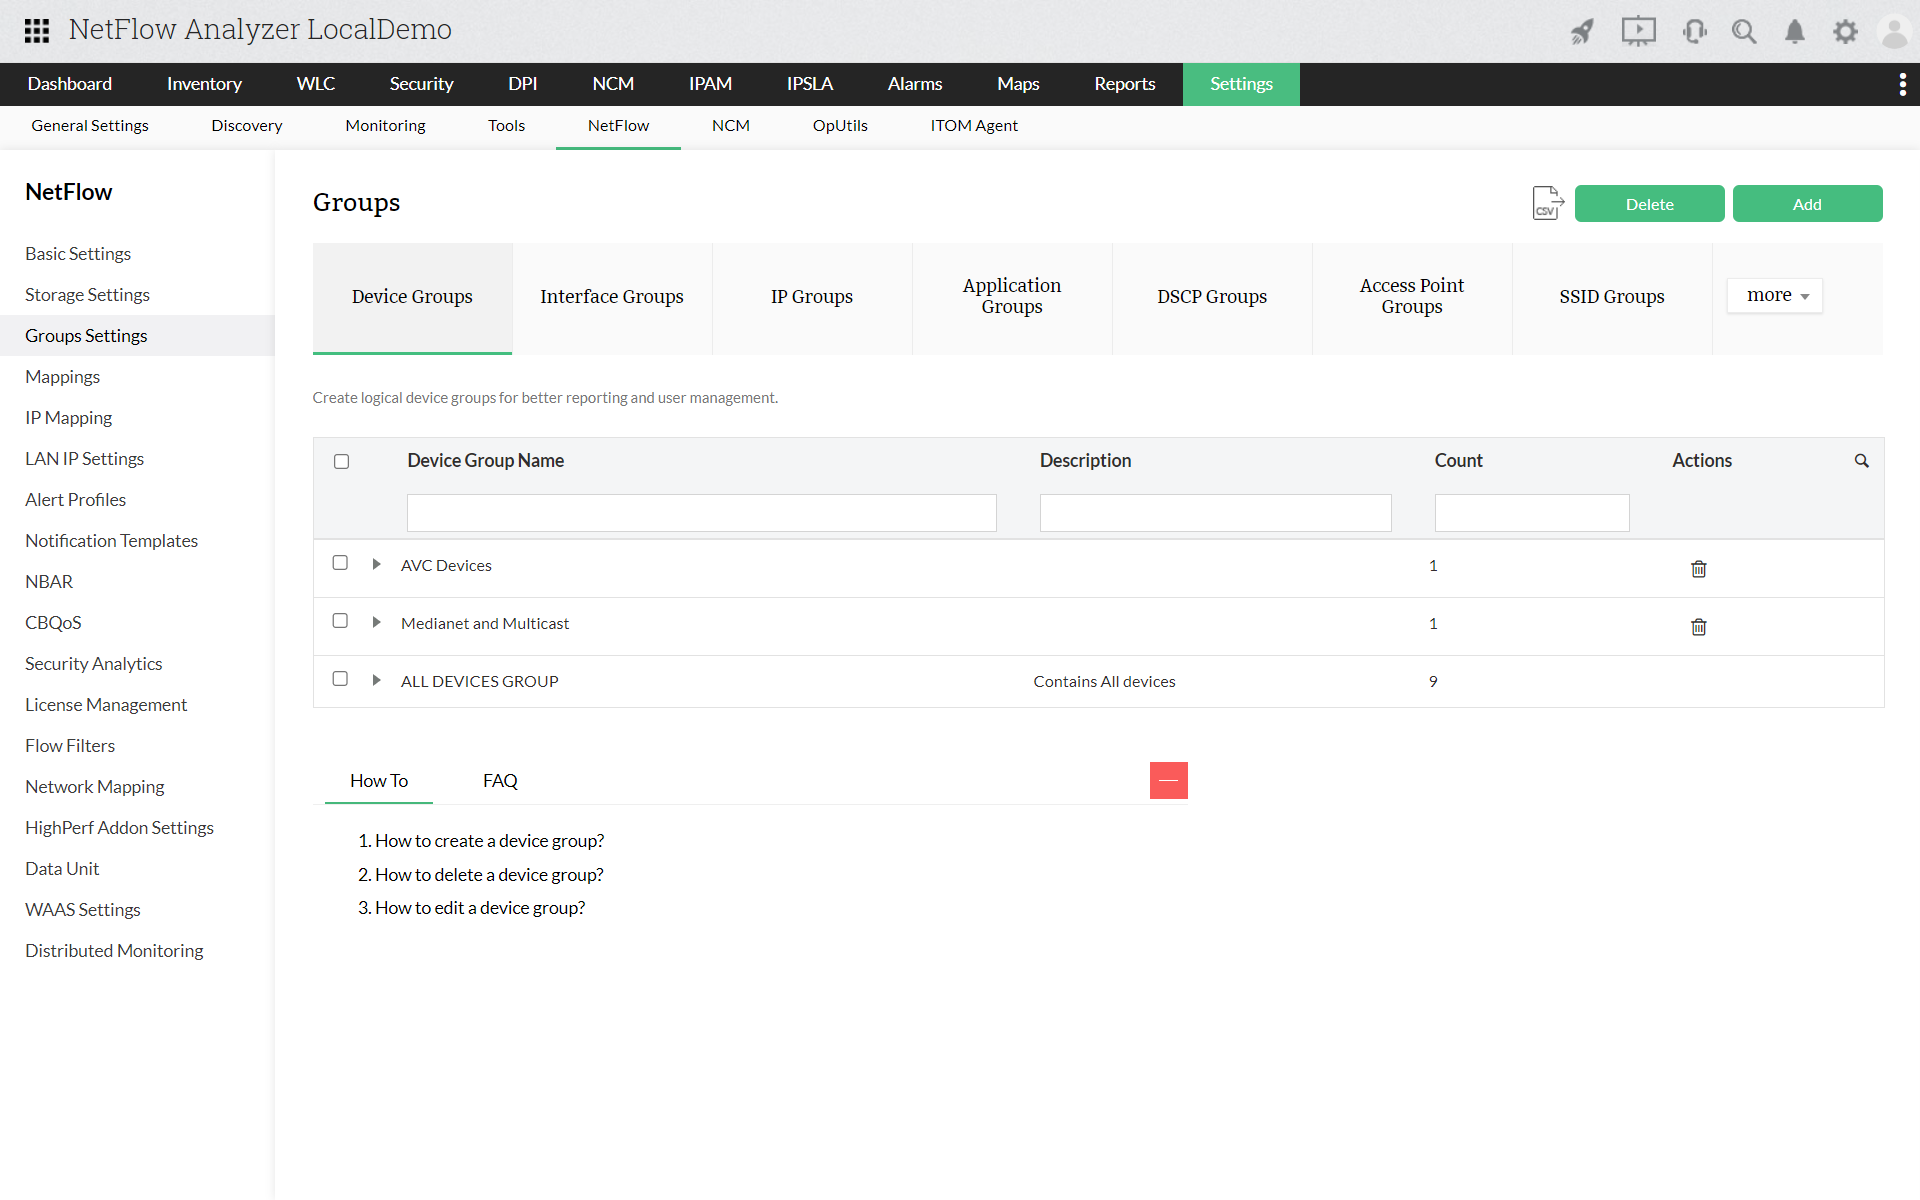
The grouping feature provides the option to cumulatively track bandwidth consumption of the group of devices, and sort traffic by devices, interfaces, IPs, applications, and DSCP to get a better picture of the traffic consumption. NetFlow Analyzer provides the option to create Device Groups, Interface Groups, IP Groups, Application Groups, DSCP Groups, Access Point Groups, SSID Groups, and Autonomous System Group. To create a group, navigate to Settings > NetFlow > Groups Settings.