Attacks or Advanced Security Analytics Module (ASAM) is a flow based network security analytics tool that helps detect and classify network intrusions. It offers intelligence to detect a broad spectrum of external and internal security threats. Using the "Continuous Stream Mining Engine" technology, ASAM analyzes NetFlow packets in real time and matches multiple events without duplication. It also offers continuous overall assessment of network security. ASAM is available as an add-on module for NetFlow Analyzer and requires a license to run. Since NetFlow packets are exported directly from NetFlow Analyzer there is no configuration required on the module.
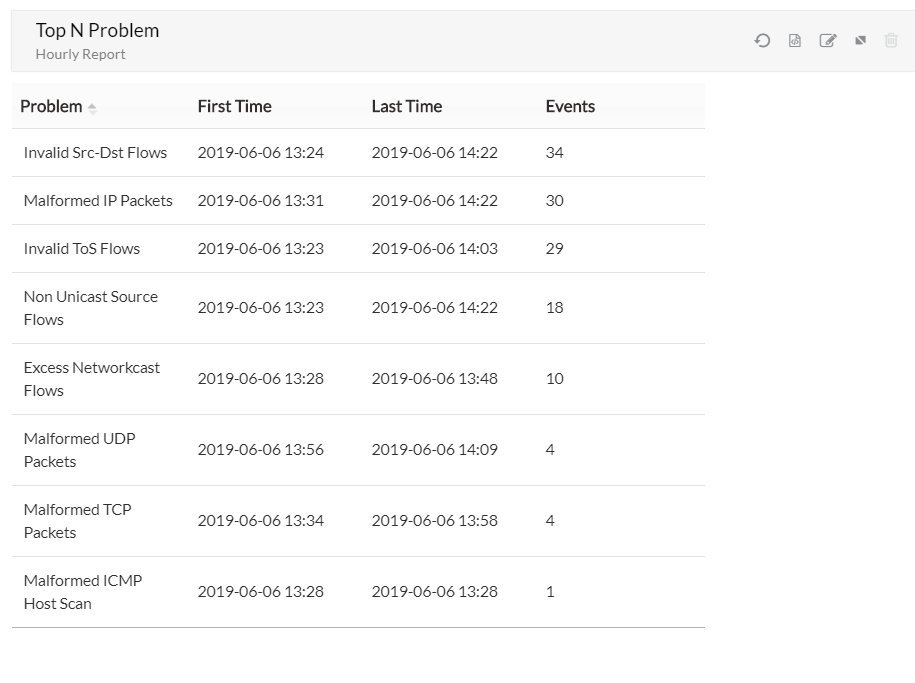
Displays the top 10 problem classes and their respective problems by default. It also lists the start and end time for each problem types withnumber of events involved. You can click on the Edit icon ![]() to change the Top view from 10 to 5 and get the information based on different time periods.
to change the Top view from 10 to 5 and get the information based on different time periods.
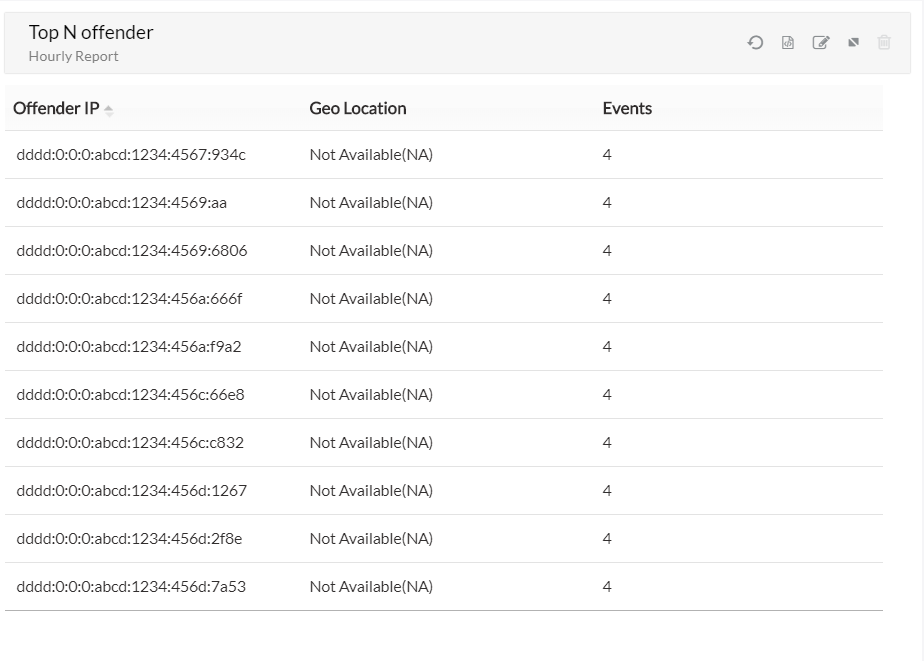
Display the information on top 10 Offender IP with the Geo location with the number of events involved. You can click on the Edit icon ![]() to change the Top view from 10 to 5 and get the information based on different time periods.
to change the Top view from 10 to 5 and get the information based on different time periods.
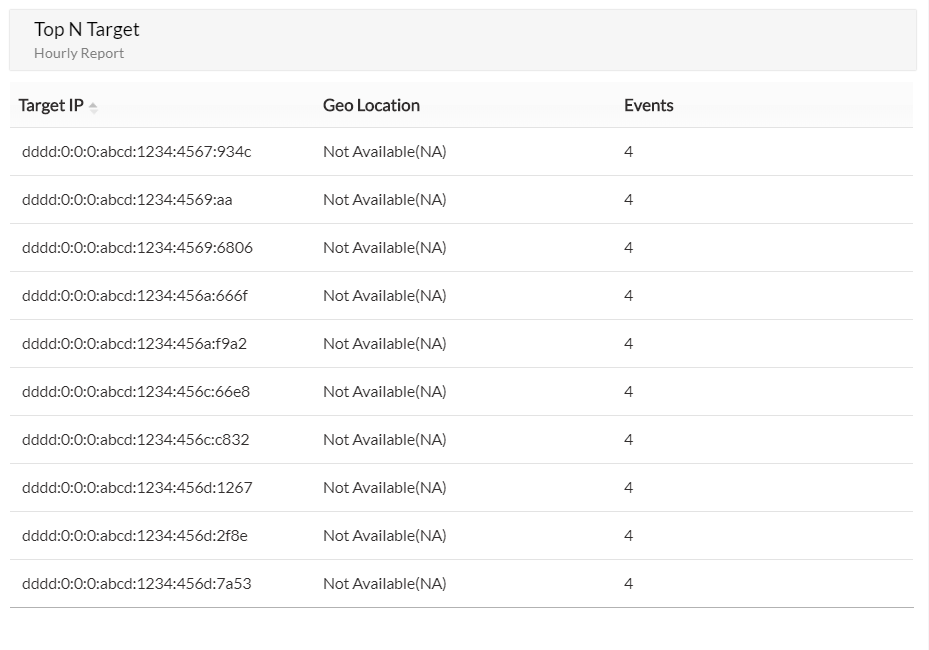
Display the information on top 10 Target IP with the Geo location with the number of events involved. You can click on the Edit icon ![]() to change the Top view from 10 to 5 and get the information based on different time periods.
to change the Top view from 10 to 5 and get the information based on different time periods.
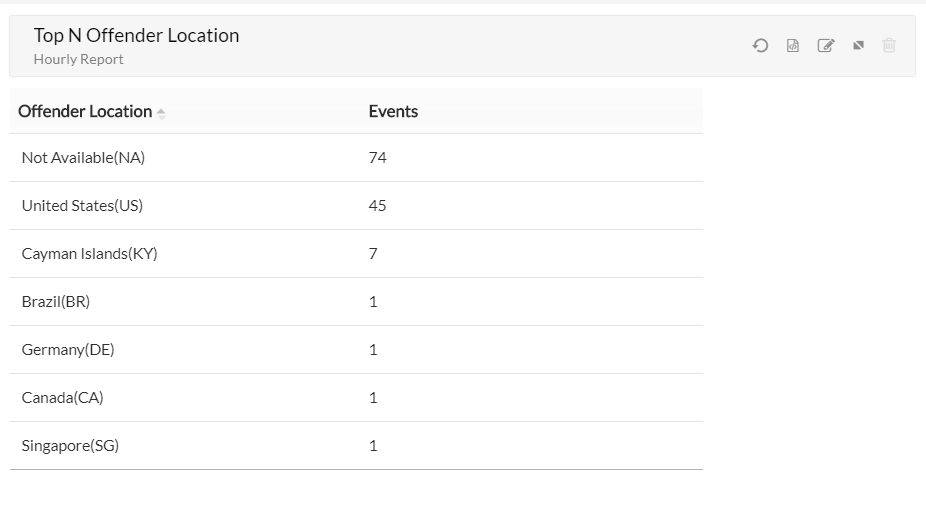
Display the information about the top offender location and events involved. You can click on the Edit icon ![]() to change the Top view from 10 to 5 and get the information based on different time periods.
to change the Top view from 10 to 5 and get the information based on different time periods.
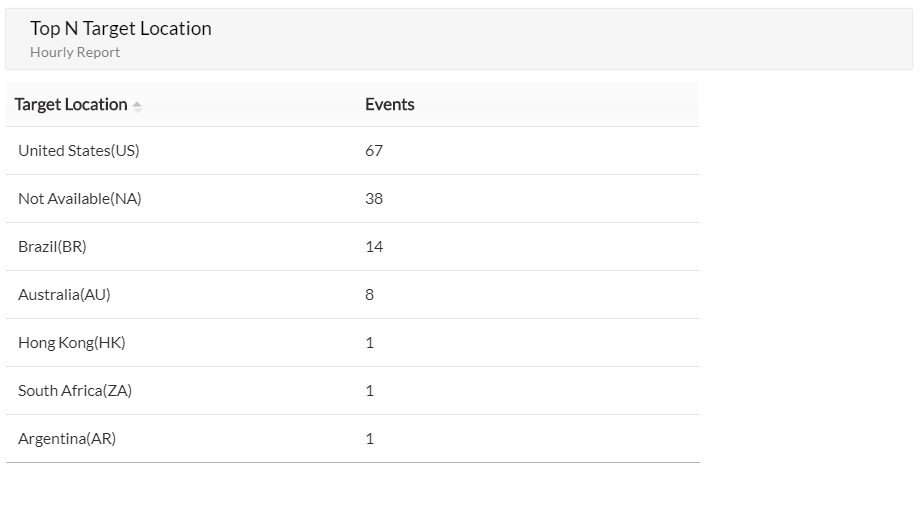
Display the information about the top target location and events involved. You can click on the Edit icon ![]() to change the Top view from 10 to 5 and get the information based on different time periods.
to change the Top view from 10 to 5 and get the information based on different time periods.
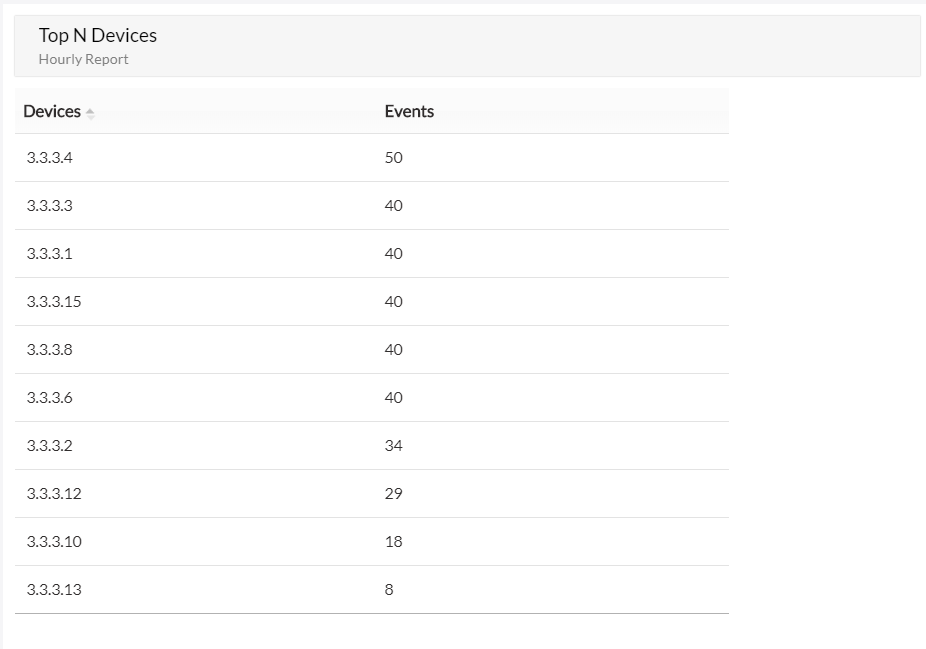
Display the information based on the Devices involved in problem classes in the network with the events involved. You can click on the Edit icon ![]() to change the Top view from 10 to 5 and get the information based on different time periods.
to change the Top view from 10 to 5 and get the information based on different time periods.

Display the information about top device and interface involved in a problem with the events involved. You can click on the Edit icon ![]() to change the Top view from 10 to 5 and get the information based on different time periods.
to change the Top view from 10 to 5 and get the information based on different time periods.
Thank you for your feedback!