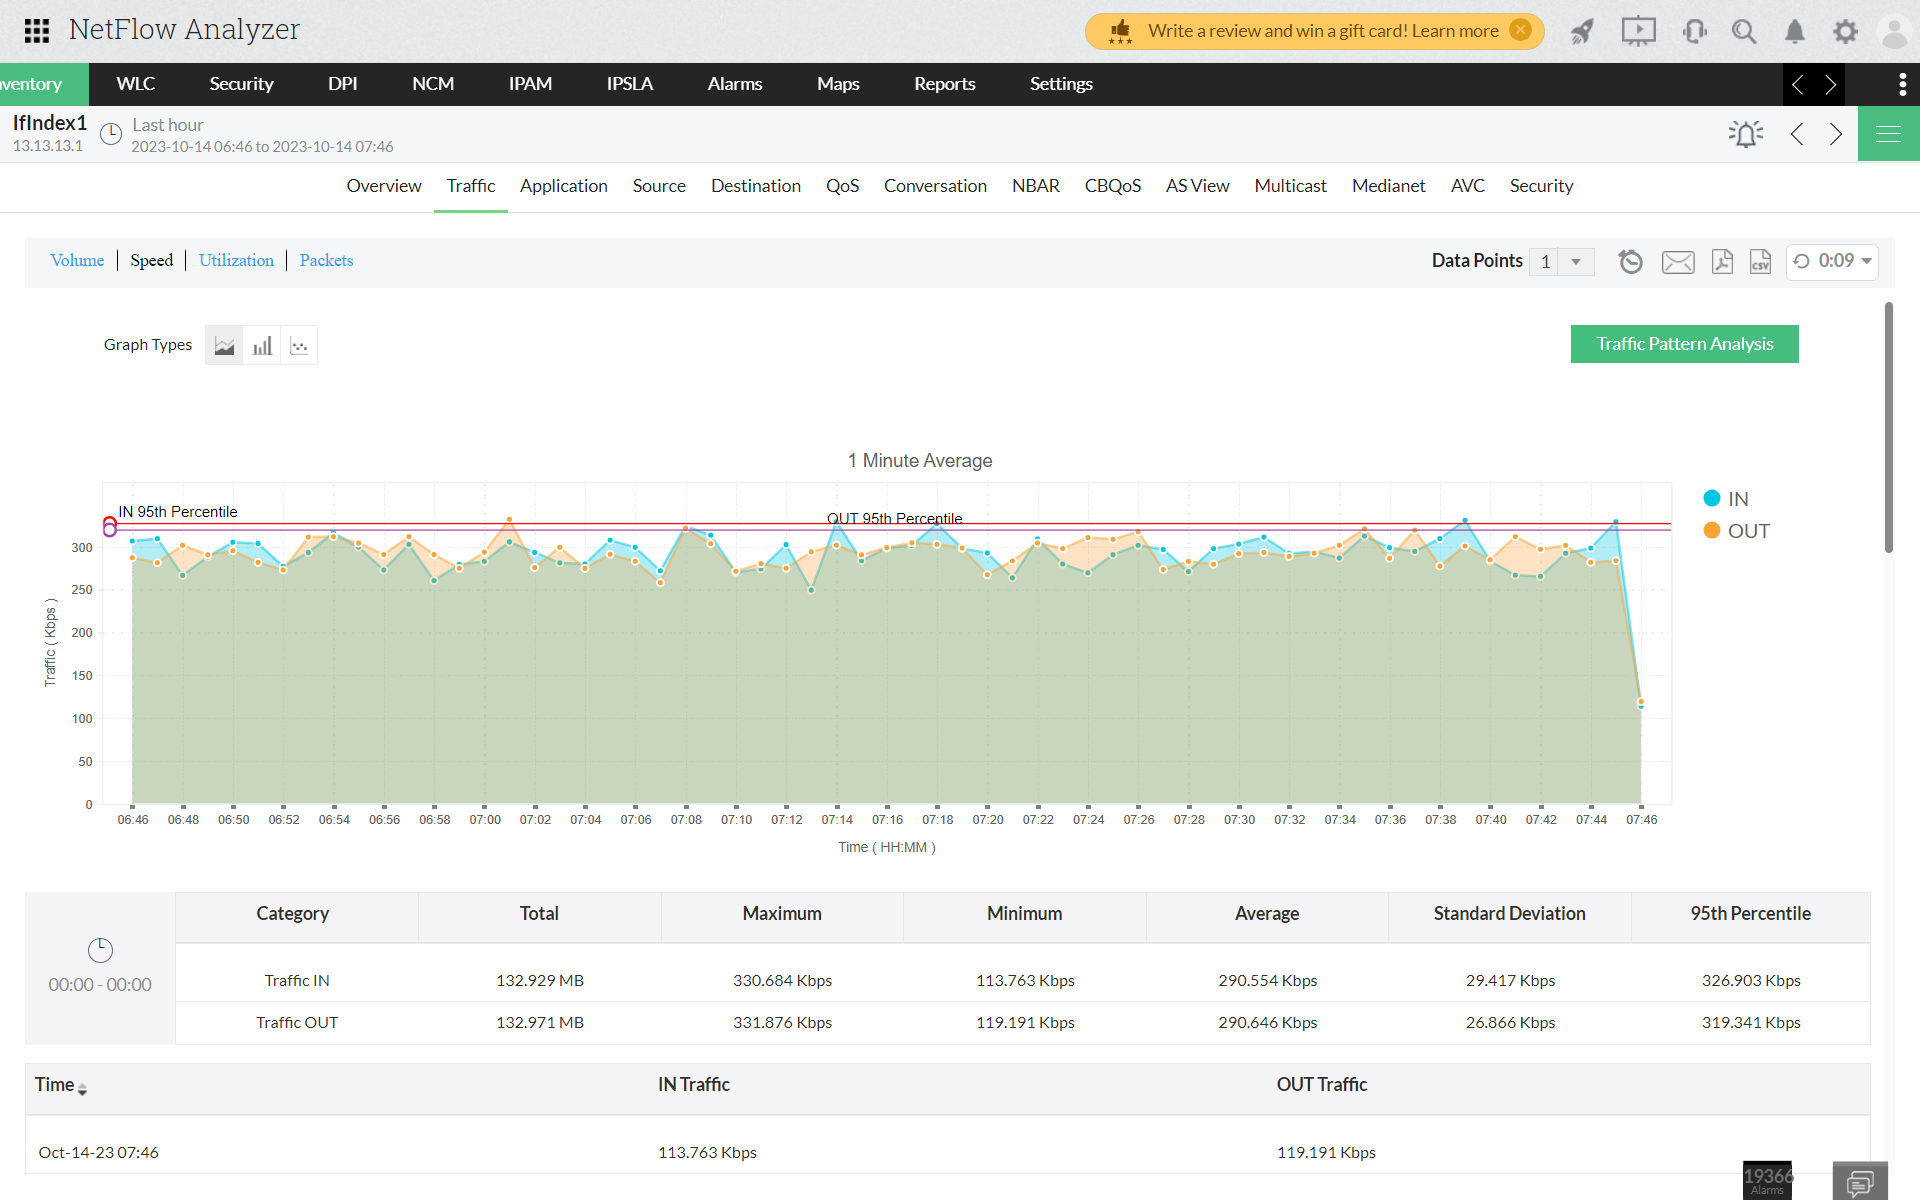
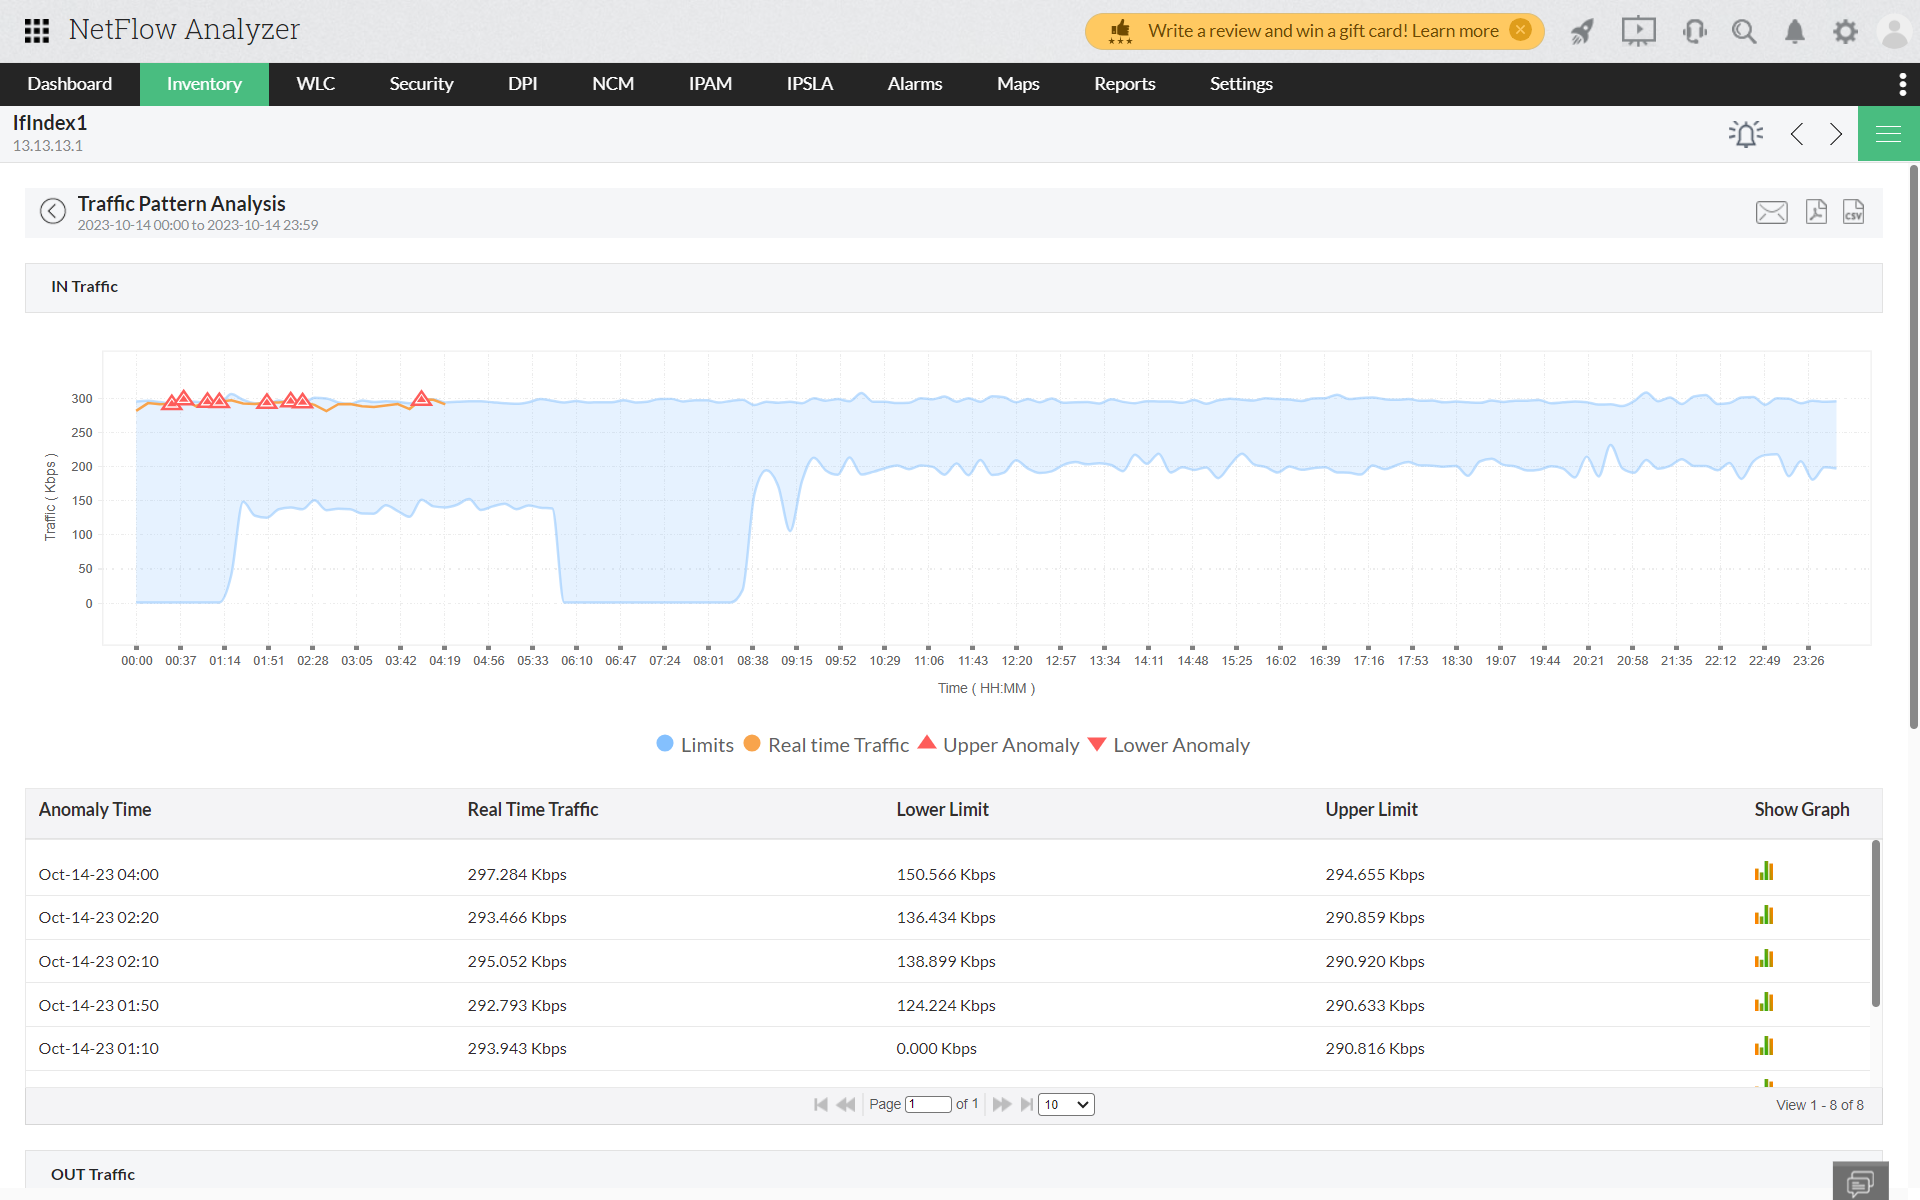
You can now view the traffic Pattern Analysis for your selected interface, separately for IN and OUT traffic.
IN Traffic
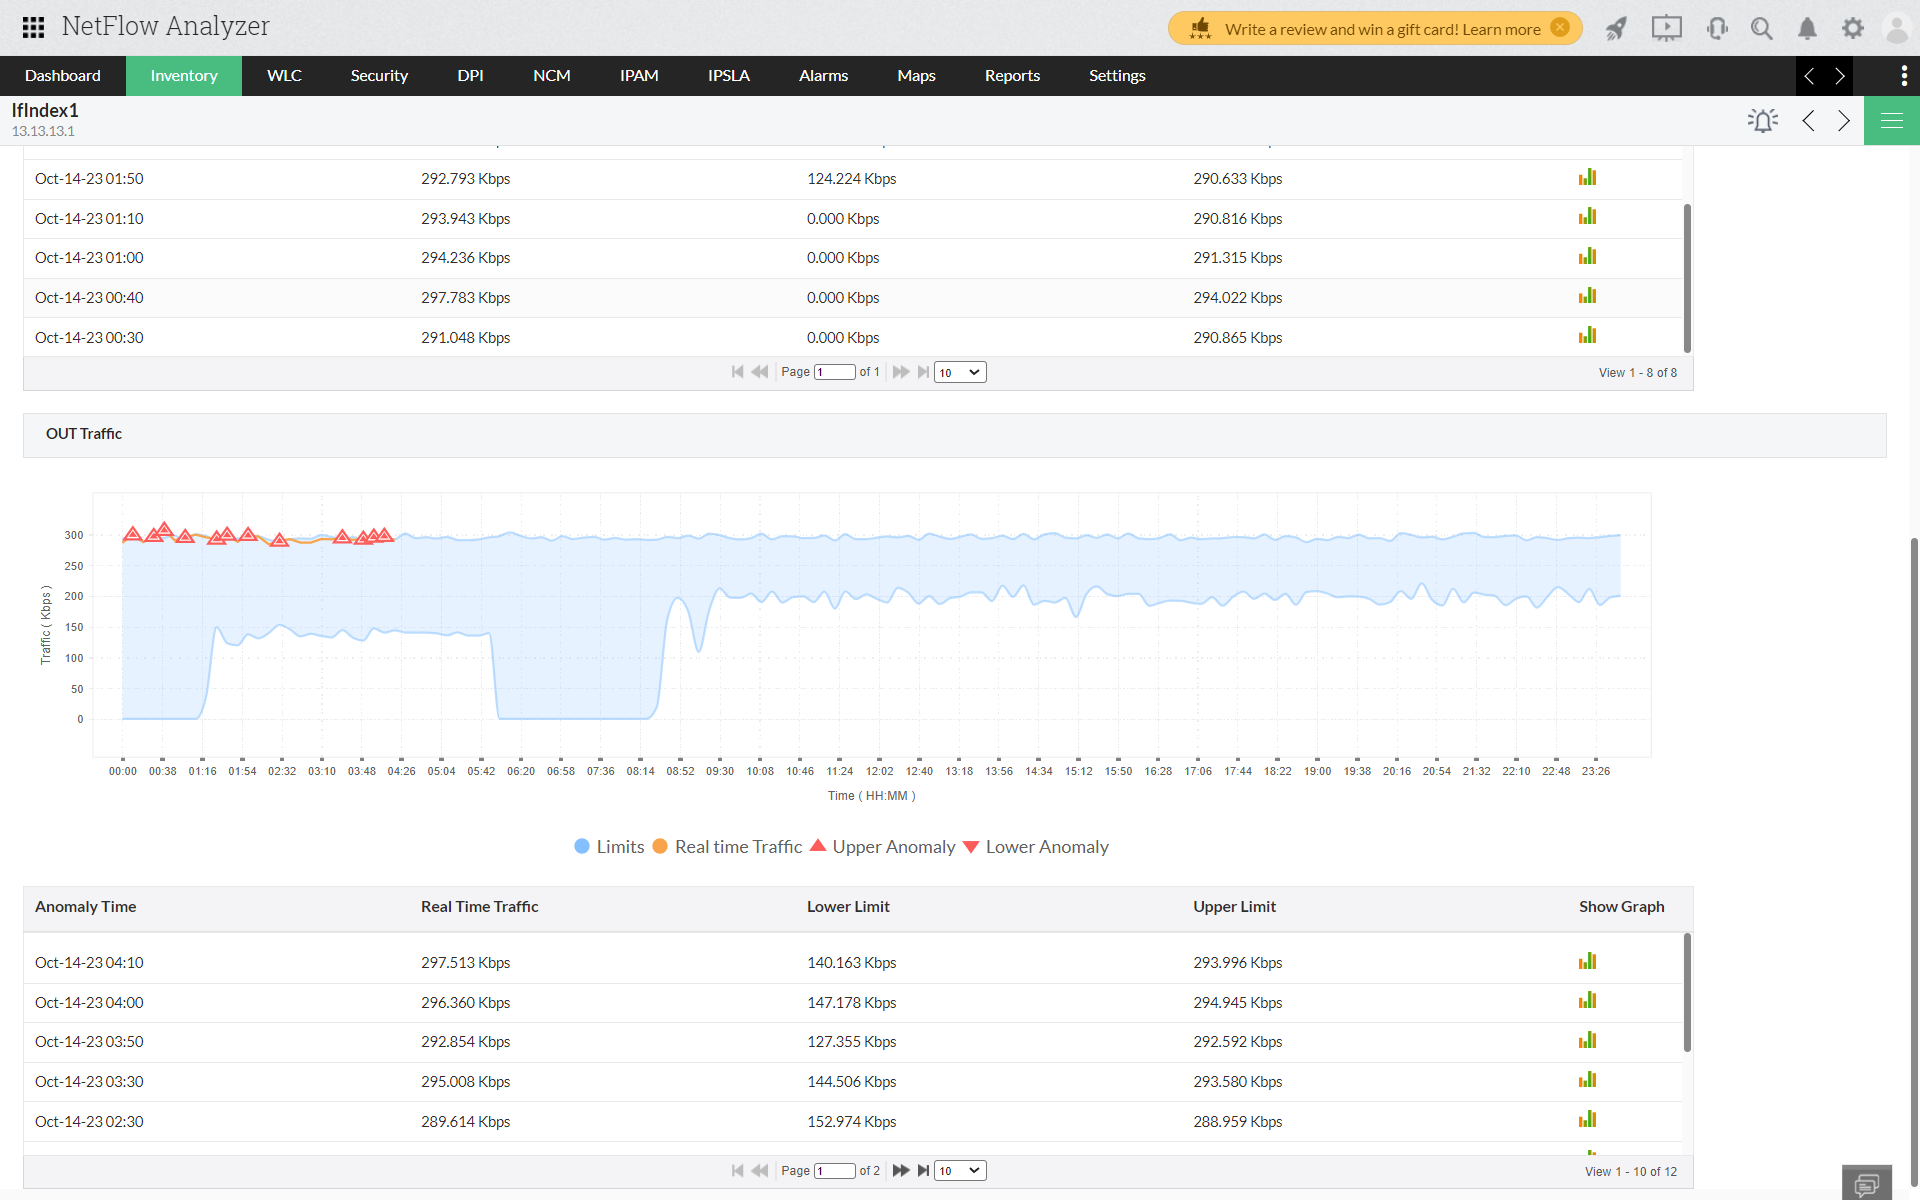
OUT Traffic
Thank you for your feedback!
We are sorry. Help us improve this page.