
View Windows event logs using the Windows Event Viewer
Last updated on:In this page
What are Windows logs?
Windows logs are a repository of information about the system's activities. This article will outline the step-by-step instructions for viewing and interpreting Windows event logs through a native tool called Windows Event Viewer. It also outlines how ManageEngine EventLog Analyzer, comprehensive log management software, can help you with event log analysis.
To view and analyze event logs, ensure that you have enabled logging in your Windows systems. Once logging and auditing policies are set and enabled, you can view the generated event logs using the native Windows Event Viewer tool.
What is the Windows Event Viewer?
The Windows Event Viewer is a built-in tool in Microsoft Windows operating systems that acts as a central logging repository for event logs. The primary objectives of the Windows Event Viewer are to:
- Keep track of events, including system, security, application, and other events happening in the system in chronological order.
- Provide an organized view of logs by grouping them into different categories for better interpretation.
- Aid in troubleshooting operational and system issues.
- Ensure the security posture of the system by facilitating security monitoring.
- Allow filtering and searching of event logs with specific criteria based on event ID, source, and log level for forensic or root cause analysis.
In a nutshell, the Windows Event Viewer is a native tool that can be used to analyze what's happening within the system, diagnose problems, and maintain system health and security.
How to view Windows event logs
Windows event logs can be viewed and accessed using the Windows Event Viewer.
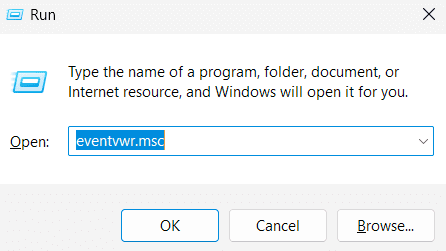
To access the Windows Event Viewer, press the Windows Key + R on your keyboard, type eventvwr.msc into the Run dialog, and press OK. This action will launch the Event Viewer application.
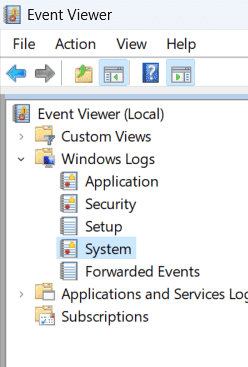
In the left pane, you will see the Windows Logs option, which expands to five categories of Windows logs:
- Application: This records events generated by the software applications installed on the system. Application logs record software errors, crashes, application launches and shutdowns, and informational events such as configuration changes and successful installations.
- System: System logs specifically refer to the events related to core functionalities in the Windows operating system. This encompasses events pertaining to the functioning or failures of hardware, including drivers, devices, and other hardware components. Events surrounding system startup and shutdown are also recorded in this category.
- Security: Security logs play a crucial role in monitoring and maintaining the security posture of the system. Security logs record security-related events, like login attempts, object access, privilege changes, and security policy changes, providing insight into potential security breaches.
- Setup: Setup logs record software- and system-setup-related events, like installations, updates, configurations, and changes to system settings.
- Forwarded Events: This category, acting as the central repository of event aggregation, allows you to view the events forwarded from other systems within the network.
Clicking a specific log record provides detailed information in a pop-up window and helps you interpret event logs effectively. Understanding the structure of event logs is crucial for accurate analysis and troubleshooting. Let's explore the structure of logs and how to interpret them in more detail.
Setup event logs are present in all versions of the Windows Event Viewer; however, forwarded event logs are exclusively accessible in Windows Pro, Enterprise, Education, and most server editions, excluding Home editions.
Interpreting event logs and log levels
Structure of a Windows event log:
Each event log entry contains essential information, including:
- Event ID: A unique identifier associated with every event.
- Source: The application or system component that recorded the event.
- Date and time: Denotes when the event occurred.
- Level: Indicates the severity level of the event (such as critical, error, warning, information, or verbose).
- User: The user account associated with the event.
- Description: A detailed explanation of the event.
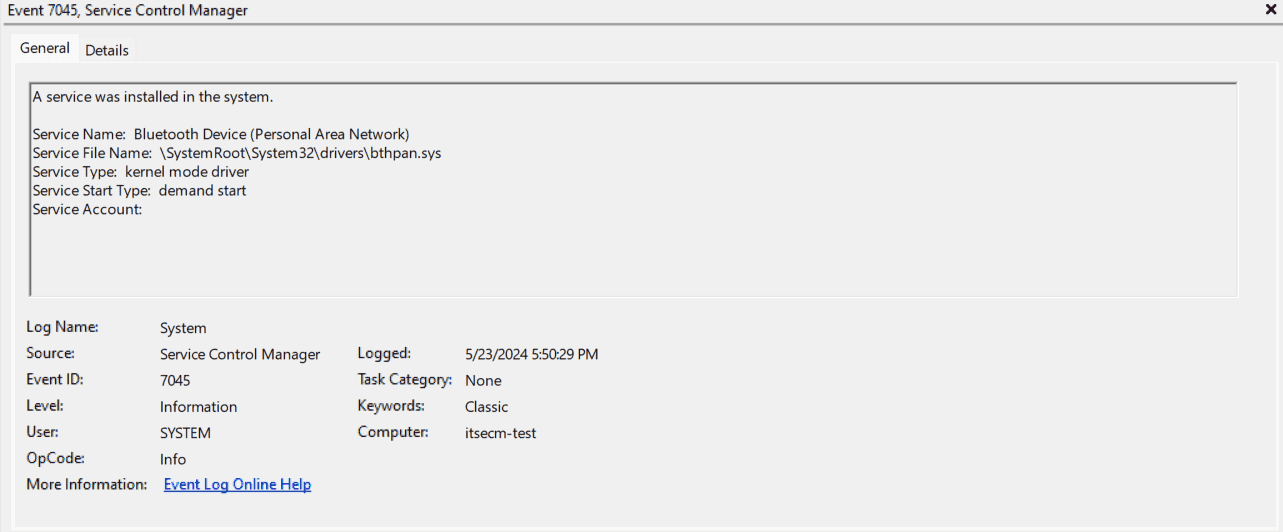
The General and Details tabs contain a description and specific error codes or paths that failed.
The above event log denotes the installation of a new service on your system. The Service Control Manager, responsible for managing background services, logs details about the newly added service, such as its name, location (executable file path), and type. This event message indicates that a standard Windows service for Bluetooth connections, named Bluetooth Device (Personal Area Network), was installed on the computer itsecm-test on May 23, 2024, at 5:50pm. It is a kernel mode driver with privileged access to system hardware and starts on demand. Event ID 7045 is usually informational and does not indicate a problem. However, if you are unfamiliar with the service name or if the installation seems unexpected, it should be investigated further.
Understanding common Windows log levels
Windows log levels are the severity assigned by the Windows Event Viewer based on the nature of the event. These Windows log levels allow you to quickly identify and prioritize issues, ensuring system stability and security.
The different types of Windows log levels include:
- Critical: Critical events indicate serious issues that demand immediate attention, as they have the potential to cause system instability or failure, impacting overall system functionality. Events such as a system reboot without a clean shutdown (event ID 41) or a critical disk error (event ID 1001) are some examples of logs that have a critical log level.
- Warning: Warning events serve as early indicators of potential problems that could result in errors if left unattended. They prompt proactive measures to prevent future complications. Events such as registry files in use by other applications or services (event ID 1530) or a system that cannot log a user in because of domain name unavailability (event ID 5719) are some examples of warning log level events.
- Information: Information events offer general operational details about the system or applications, aiding in tracking system activities and providing status updates. Events such as applications started successfully (event ID 1000) or a computer being successfully booted without any problems (event ID 6005) are some examples of information log level events.
- Error: Error events highlight significant issues that require resolution. While they may not lead to immediate system failure, they can affect the performance or functionality of specific components or applications. Events such as an error occurring while attempting to start a service (event ID 1003) or a fatal error resulting in a crash (event ID 1004) are some examples of error log level events.
- Verbose: Verbose or debug events provide detailed diagnostic information essential for troubleshooting specific issues. They are usually enabled during debugging sessions or when comprehensive logging is necessary for analysis. Events such as application crash analysis (event ID 7001) or the capture of network packet information for troubleshooting network issues (event ID 7003) serve as examples of debug events.
Log levels are predefined by application developers or the system to categorize the severity or importance of events. However, you do have significant control over how events are captured, filtered, and displayed. For instance, you can enhance logging detail for troubleshooting purposes or restrict it to critical information to minimize log size.
To effectively manage your Windows system, it's essential to understand and monitor critical Windows event IDs. Here are some crucial event IDs to monitor for:
- Windows event ID 4625 (Security): Keep an eye out for patterns of repeated login failures, which may indicate a brute-force attack. This event indicates a failed attempt to log in to a system.
- Windows event ID 7045 (System): This event tracks changes related to critical services or applications.This log entry occurs when a service is installed, modified, or removed.
- Windows event ID 1000 (Application): This event is logged when an application encounters a severe error or crash, requiring investigation to ensure system stability.
- Windows event ID 1102 (Security): Monitor security logs for unexpected clearing, as regular review is essential to uphold the integrity of audit trails. Event ID 1102 indicates a critical system process terminated unexpectedly, resulting in system instability
How to correlate event logs
The first step to effectively correlate Windows event logs is to collect the logs from different systems and applications in a central location. Centralized logging and archiving not only helps in event correlation but also helps in meeting the critical requirements of different regulatory mandates, including the PCI DSS, the GDPR, SOX, FISMA, and HIPAA.
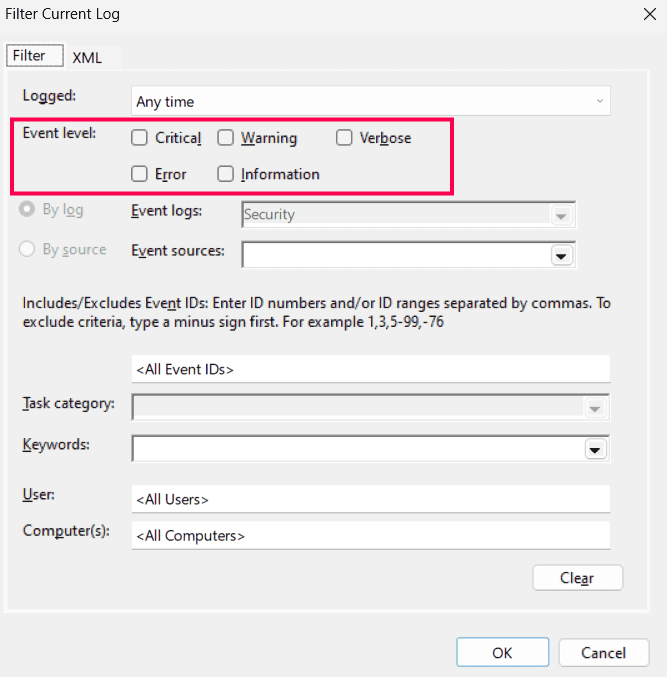
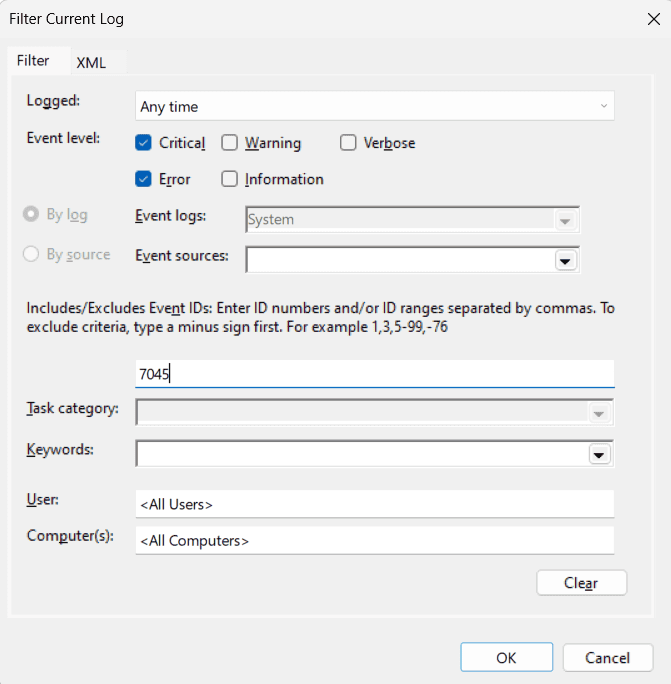
To filter logs, simply right-click a specific log (like System) and choose Filter Current Log. Then, in the Actions pane, use the Find option to look for specific keywords or event IDs.
For example, if you're dealing with a networking connectivity issue on a Windows machine, focus on checking logs under System or Networking. To systematically correlate these logs, proceed as follows:
Here's how you can correlate logs using the Event Viewer:
- Open the Event Viewer and navigate to the System logs.
- Filter logs to show events from the last 24 hours.
- Look for events with relevant keywords, like network, connectivity, or specific error codes related to networking.
- Identify events such as Network adapter disconnected followed by Failed to obtain IP address and DNS resolution failed.
- Correlate these events to understand that the network adapter disconnection might have caused the failure to obtain an IP address and subsequent DNS resolution issues.
- Check for additional events related to network adapter reconnection or configuration changes.
- Analyze the correlation and determine if the issue is due to a hardware problem, misconfiguration, or other factors.
- Take appropriate action, such as checking cable connections, updating network drivers, or resetting network configurations.
Viewing and interpreting application crash logs in the Windows Event Viewer
Let's consider another scenario where you want to detect if any device (except Device-TestMachine1234) experiences at least five application crashes within 180 minutes.
Here's a step-by-step process to correlate application crash logs using the Event Viewer:
Step 1: Open the Event Viewer and create a custom view named Application crashes excluding device-TestMachine1234. To do this, in the left sidebar, right-click Custom Views and choose Create Custom View. In the dialog box that appears, set the time range to Last 24 hours or any desired time frame. Under Logged, choose Application from the drop-down menu. Check the box next to Error under Event levels. In the Event IDs box, type 1000 to filter application crash events.
Step 2: Review the custom view for devices with multiple crash events.
Step 3: Analyze the time stamps to determine the frequency of occurrences and identify devices surpassing the threshold of five crashes within 180 minutes. Prioritize devices with the highest number of crashes for further investigation.
Step 4: Record device names, crash time stamps, and counts, and share the summary report with relevant teams for further action.
By following these steps, you can effectively monitor and address application crashes, ensuring the stability and reliability of your system.
Remember that the Event Viewer can only correlate logs within the system it's running on—it can't correlate logs from multiple systems simultaneously. While using the Event Viewer on a domain controller can provide some insights into user activities across the domain, it's often cumbersome, time-consuming, and inefficient for large-scale analysis. The Event Viewer lacks automation capabilities for real-time monitoring, alerting, and automated response to security incidents. If you're seeking a robust solution to overcome these challenges, choose advanced event correlation tools like EventLog Analyzer to automate this process and transform your log data into actionable insights. The solution provides sophisticated log analysis capabilities and helps enhance your security posture and operational efficiency.
