Active Directory, Microsoft 365, and Exchange management and reporting
Hybrid AD, cloud, and file auditing; security; and compliance
Identity security with adaptive MFA, SSPR, and SSO
Reporting, auditing, and monitoring for hybrid Exchange and Skype
Active Directory, Microsoft 365, and Exchange backup and recovery
Hybrid AD, cloud, and file auditing; security; and compliance
SharePoint reporting and auditing
Microsoft 365 security
Cloud security monitoring and analytics
File auditing, data leak prevention, and data risk assessment
File security and storage analysis
Automated patching across multiple OSs and over 850+ third-party apps
Simplified third-party patch deployment via ConfigMgr and Intune
Seamless mobile device management from onboarding to retirement
Remote troubleshooting with integrated chat, voice, and video
Automated OS image creation and seamless role-based deployment
Prioritization-focused enterprise vulnerability management
App control and endpoint privilege management software
Data theft prevention with strict peripheral device control
Browser security with isolation, lockdown, and activity tracking
Sensitive data protection and compliance for endpoint devices
Real-time ransomware mitigation and file recovery for business continuity
Full-stack observability with AIOps and digital experience monitoring
AI-powered, all-in-one SaaS platform for observability and digital experience monitoring
Digital experience, application performance, and infrastructure monitoring
All-in-one vendor risk assessment tool to ensure domain security
Network, server, and storage performance monitoring
Bandwidth monitoring and traffic analysis
Network change and configuration management
Firewall rule, configuration, and log management
IP address and switch port management
Centralized IT alert management
Status pages for real-time status and incident communication
A cloud-native identity platform for workforce IAM
Full-stack service management for enterprises
IT asset management with an integrated CMDB
Unified endpoint management and security
Comprehensive mobile device management
Enterprise remote access
Automated multi-OS patch management
Full-stack monitoring for IT admins, DevOps, and SREs
Status pages for real-time status and incident communication
Cloud cost management for modern software teams
SaaS management platform to maximize ROI
Centralized IT alert management
Secure your IT infrastructure and prove compliance from the cloud
AI-powered unified analytics platform to correlate all IT data
An all-in-one DNS management service to keep your business online
Low-code application development platform
Remote support software
Collaborative project management
Agile project management
All-in-one collaboration tool for unified communication
Secure email hosting solution for businesses
All-in-one video conferencing solution for remote business meetings
All-in-one AR remote assistance software solution for remote collaboration.
Unified network monitoring and endpoint management for MSPs
Unified Active Directory management and reporting solution for MSPs
Unified SIEM solution for MSSPs
Log management and advanced threat intelligence for MSSPs
Complete privileged access security for enterprises
Privileged password management
Full-stack service management for MSPs
NetFlow Analyzer shows the Interfaces view separately. You can select the view from the below option to view Link Up, Unknown, Link Down, Link Up and NoFlows
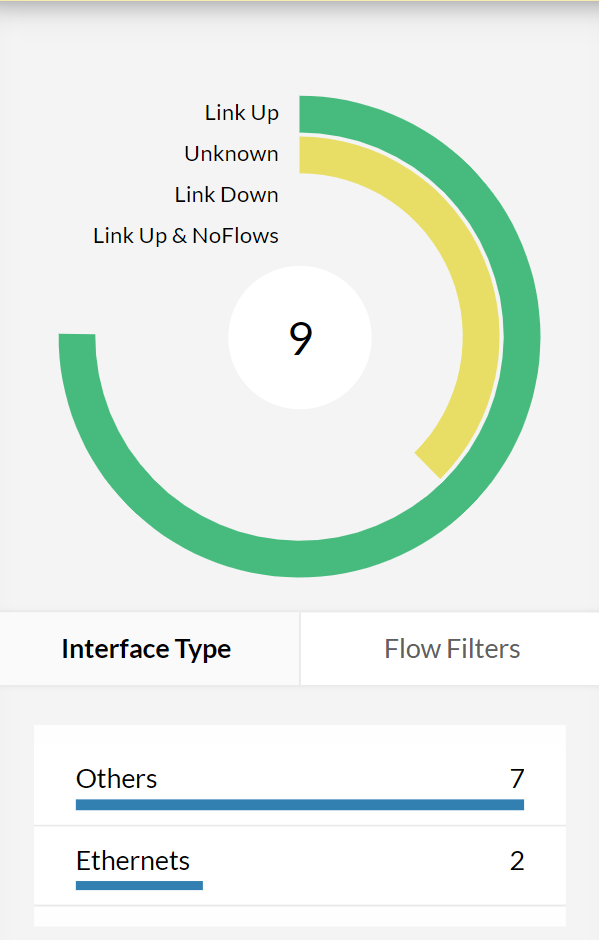
Status of interfaces can be detected based on the below icons presented beside the interface names.
New Interface
Icon | Status | Description |
Active Interface | The link is UP and flows are being received | |
Inactive Interface | The interface is responding to SNMP requests and the link is UP, but no flows received from last 10 minutes | |
![]() |
Down Interface | The interface is responding to SNMP request and the link is Down and no flow received from last 10 mins |
![]() |
Unknown Interface | The status of the interfaces is unknown and no flows received from last 10 minutes. |
![]() |
New Interface | The interfaces sending flows but not managed due to the license limit. |
You can see the Interface view in 3 different ways:
![]() |
The IN Traffic and OUT Traffic columns show the utilization and speed of IN and OUT Traffic on the respective interfaces for the past 12 hour(Today) average, you can change the average view by clicking on the clock icon %click icon%. You can click on the IN Traffic or OUT traffic bar to view the respective application traffic graph for that interface.
|
To get the real time traffic details for the interface you have to drill down the interface that you want to monitor. Clicking the interface name will give a quick view of traffic graph for the selected interface for last 12 hours.
Click on the arrow to expand the view to get the detailed information on the interface like: